Technical Breakdown on Gold Spot / USD (XAU/USD) | 1H Timeframe1. Key Observations (Volume, Gann & CVD + ADX Focused)
a) Volume Profile Insights:
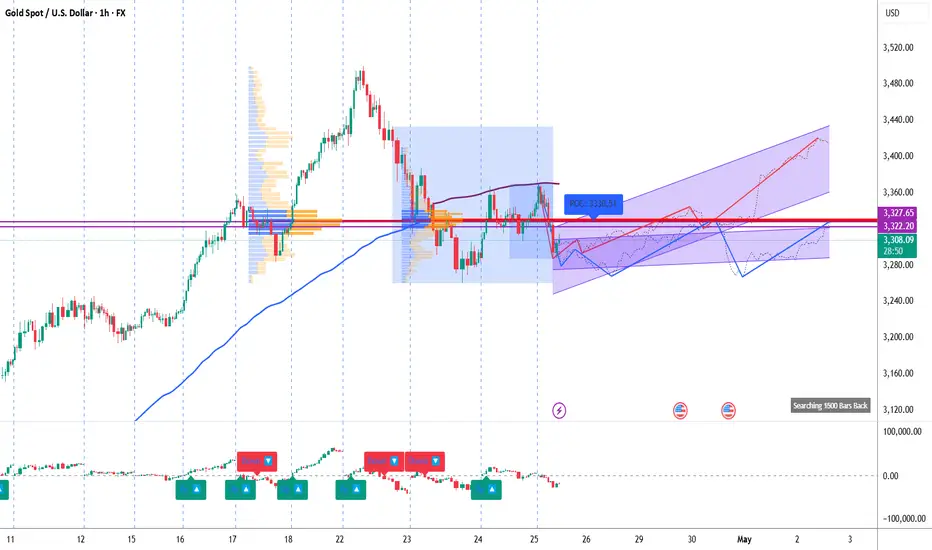
Value Area High (VAH): 3,327.65
Value Area Low (VAL): 3,287.37
Point of Control (POC): 3,325.89
High-Volume Nodes: 3,325–3,328 zone (significant consolidation & absorption).
Low-Volume Gaps: 3,280–3,290 zone (potential for fast price movement if re-tested).
b) Liquidity Zones:
Stop Clusters: Near 3,340 (previous highs), and below 3,280 (recent swing lows).
Order Absorption Zones: Strong absorption around POC (3,325), indicated by multiple rejections and volume stacking.
c) Volume-Based Swing Highs/Lows:
Swing High: 3,382 (volume spike + reversal).
Swing Low: 3,275 (volume increase on bullish reversal).
Current Range: Consolidation between 3,280–3,328.
d) CVD + ADX Indicator Analysis:
Trend Direction: Range-bound (CVD mixed; recent sharp upward CVD move neutralized by selling at resistance).
ADX Strength:
ADX < 20: Suggests weak trend, confirming range-bound environment.
DI+ ≈ DI-: No dominant directional strength.
CVD Confirmation:
Recent Rising CVD + No breakout above resistance = Hidden supply
Earlier bullish CVD divergence at 3,275 led to minor recovery
2. Support & Resistance Levels
a) Volume-Based Levels:
Support:
VAL: 3,287.37
Swing Low Support: 3,275
Resistance:
VAH: 3,327.65
POC: 3,325.89
Swing High: 3,382
b) Gann-Based Levels:
Recent Gann Swing High: 3,382
Recent Gann Swing Low: 3,275
Key Retracement Zones:
1/2 retracement: 3,328
1/3 retracement: ~3,311
2/3 retracement: ~3,345
3. Chart Patterns & Market Structure
a) Trend:
Range-bound (confirmed by low ADX & choppy CVD)
b) Notable Patterns:
Potential Bullish Flag within a Rising Channel (purple zone)
Channel Support: Near 3,280
Channel Resistance: 3,360–3,390
Retest of POC (3,325.89) with multiple failed attempts to close above = key resistance validation
4. Trade Setup & Risk Management
a) Bullish Entry (If CVD + ADX confirm uptrend):
Entry Zone: 3,287–3,292
Targets:
T1: 3,325
T2: 3,360
Stop-Loss (SL): 3,275 (below recent swing low)
RR: Minimum 1:2
b) Bearish Entry (If CVD + ADX confirm downtrend):
Entry Zone: 3,325–3,328
Target: T1: 3,287
Stop-Loss (SL): 3,340 (above recent rejection zone)
RR: Minimum 1:2
c) Position Sizing:
Risk only 1–2% of capital per trade.
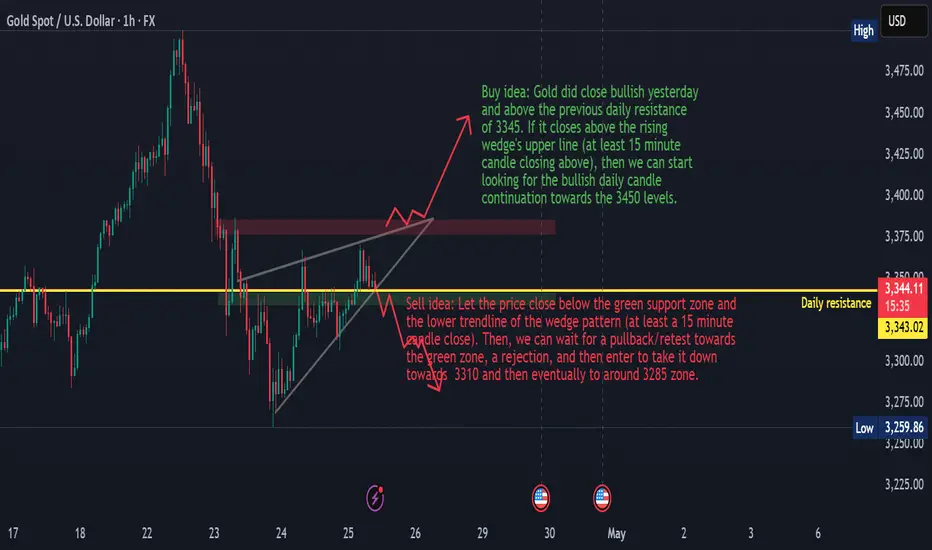
Wedge
Gold ConsolidationGold is consolidating between a rising wedge pattern at the moment. It is still in an undecided territory at the moment because the momentum in the past few days has been clearly down, but yesterday's daily candle managed to close above the previous daily resistance level of 3,345. If we see healthy candles closing below that level (which will also break the lower boundary of the wedge pattern), then we can start looking for sells. I will look for buys only if the price closes above the resistance level (marked as a red zone in the chart) at around 3,380.
Total 3, do flags point to the target area?Welcome back dearest reader,
Today i have a very interesting analysis for you, quite some valuable time was put into this.
What i've noticed is the following:
-From april 2021 untill july 2021 total 3 has been trading in a bullish wedge flag, when we continue the lines on the full candle bodies the apex pointed to the top of that flag durationwise
-August 2022 till october 2023, extend the trendlines, apex march 2024, look up. Oh.
-March 2024, october 2024 --> apex december 2024, look up. Oh.
Now:
-January 2025, april/may 2025, apex june 2025, look up. Oh.
-I used the fractal from july 2021 as i think we're in this period
-Upward sloping channel from october 2022 untill now could provide insights as to what the target price might be, HH and HL
Target: 1.5T
Also check out my BTC.D idea, these would coincide perfectly
~Rustle
Is it certain this will happen? No-one has a glass ball, all we have are patterns based on past performance, this is no guarantee. But it does look good.

SOLANA (SOL) – Bearish Breakdown Incoming? Watch These Key LevelHey Traders!
#SOL is currently showing strong bearish signals on the 2H timeframe:
🔸 Rising Wedge Pattern spotted — a classic bearish reversal structure.
🔸 Bearish Divergence on RSI — momentum is weakening while price continues higher.
🔸 Breakdown from the wedge already occurred — confirming the initial weakness.
Next Key Support Zone: $120–$130
This zone has held multiple times, but a clean break below followed by a retest could offer a high-probability short setup.
🎯 Trade Plan:
We’re watching for:
Break of the $120–$130 support
Retest of the broken level
Entry on confirmation with strict risk management
💬 What’s your take on #SOL? Are you bullish or bearish? Drop your thoughts below!
🧠 Trade smart, manage your risk, and follow for more TA like this!
📌 Like, comment, and share if you found this helpful.
#SOL #Solana #CryptoTrading #BearishDivergence #RisingWedge #TechnicalAnalysis #TradingSetup #ShortTrade #CryptoTA #Altcoins

Bitcoin Bulls Eye $95K as Upside Momentum BuildsAfter a bullish wedge break and having cleared the key 50-day moving average earlier this week, bitcoin bulls will now be eyeing a break above $95,000, especially with indicators such as RSI (14) and MACD signalling strengthening topside momentum.
A break and close above $95,000 would generate a bullish setup, allowing for longs to be established above with a stop beneath for protection. While some resistance may be encountered around $100,000, a move beyond that psychologically important level may encourage bulls to look for a run towards the record high above $108,000.
In the interim, bids have been noted at $91,750 with sellers emerging on pushes above $94,000.
Good luck!
DS

GOLD → False breakdown and change of mood...FX:XAUUSD is strengthening after a false breakdown of support at 3288, with the change in fundamental sentiment due to US statements on the tariff war also providing support for the price.
On Thursday, gold rose from a weekly low of $3,260, supported by a weaker dollar and renewed concerns about US trade negotiations with China and Japan.
Optimism about tariff cuts quickly faded after denials from the White House. Weak US business activity data is fueling talk of a possible Fed policy easing, which is also supporting gold. The markets remain focused on trade news and Trump's statements.
Technically, gold could reach the liquidity cluster at 3314 and continue to rise towards strong resistance at 3370.
Resistance levels: 3342, 3370, 3387
Support levels: 3314, 3288, 3270
Below 3314 and below 3288, a liquidity pool has formed, which the market is likely to test before continuing its growth. It is too early to talk about a resumption of a strong rally, as the situation between the US and China is complicated, as are the negotiations on the situation in Eastern Europe, which seem to be moving towards talks, but every time something goes wrong...
Best regards, R. Linda!

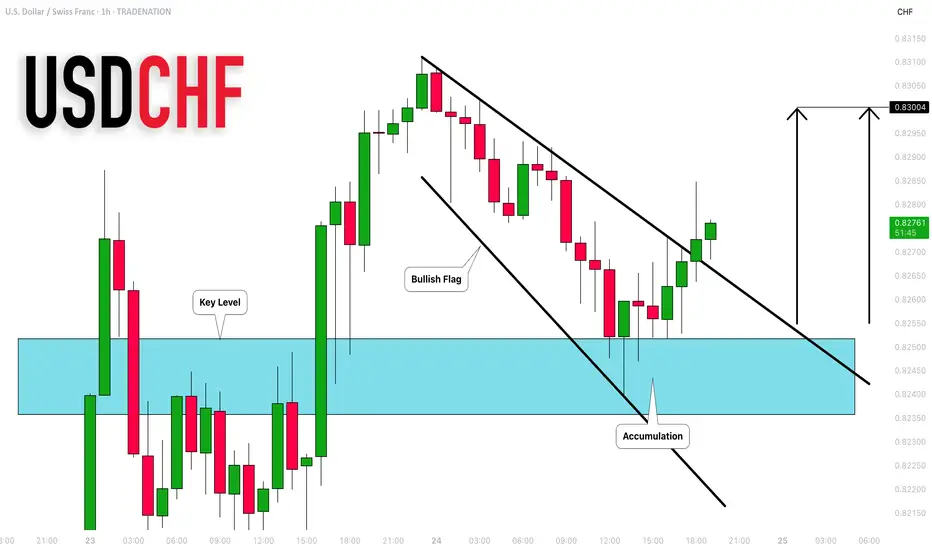
USDCHF: Very Bullish Price Action 🇺🇸🇨🇭
There is a high chance that USDCHF will go up from
the underlined blue support.
As a confirmation, I see a bullish breakout of a resistance line
of a bullish flag pattern on an hourly time frame.
Target - 0.83
❤️Please, support my work with like, thank you!❤️
I am part of Trade Nation's Influencer program and receive a monthly fee for using their TradingView charts in my analysis.
GOLD (XAUUSD): Strong Bullish Signs?!
Gold strongly corrected from 3500 psychological level.
After a test of the underlined intraday support cluster,
the market started to leave strong bullish clues.
After a false violation of the support, the price accumulated a bit
and broke a resistance line of a falling wedge pattern on an hourly time frame.
With that move, Gold also managed to confirm a local Change of Character CHoCH.
All these bullish signals indicate a highly probable continuation of a growth.
The price may move up at least to 3377 level easily.
❤️Please, support my work with like, thank you!❤️
I am part of Trade Nation's Influencer program and receive a monthly fee for using their TradingView charts in my analysis.

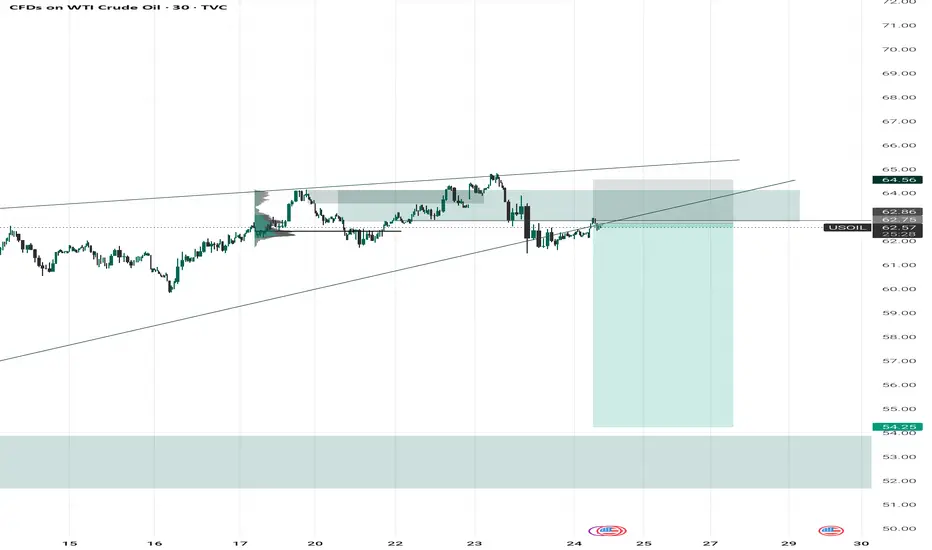
USOIL – Wedge Whisper Turned Rejection Roar
Crude just whispered its next move — and it’s not looking bullish.
After a clean rising wedge breakdown, price is now retesting the underside of the structure, right inside a high-volume supply zone (62.75 - 64.50). This zone screams rejection, especially with that wick-heavy rejection candle teasing a deeper move.
This setup aligns with classic market psychology — buyers trapped at the top, smart money looking for that short squeeze to the downside.
Short Bias Activated
Sell Zone: 62.75 - 64.50
Target: 54.25
Invalidation: Break and close above 64.60
If this plays out, it’s a straight-up slide to the next major demand zone. Eyes on volume and rejection confirmations!
NIVABUPANIVABUPA showing resistance breakout with decent volume and can go up to the recent arc curve depth ie approx 18%. It is very strong on weekly chart as well. Closing below 85 may change the view. keep it in your watchlist

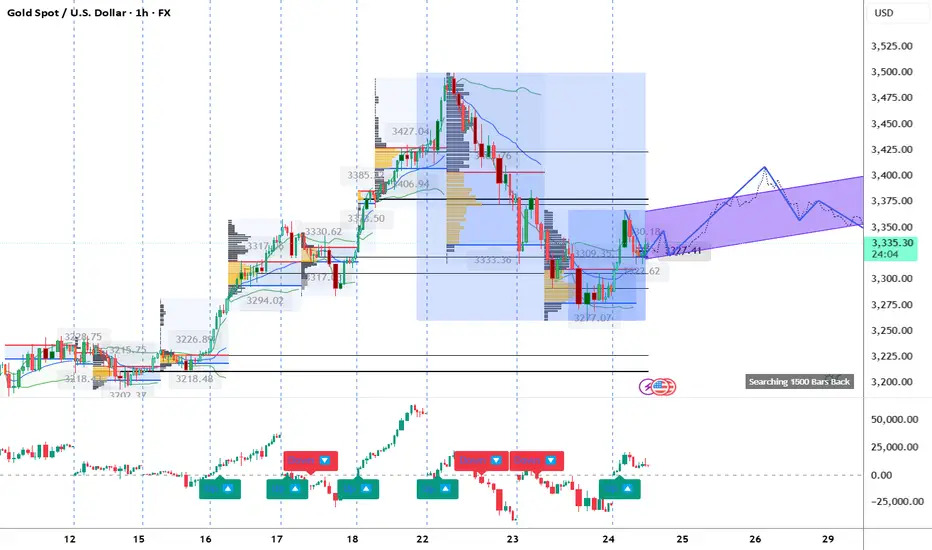
Technical Breakdown on Gold Spot / USD (XAU/USD) | 1H TimeframeTools Used: Volume Profile, Gann Levels, Cumulative Volume Delta (CVD) + ADX
1. Key Observations (Volume, Gann & CVD + ADX Focused)
a) Volume Profile Insights:
Value Area High (VAH): 3,390.67
Value Area Low (VAL): 3,277.14
Point of Control (POC): 3,309.96
High-volume nodes: Prominent between 3,300–3,340 zone, where price consolidated and re-accumulated.
Low-volume gaps: Seen between 3,365–3,385 and under 3,277, ideal for fast moves if broken.
b) Liquidity Zones:
Stops Likely Clustered:
Above 3,390 (last high).
Below 3,277 (recent low and VAL).
Absorption Zones (based on delta volume):
Notable order absorption around POC (3,309.96) – heavy trade activity and hold in down move.
c) Volume-Based Swing Highs/Lows:
High-volume swing low: 3,277.07 – price bounced with demand pick-up.
High-volume swing high: 3,427.04 – volume faded after breakout, leading to rejection.
d) CVD + ADX Indicator Analysis:
Trend Direction: Currently uptrend forming, CVD rising slightly with bullish structure.
ADX Strength:
ADX ~22 and DI+ > DI-: Confirms beginning of a potential uptrend.
CVD Confirmation:
Rising CVD + bullish candles: Demand increasing, especially around POC reclaim.
2. Support & Resistance Levels
a) Volume-Based Levels:
Support:
VAL: 3,277.14
POC: 3,309.96
Swing low: 3,277.07
Resistance:
VAH: 3,390.67
Recent rejection zone: 3,342–3,350
b) Gann-Based Levels:
Confirmed Gann High: 3,427.04
Confirmed Gann Low: 3,277.07
Key Retracement Levels:
1/3 retrace: ~3,335
1/2 retrace: ~3,352
2/3 retrace: ~3,370
3. Chart Patterns & Market Structure
a) Trend:
Bullish, supported by ADX > 20 and rising CVD confirming new leg up.
b) Notable Patterns:
Falling wedge breakout confirmed from 3,277 support.
Channel projection points to potential continuation toward 3,370–3,390.
POC retest success showing strong reaccumulation.
4. Trade Setup & Risk Management
a) Bullish Entry (If CVD + ADX confirm uptrend):
Entry Zone: 3,310–3,320
Targets:
T1: 3,350
T2: 3,390
Stop-Loss: Below 3,277
RR: Minimum 1:2
b) Bearish Entry (If trend invalidates):
Entry Zone: 3,390–3,400 (retest rejection)
Target:
T1: 3,310
Stop-Loss: Above 3,427
RR: Minimum 1:2
c) Position Sizing:
Risk only 1–2% of total capital per trade.
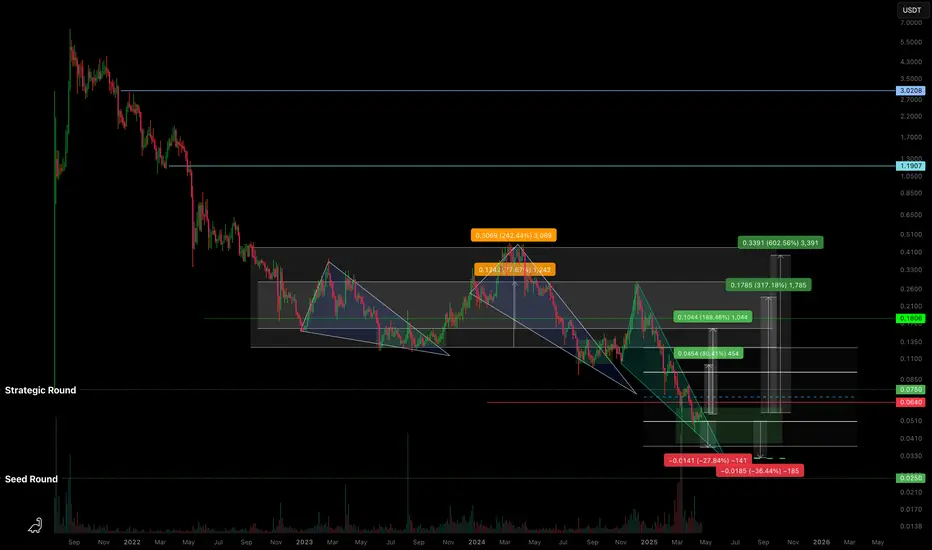
C98USDT — Descending Wedge & High R/R ZoneBased on the current structure, BINANCE:C98USDT is moving within a descending wedge , approaching zones that align with early investor positions.
🔍 What I’m seeing:
Potential drop into the range of a previous horizontal channel - marked on the chart.
We've already reached the Strategic Round level; below that is the Seed Round .
Assuming the project isn’t abandoned, it makes sense to expect investor defense in this zone.
From what I observe, there's likely accumulation happening from weak hands - at a discount .
🛡️ Approach:
As I’ve said before - you can’t treat coins like this in isolation .
They should be traded as part of a group of low-liquidity tokens , with proper risk management .
You can’t know in advance which one will “survive” without insider info from the team.
So the key is having a solid strategy and managing your portfolio and risk wisely .
📈 Targets:
Potential breakout targets from the wedge are marked on the chart.
If the market remains weak, I’ve noted a lower zone where consolidation might occur (sideways chop within a horizontal channel).
💭 Opinion:
The market is “paused” and waiting for a catalyst. You can’t rush it.
But zones like the current one on BINANCE:C98USDT seem attractive in terms of risk/reward .
The goal isn’t to guess - it’s to follow a pre-built strategy and stay focused .
📌 As always, this is not financial advice. Just my personal take and observations on the structure.
Real Success Rates of the Falling Wedge in TradingReal Success Rates of the Falling Wedge in Trading
The falling wedge is a chart pattern highly valued by traders for its potential for bullish reversals after a bearish or consolidation phase. Its effectiveness has been extensively studied and documented by various technical analysts and leading authors.
Key Statistics
Bullish Exit: In 82% of cases, the exit from the falling wedge is upward, making it one of the most reliable patterns for anticipating a positive reversal.
Price Target Achieved: The pattern's theoretical target (calculated by plotting the height of the wedge at the breakout point) is achieved in approximately 63% to 88% of cases, depending on the source, demonstrating a high success rate for profit-taking.
Trend Reversal: In 55% to 68% of cases, the falling wedge acts as a reversal pattern, signaling the end of a downtrend and the beginning of a new bullish phase.
Pullback: After the breakout, a pullback (return to the resistance line) occurs in approximately 53% to 56% of cases, which can provide a second entry opportunity but tends to reduce the pattern's overall performance.
False Breakouts: False exits represent between 10% and 27% of cases. However, a false bullish breakout only results in a true bearish breakout in 3% of cases, making the bullish signal particularly robust.
Performance and Context
Bull Market: The pattern performs particularly well when it appears during a corrective phase of an uptrend, with a profit target reached in 70% of cases within three months.
Gain Potential: The maximum gain potential can reach 32% in half of cases during a bullish breakout, according to statistical studies on equity markets.
Formation Time: The wider the wedge and the steeper the trend lines, the faster and more violent the post-breakout upward movement will be.
Comparative Summary of Success Rates:
Criteria Rate Observed Frequency
Bullish Exit 82%
Price Target Achieved 63% to 88%
Reversal Pattern 55% to 68%
Pullback After Breakout 53% to 56%
False Breakouts (False Exits) 10% to 27%
Bullish False Breakouts Leading to a Downside 3%
Points of Attention
The falling wedge is a rare and difficult pattern to correctly identify, requiring at least five contact points to be valid.
Performance is best when the breakout occurs around 60% of the pattern's length and when volume increases at the time of the breakout.
Pullbacks, although frequent, tend to weaken the initial bullish momentum.
Conclusion
The falling wedge has a remarkable success rate, with more than 8 out of 10 cases resulting in a bullish exit and a price target being reached in the majority of cases. However, it remains essential to validate the pattern with other technical signals (volume, momentum) and to remain vigilant against false breakouts, even if their rate is relatively low. When mastered, this pattern proves to be a valuable tool for traders looking for optimized entry points on bullish reversals.

WOLFUSDT Poised for Breakout from Mini Descending WedgeWOLFUSDT is consolidating within a mini descending wedge, now approaching breakout zone near 0.0000285. A clean move above wedge resistance could trigger momentum toward 0.0000654, with 0.0001142 as a mid-term objective. External supply remains at 0.0002386–0.0002922. Holding above the demand zone keeps bullish bias intact.

Falling Wedge The current price action of GAS/USDT is forming a falling wedge pattern, typically a bullish reversal pattern, suggesting a potential breakout to the upside.
Targets are mentioned. Let me know if i'm doing anything wrong. Thank you

ATH eventually for VODAFONELooks like an ATH is possible for VODAFONE eventually. Long term trade, not any time soon, but it looks like it could be approaching a long term bottom here. RSI is starting to potentially bottom on the 3M chart. Chart has also developed a long term falling wedge pattern.

ARB Secondary trend. 24 04 2025Logarithm. Time frame 3 days (less is not necessary).
⚠️ Currently a decline from the maximum of -90% . For assets of such liquidity, these are not the lowest values, but perhaps the previous hype played a role in this. Work from the average price, or on a breakout , and you will not care when the reversal occurs. The main thing is to distribute the entry and exit points after the purchase in advance, that is, distribute the risk and profit. And, after that, no longer be interested in the asset, or opinions, or fictitious positive / negative news to stimulate demand / supply of “stupid money”. Do not get stuck in market noise and unnecessary, fear-driven or greed-driven opinions.
Main trend (the entire history of cryptocurrency trading), for clarity of pricing and the zone for work now, which is discussed.
ARB Main Trend 24 04 2025
🟣 Local trend. At the moment, a wedge-shaped formation has formed in it, there is an attempt to break through it and the price is clamped.
1️⃣ If this zone of minimums is held — for a start, the potential for a downward trend of the secondary trend (shown with a red line).
2️⃣ Then, when it is broken through , — to the channel median (green dotted line).

$SLV pullback before the real bull trend starts?Silver looks to be trading in a large rising wedge, I could see the possibility of a pretty substantial pullback should price break down from the pattern.
We have the potential to fall between 30-60% from here should price break the pattern. The level to look for is a break of $22 on the downside, that will be the confirmation that we're moving lower.
I've marked off important support levels on the downside if we break down. A break of the upper resistance would invalidate the idea.

XAUUSD FALLING WEDGE PATTERNI Created This XAUUSD Chart Analysis In 30-M Tf
Entry: BUY from 3325
Support zone : 3295
Target Will Be : 3380
NOTE : XAUUSD MADE FALLING WEDGE PATTERN IN 30-M AND THIS CHART IS BASED ON PERSONAL ANALYSIS FOR LEARNING PURPOSES. PLEASE USE PROPER RISK MANAGEMENT

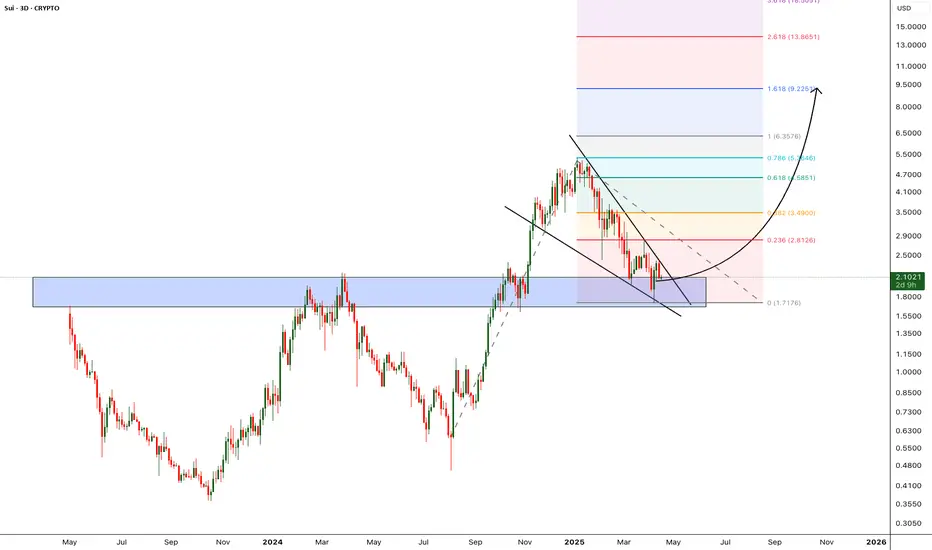
SUI - Double Digit is next - Alt season LeaderCorrection of the SUI is over, currently trading around the previous Support zone. i'm expecting this support to hold and bounce back from the support zone.
Once the price breaks from the falling wedge pattern we can expect the bullish momentum to start and hit new all time high.
Entry: after wedge breakout
Target 1: 2.8
Target 2: 3.49
Target 3: 4.5
Target 4: 5.3
Target 5: 6.3
Target 6: 9.2
SL below 1.68
Cheers
GreenCrypto
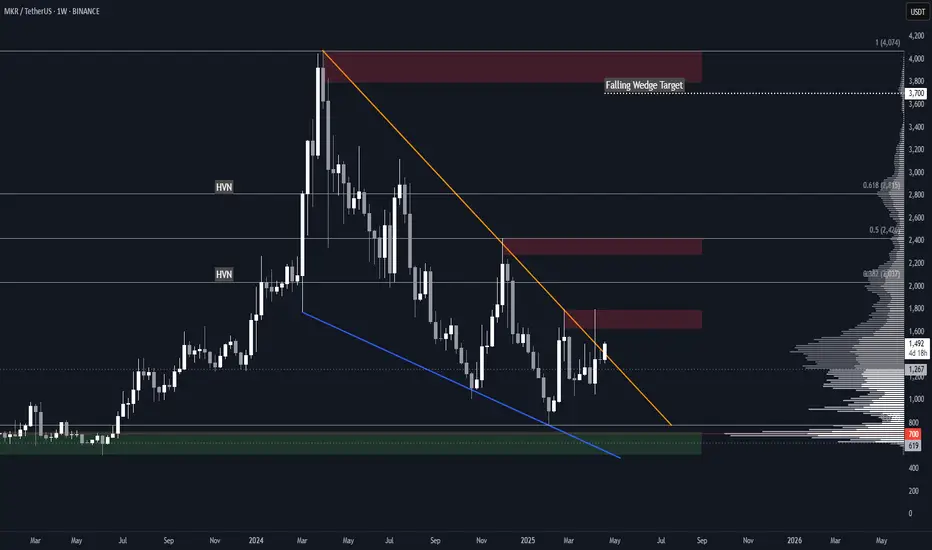
MKR Falling Wedge Breakout + Target & Key LevelsBINANCE:MKRUSDT just broke out of a 1-year long falling wedge, see 1D zoom below.
Further confirmation would be either:
• Daily retest of the resistance as support
• Weekly close above the resistance
Key Levels to Watch
Aside from the demand zone, these are all potential resistances and good candidates for partial TPs.
• $520-$720: Key demand zone. A break below it would invalidate any bullish setup.
• $1600-$1800: Daily sell order block, and the first resistance to overcome.
• ~$2000: 0.382 fib of the move down, and HVN*.
• $2300-$2400: 0.5 fib of the move down, daily sell order block and previous support
• ~$2800: 0.618 fib of the move down, and HVN*.
• $3800-$4000: Daily sell order block, and 2024 high.
The falling wedge measured target is $3700 .
* HVN = High Volume Node
Oil Short: Ending Diagonal and Rising WedgeI propose that Oil is a good short candidate because of what I am seeing:
1. Rising Wedge
2. Ending Diagonal within the Rising Wedge
I propose 3 entry points for shorting but mention that if you are shorting at the top of the trendline, to cater for false breakout, meaning more allowance in your stop.
Good luck!

AUDNZD looks to reverse higher nowAsian Session Update: The AUDNZD has found support at the multi year channel as noted yesterday near the 1.0650 level. Now the pair is in a descending wedge, which is typically a reversal pattern (bullish) so a breakout of the 1.0710 level would suggest a move back towards the 1.0800 level.
