GOLD → Retest of trend support. Consolidation...GOLD is consolidating below the previously broken trend support. On Sunday, Trump announced a trade deal with the EU, which is putting pressure on the market along with the rising dollar...
Gold rebounded from support at $3310 after a week-long low, interrupting a three-day decline amid profit-taking. However, the overall downtrend remains intact as markets brace for a busy week with the release of US GDP data and the Fed's decision. Optimism surrounding US-China trade talks and the US-EU framework agreement is reducing demand for safe-haven assets. Additional pressure on gold is coming from easing geopolitical tensions: Thailand and Cambodia have agreed to ceasefire talks. The metal's recovery may be short-lived.
Technically, we have global and local bullish trends, against which gold is testing support, but as we can see, buyers are trying to hold back the decline due to uncertainty over interest rates. There is a chance that we will see active action by the Fed, behind which lies a rate cut, this week...
Resistance levels: 3345, 3375
Support levels: 3320, 3287
At the moment, I do not see a proper reaction to the support breakout. The price is consolidating after confirming the key trigger at 3345. Thus, if the price starts to return to 3345, test and consolidate above the level, we will have a chance for growth. I do not rule out a liquidity grab from 3325 (false breakout) before the rise.
BUT! The structure will be broken if the price breaks 3325 - 3320 and begins to consolidate below this zone. In this case, gold may fall to 3287
Best regards, R. Linda!
Wedge

GBPCAD - Long-Term Long!Hello TradingView Family / Fellow Traders. This is Richard, also known as theSignalyst.
📈GBPCAD has been overall bullish trading within the rising wedge pattern marked in blue.
This week, GBPCAD has been retesting the lower bound of the wedge.
Moreover, the red zone is a strong weekly structure.
🏹 Thus, the highlighted blue circle is a strong area to look for buy setups as it is the intersection of the lower blue trendline and red structure.
📚 As per my trading style:
As #GBPCAD approaches the blue circle zone, I will be looking for trend-following bullish reversal setups (like a double bottom pattern, trendline break , and so on...)
📚 Always follow your trading plan regarding entry, risk management, and trade management.
Good luck!
All Strategies Are Good; If Managed Properly!
~Rich
Disclosure: I am part of Trade Nation's Influencer program and receive a monthly fee for using their TradingView charts in my analysis.

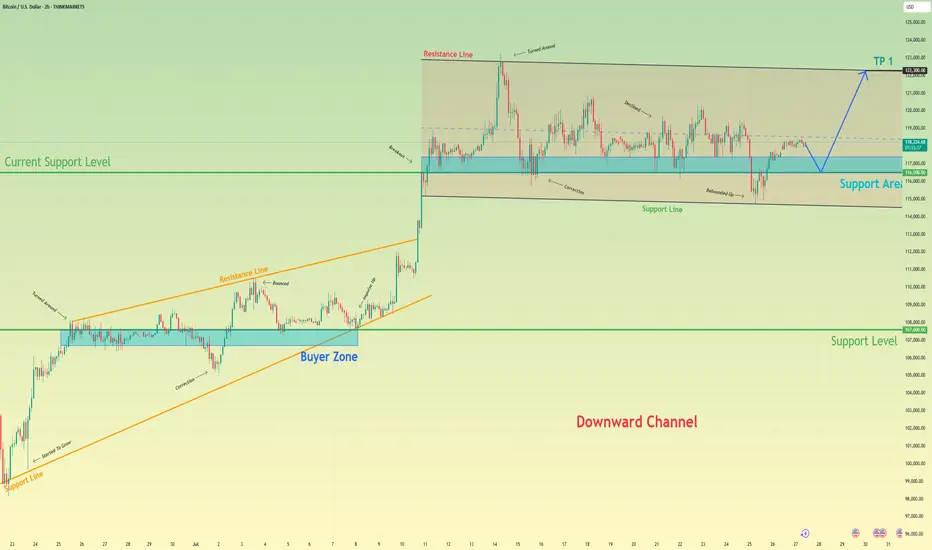
Bitcoin will rebound up from support area to resistance lineHello traders, I want share with you my opinion about Bitcoin. After a strong upward trend that originated from the buyer zone and evolved through an upward wedge, bitcoin executed a decisive breakout, shifting the market into a new, higher-value market phase. This powerful move has since led to an extended period of wide consolidation within a well-defined horizontal channel, a classic sign of the market pausing to absorb the prior impulse and build cause for its next major leg. Currently, the asset's price action is rotating within this structure, defined by a key support area around 116500 and an upper resistance line. Having been rejected from the top, the price is now completing another downward correction and is approaching the channel's foundational support for a crucial test. The primary working hypothesis is a long scenario, predicated on the proven resilience of this support level. A confirmed upward rebound from this 116500 zone would signal that the accumulation within the channel is continuing and likely to resolve upwards. Therefore, the tp is logically and strategically placed at 122300, as this level not only coincides perfectly with the channel's upper resistance line but also represents the completion of the internal rotation, setting the stage for a potential continuation of the larger uptrend. Please share this idea with your friends and click Boost 🚀
Disclaimer: As part of ThinkMarkets’ Influencer Program, I am sponsored to share and publish their charts in my analysis.
Euro will rebound from support line of wedge to resistance levelHello traders, I want share with you my opinion about Euro. After breaking out decisively from a prior downward channel, the euro initiated a significant structural shift, moving from a clear downward trend into a new and more volatile market condition. This transition has led to the development of a large broadening wedge pattern, which is characterised by higher highs and lower lows, indicating an expansion in volatility as both buyers and sellers fight for control. The boundaries of this struggle are well-defined by a major buyer zone around 1.1650 and a formidable seller zone near 1.1750. Currently, the pair is in a corrective phase, moving downwards within the wedge after a recent upward rebound was rejected from the upper resistance line. The primary working hypothesis is a long scenario, which anticipates that this downward correction will find strong support at the confluence of the wedge's ascending support line and the horizontal buyer zone around 1.1650. A confirmed bounce from this critical area of support would validate the integrity of the broadening wedge pattern and likely trigger another powerful upward rotation. Therefore, the TP is strategically placed at the 1.1750 resistance level. Please share this idea with your friends and click Boost 🚀
Disclaimer: As part of ThinkMarkets’ Influencer Program, I am sponsored to share and publish their charts in my analysis.

GBPAUD - Bullish Price Action GBPAUD broke out of a reversal structure with a double bottom confluence. Expecting further growth for a long opportunity.
Good Luck

Understanding Wedge Patterns - A Real Bitcoin Case Study🎓📊 Understanding Wedge Patterns - A Real Bitcoin Case Study 🧠📈
Hi everyone, FXPROFESSOR here 👨🏫
From this moment forward, I will no longer be posting targets or trade setups here on TradingView. Instead, I’ll be focusing 100% on education only for here in Tradinfview.
Why? Because over time I’ve learned that even when traders receive the right charts, most still struggle to trade them effectively. So, from now on, FX Professor Crypto content here will be strictly educational — designed to teach you how to read and react to the markets like a professional. Unfortunately I cannot be posting on Tradingview frequent updates like I do all day. Education is always better for you guys. And i am very happy to share here with you what matters the most.
🧩 In today’s post, we dive into one of the most misunderstood formations: the wedge pattern.
Most resources show wedges breaking cleanly up or down — but real price action is messier.
🎥 I recorded a video a few days ago showing exactly how BTC respected a wedge formation.
⚠️ Note: Unfortunately, TradingView doesn’t play the audio of that clip — apologies that you can’t hear the live commentary — but the visuals are clear enough to follow the logic. (there is no advertising of any kind on the video so i hope i don't get banned again - i did make a mistake the last time and will avoid it-the community here is awesome and needs to stay clean and within the rules of TV).
Here’s what happened:
🔸 A clean wedge formed over several days
🔸 We anticipated a fake move to the downside, grabbing liquidity
🔸 BTC rebounded off support around a level marked in advance
🔸 Then price re-entered the wedge, flipping support into resistance
The lesson?
📉 Often price will exit the wedge in the wrong direction first — trapping retail traders — before making the real move. This is a classic liquidity trap strategy, exercised by the 'market'.
💡 Remember:
Wedges often compress price until it "runs out of space"
The initial breakout is often a trap
The true move tends to come after liquidity is taken
The timing of the 'exit' has a lot to do with the direction. In the future we will cover more examples so pay attention.
I stayed long throughout this move because the overall market context remained bullish — and patience paid off.
Let this be a reminder: it’s not about guessing the direction — it’s about understanding the mechanics.
More educational breakdowns to come — keep learning, keep growing.
One Love,
The FX PROFESSOR 💙
Disclosure: I am happy to be part of the Trade Nation's Influencer program and receive a monthly fee for using their TradingView charts in my analysis. Awesome broker, where the trader really comes first! 🌟🤝📈

Not looking good for the dollarRising wedge broken on the long term chart, EUR will probably keep strengthening

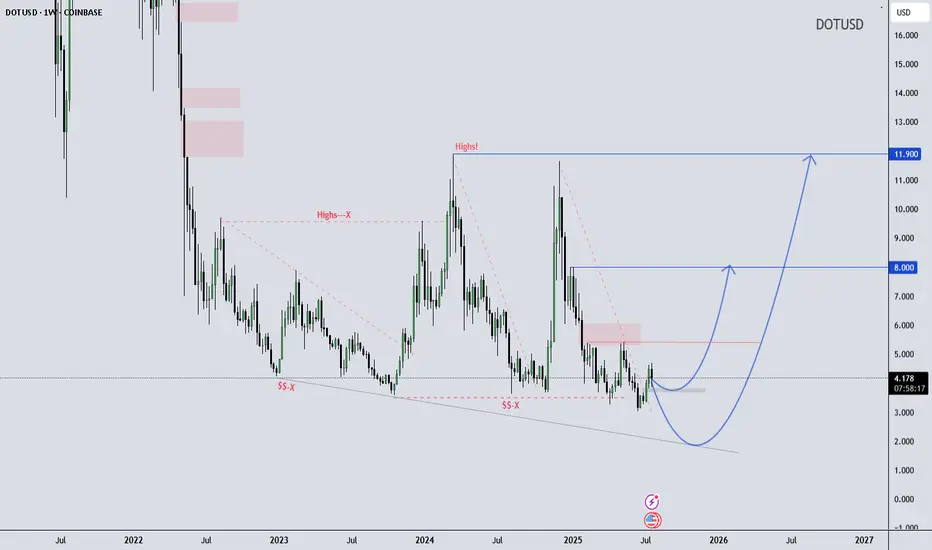
DOT/USD Weekly Structure - - Reversal Possibility Developing DOT/USD Weekly Outlook – Educational Perspective
Polkadot (DOT) is trading near the lower boundary of a long-term falling wedge structure, showing early signs of stabilization around the $4.20 support zone. Price has respected this level multiple times, potentially forming a rounded bottom, which often suggests shifting momentum.
If the structure holds, it may continue developing a macro reversal pattern. This kind of formation is typically monitored by swing traders looking for high risk-reward setups in longer timeframes.
Key Technical Levels to Watch:
$8.00 – Mid-range structural resistance
$11.90 – Historical supply / macro pivot zone
This chart is shared for educational purposes only to support market structure learning. Always follow your own analysis and risk management plan.
Wave Trader Pro
Learn & Earn
BITCOIN & 150kBitcoin in this RISING WEDGE, inside this huge RISING CHANNEL, gives us the resistance of the rising wedge & the middle line of the rising channel at $150,000.
This might be the TOP.

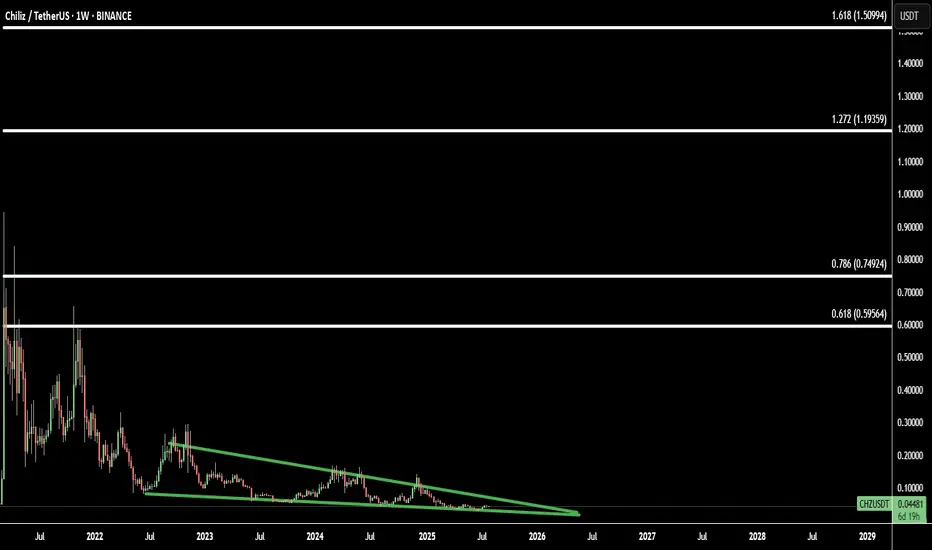
Missed the Altseason Start? CHZ/USDT Is the Opportunity You NeedMany traders feel they’ve missed the start of the altseason, but CHZ/USDT is offering a second chance.
On the weekly timeframe, CHZ is breaking out of a long-term falling wedge pattern — a classic bullish reversal structure that often precedes explosive moves.
Combining this with Fibonacci extensions, we identify 4 major upside targets:
Target 1: 0.618 Fib - 0.59 – initial breakout confirmation
Target 2: 0.786 Fib - 0.74 – mid-term resistance level
Target 3: 1.272 Fib – 1.19 - extended bullish leg
Target 4: 1.618 Fib – 1.50 - full potential of the wedge breakout
CHZ is currently undervalued and positioned near its bottom, making it one of the best risk/reward plays in the current market for those who still want exposure to the altseason wave.
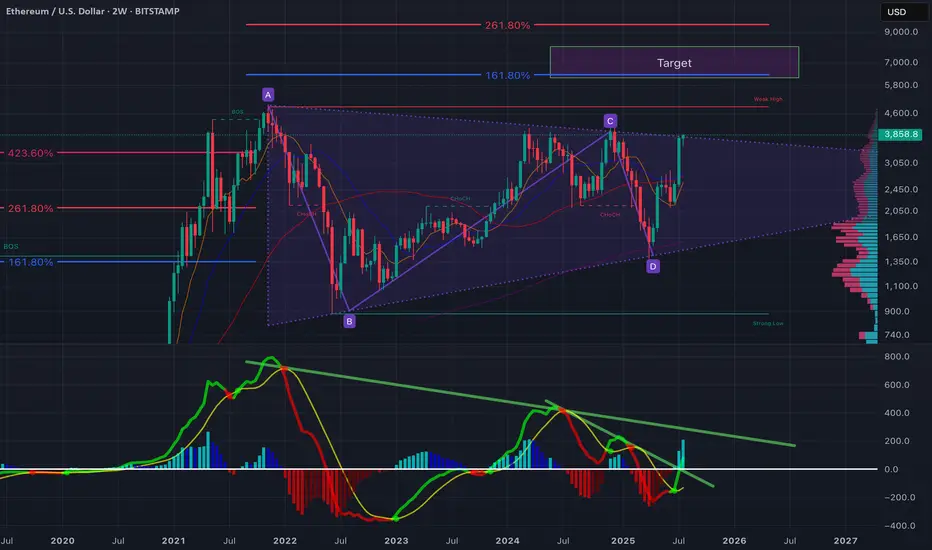
$ETH - Nothing has changedEthereum is showing a significant breakout setup after years of consolidation within a large symmetrical wedge structure (A–B–C–D pattern). The price has just tested the upper boundary of the wedge, and momentum indicators suggest a potential mid-term bullish continuation.
Key Observations:
ABCD Harmonic Structure: Price has respected the harmonic range with D forming a strong higher low near $1,500–$1,600, showing buyer absorption at key demand levels.
Fibonacci Confluence:
The 161.8% extension aligns with ~$5,800, forming the first major target.
A 261.8% extension pushes towards ~$7,000, aligning with the marked "Target" zone.
Volume Profile: Heavy accumulation between $1,500–$2,500 with low resistance above $4,000 suggests a breakout could accelerate quickly.
MACD/RSI Divergence: The momentum oscillator shows a triple bullish divergence (higher lows on momentum vs. lower lows on price), and the downtrend line on the MACD histogram has been broken—often a precursor to sustained upside.
Moving Averages: The 50/100 EMA crossover on the 2-week chart is imminent, historically a strong macro signal.
Bullish Scenario:
A clear close above $4,000 confirms wedge breakout.
Short-term targets: $4,600 (weak high) and $5,800 (Fib 161.8%).
Macro target: $7,000+ if bullish momentum holds through Q4.
Bearish Risk:
Failure to hold $3,500 could lead to retests of $2,500 or even $2,000 (mid-wedge support).
Watch for macroeconomic shocks (rate cuts, liquidity shifts) which have previously caused retracements in crypto markets.
What’s next?
ETH is approaching a make-or-break moment. If the breakout holds, this could be the start of the next major leg up. A strong weekly close above $4,000–$4,200 is critical for validation.
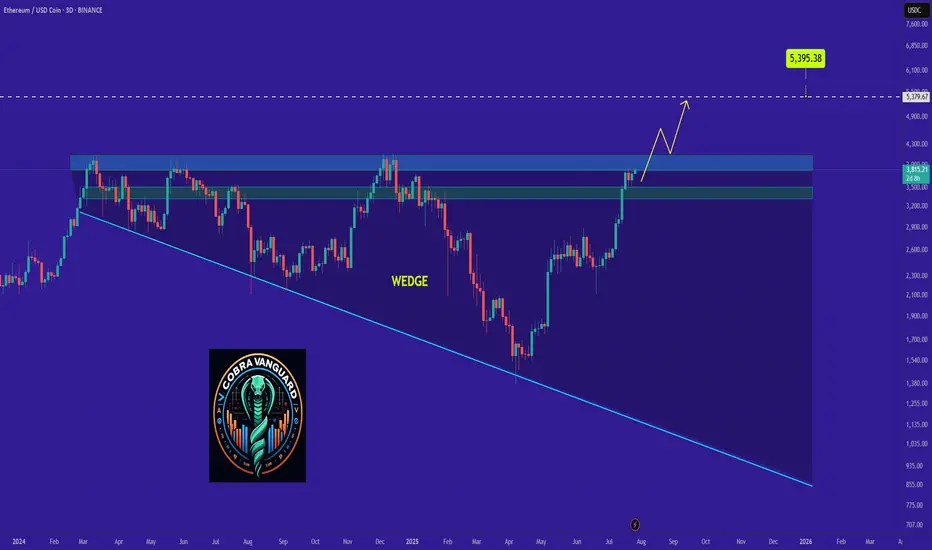
Why ETH Remains Bullish and Its Next Potential Move !The ETH will increase $200 and reach to the top of the wedge in the coming days .
We can be hopeful that after breaking out of the wedge, we will see significant price growth.
Best regards CobraVanguard.💚
Give me some energy !!
✨We spend hours finding potential opportunities and writing useful ideas, we would be happy if you support us.
Best regards CobraVanguard.💚
_ _ _ _ __ _ _ _ _ _ _ _ _ _ _ _ _ _ _ _ _ _ _ _ _ _ _ _ _ _ _ _
✅Thank you, and for more ideas, hit ❤️Like❤️ and 🌟Follow🌟!
⚠️Things can change...
The markets are always changing and even with all these signals, the market changes tend to be strong and fast!!
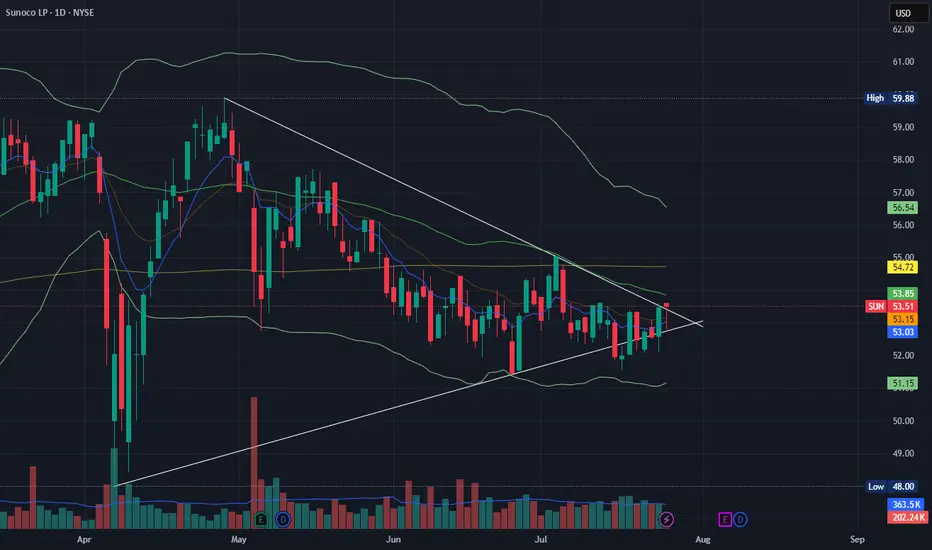
Could this break!?It seems the stock is now found on a range within the EMA9 and EMA21.It now draw a hammer pushing up and heading to test the SMA50.
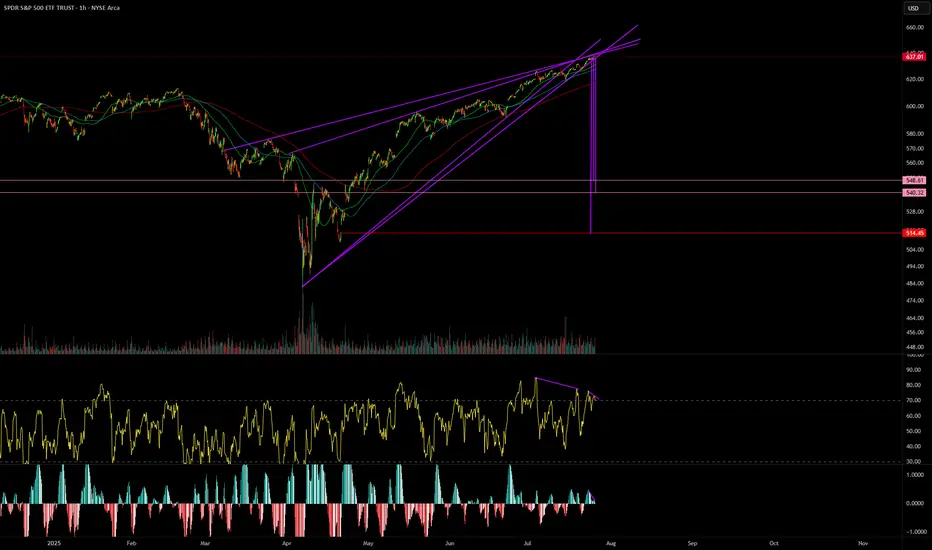
SPY Imagine the SmellImagine the smell from the Bulls if the $514 gap is filled.
Bearish divergence galore.
Not a matter of if this wedge breaks.
Its when.
BITCOIN's Situation (12h) !!!So if you pay attention to the TON chart you can see that the price has formed a Ascending wedge which means it is expected to price move as equal as the measured price movement.( AB=CD )
NOTE: wait for break of the WEDGE .
Best regards CobraVanguard.💚

Market Dip or Bullish Pause Why These 4 Crypto Still Have StrongAs the crypto market retraced modestly in late July, shedding roughly 5% in total market cap, investors were left wondering: is this a signal of deeper correction—or merely a bullish pause before the next leg up?
According to analysts across leading funds and research firms, the recent dip may be healthy consolidation—and several assets continue to show strong structural momentum, even as prices pull back.
Here are four cryptocurrencies still demonstrating resilience and upside potential:
1. Bitcoin (BTC): Strong Hands, Strong Signals
Despite falling from $131,000 to $115,000, Bitcoin’s long-term holder supply reached an all-time high, with over 70% of BTC unmoved in over 12 months. Derivatives data shows rising open interest and neutral funding rates—suggesting professional positioning, not panic.
“If this is a pullback, it’s one with strong underpinnings,” said Felix Grayson, portfolio manager at Helix Funds.
2. Ethereum (ETH): ETF Flows and Ecosystem Growth
Ethereum continues to benefit from spot ETF inflows and Layer 2 expansion. Gas fees remain low, and total value locked (TVL) on Ethereum-based chains has grown by 9% in July alone.
“ETH’s on-chain activity is diverging from price,” said Melinda Zhou, research lead at TitanAlpha. “That’s usually a leading indicator.”
3. Chainlink (LINK): Real-World Integration Boom
LINK is quietly gaining institutional traction. The token surged 14% month-to-date on the back of Oracle partnerships with global banks exploring tokenized bonds and CBDCs.
Chainlink’s Cross-Chain Interoperability Protocol (CCIP) is also seeing adoption by multiple Layer 1s, strengthening its role as the data layer of Web3.
4. StarkNet (STRK): Layer 2 With Institutional Backing
A newer entrant, StarkNet, is positioning itself as the “ZK-powered” Ethereum scalability solution of choice. With backers like Sequoia and Paradigm, and growing traction among DeFi protocols, STRK has outperformed peers in July with a 27% gain.
“The zero-knowledge narrative is just beginning,” noted Zhou. “StarkNet could lead the next phase of Layer 2 expansion.”
Conclusion
Not all dips are created equal. While short-term price action may test investor nerves, fundamentals across major Layer 1 and Layer 2 networks remain robust and improving. For seasoned investors, these moments offer not panic—but perspective.
As capital returns and development accelerates, expect these four projects to remain at the forefront of the next bullish wave.

Spot Ether ETFs Log $453M in Inflows, Extend Streak to 16 DaysThe momentum behind Ethereum continues to build as spot Ether exchange-traded funds (ETFs) in the United States and abroad recorded another impressive influx of capital, attracting $453 million in net inflows over the past week. This marks the 16th consecutive day of inflows, underscoring a growing institutional appetite for the second-largest cryptocurrency by market capitalization.
While Bitcoin has long dominated the digital asset ETF landscape, Ether is increasingly capturing the attention of sophisticated investors. Analysts attribute the sustained interest to a combination of macroeconomic factors, evolving regulatory clarity, and Ethereum’s unique position within the decentralized finance (DeFi) ecosystem.
Institutional Endorsement Grows
Several major asset managers, including BlackRock and Fidelity, have reported increased client demand for Ether exposure in recent months. According to data compiled by Bloomberg, the $453 million inflow in Ether ETFs this week is the largest since the products launched, bringing total assets under management (AUM) across major Ether funds to $3.2 billion.
“These consistent inflows are a clear sign that Ether is becoming institutional-grade,” said Mira Taylor, head of digital asset research at Keystone Capital. “It reflects a shift in how the market perceives Ethereum—not just as a tech platform, but as a core financial infrastructure.”
This shift comes amid Ethereum’s continued progress toward scalability, including its transition to proof-of-stake (PoS) and the implementation of Layer-2 scaling solutions such as Optimism and Arbitrum. These upgrades improve network efficiency and reduce gas fees, making Ethereum more attractive for enterprise-level use cases.
Regulatory Developments Provide Tailwind
The surge in investor confidence is also linked to increasing regulatory clarity. The SEC’s tacit approval of spot Ether ETFs in key jurisdictions, including the United States and Europe, has provided the legitimacy many institutions required before allocating capital.
Moreover, Ethereum’s perceived decentralization and utility have helped it avoid the same level of scrutiny that other altcoins have faced. While Ripple’s XRP and Solana remain entangled in legal ambiguities, Ethereum benefits from its early position as a non-security in the eyes of regulators.
Market Outlook
Despite recent volatility in the broader crypto markets, Ethereum has shown resilience. ETH is currently trading around $3,550, up nearly 12% month-over-month. Analysts suggest the inflows into spot Ether ETFs could act as a support mechanism for price, dampening downside volatility.
“ETF inflows often act as a price stabilizer, particularly in a risk-on environment,” said Noah Wexler, macro strategist at Apollo Digital. “If inflows persist, Ethereum could revisit the $4,000 level by Q4.”
Investors and analysts alike will be watching closely to see whether the inflow streak continues into a 17th day. Regardless of short-term price action, the structural trend appears clear: Ethereum is solidifying its role as an investable, institutional-grade asset.
USDJPY: Bullish Move From Support Ahead! 🇺🇸🇯🇵
I think that there is a high chance that USDJPY will continue growing
next week.
A bullish breakout of a resistance line of a flag pattern that occurred
after a test of a key support provides a strong bullish signal.
Goal - 148.7
❤️Please, support my work with like, thank you!❤️
I am part of Trade Nation's Influencer program and receive a monthly fee for using their TradingView charts in my analysis.

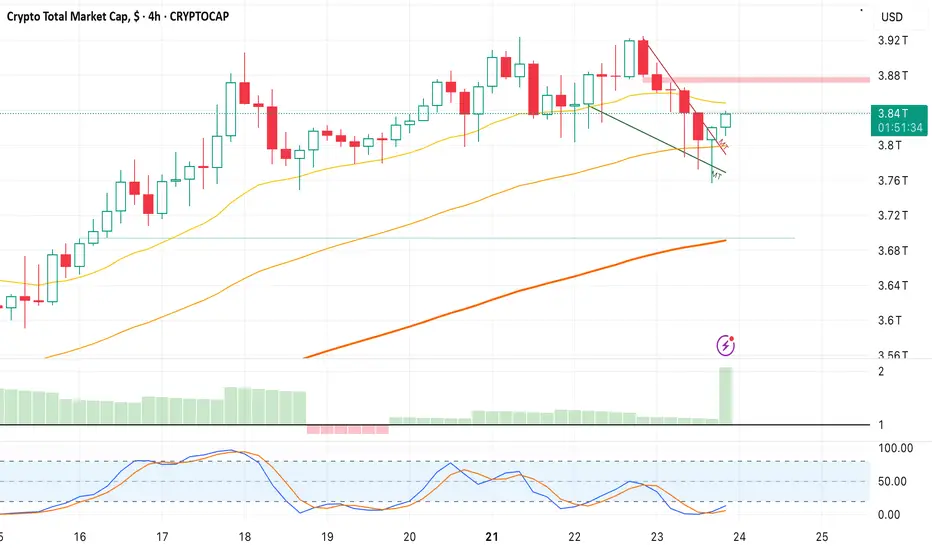
Bounce on Crypto Cap-Falling Wedge breakout at 3.836T, Target- 3.88 and 3.9.
-Looking for Bullish Crypto trading opportunities that align with this bias.
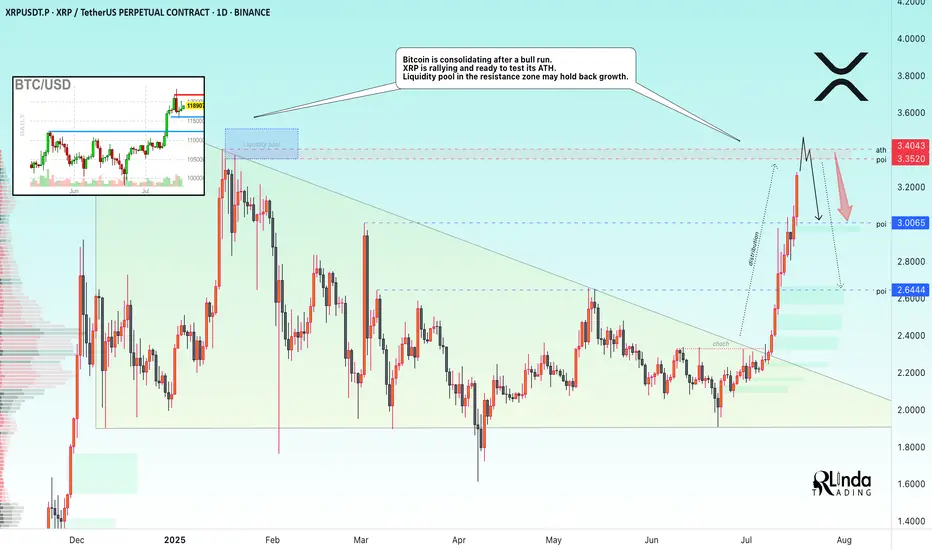
XRP → ATH retest. Reversal or continued growth?BINANCE:XRPUSDT.P is rallying and ready to test the resistance zone - ATH. Against this backdrop, Bitcoin is consolidating after a bull run. The liquidity pool may hold back growth.
Fundamentally, there is excitement across the entire cryptocurrency market. Altcoins are rallying after Bitcoin hit a new high and entered consolidation. The BTC.D index is declining, which generally provides a good opportunity for altcoins to grow. However, the index is approaching technical support, which may affect market sentiment overall...
As for XRP, there is a fairly strong liquidity pool ahead — the ATH resistance zone. The price is in a distribution phase after a change in character and a breakout of the downtrend resistance in the 2.33 zone. The momentum may exhaust its potential to break through the 3.35-3.34 zone, and growth may be halted for correction or reversal (in correlation with Bitcoin's dominance in the market).
Resistance levels: 3.35-3.40
Support levels: 3.0, 2.64
A breakout of resistance without the possibility of further growth, a return of the price below the level (i.e., inside the global flat) will confirm the fact of a false breakout of resistance, which may trigger a correction or even a reversal.
Best regards, R. Linda!
EUR/USD – The Cleanest Buy Setup EUR/USD – The Cleanest Buy Setup This Quarter (Wave E Targeting New Highs)
---
📄 TradingView explanation
📊 EUR/USD 4H Chart Analysis
The pair has beautifully respected the corrective channel from Wave C to D and is now preparing for the final leg — Wave E.
🟦 Key Highlights:
🔹 Price bouncing off demand zone
🔹 Tight consolidation near mid-channel = accumulation
🔹 Next targets: 1.1900 / 1.2050
🔹 Bullish continuation expected after liquidity sweep
🎯 The cleanest and most technically sound buy opportunity this quarter — align your longs with the trend before the breakout happens.
💬 Let them call it a bubble — we call it precision and patience. 🧠💸
#ElliottWave #EURUSD #ForexSetups #SmartMoneyMoves
?


A tale of two wedgesIn early 2025 we’ve seen two classic wedge patterns on two of the market’s most watched charts: a falling wedge on the U.S. Dollar Index ( TVC:DXY ) and a rising wedge on the S&P 500 ETF ( AMEX:SPY ). Alone each tells its own tale—but together they sketch a tug‑of‑war between a fading dollar and resilient equities.
The Falling Wedge on DXY
A falling wedge in a downtrend signals waning bearish momentum and often precedes a bullish reversal once price breaks the upper trendline.
The Rising Wedge on SPY
A rising wedge in an uptrend is classically a bearish reversal pattern —a breakdown below the lower trendline confirms sellers are gaining control.
A Converging Reversal
Given the well‑known inverse correlation between the dollar and most assets, it’s noteworthy that both asset classes are flashing signs of a reversal. Taken together that makes a compelling argument.
