ADA/BTC Looking .. ummmThe signs are showing a potential short term reversal but it could keep dumping from here. This is some potential long territory but don't hold it long IMO #NFA #GodSpeed
Wedge

Bitcoin Rising Wedge IMO if fed don't cut rates this month we gonna break the wedge and enter a long time bear market

GOLD → Long-sqeeze (double bottom) before breakout 2926FX:XAUUSD is forming the maneuver we need regarding the previously mentioned consolidation. False break of support on the background of the rising market, we discussed it with you yesterday. The reaction is the formation of a reversal set-up and bullish momentum
This week the markets are awaiting the JOLTS jobs report (today) and CPI data (Wednesday), which could provide fresh impetus to prices.
Additional pressure comes from expectations of US-Ukraine peace talks, a possible mineral agreement and ongoing trade tensions related to Trump's protectionism. However, a weaker dollar and lower bond yields are supporting gold, limiting its losses
Gold may test yesterday's high and after a slight pullback continue to rise with a target of retesting the 2926 consolidation resistance. The market structure is bullish at the moment and it plays to our advantage....
Resistance levels: 2918, 2926, 2942
Support levels: 2905, 2893.5, 2880
At the moment the price is still in consolidation, but the price is forming a bullish rally due to the collected liquidity in the Asian session. The local pattern “double bottom” is formed (false breakdown of support) and the next target is the resistance of consolidation 2926. Also focus on 2918 - possible retest and pullback to 0.5 fibo before the price will storm 2926.
Regards R. Linda!

BTC Upward WedgeWedge patterna usually require 5 touch points to confirm the pattern. Which, officially, Bitcoin has done.
This upward wedge means revearsal for a bear market, while a downward wedge means reversal for a bull market.
We are still inside this wedge which means even though this pattern is hypothetically confirmed on BTC, we could either see a rally up through the wedge until it finally breaks, or we may even break now into the end of March if BTC continues sideways.
This pattern overall suggests that we are likely to see an early top for BTC if the pattern confirms in the next few weeks, otherwise there's still room for a late 2025 top for BTC even with the upward bearish wedge in play.

USDCAD, Short, 15m✅ USDCAD formed a clear rising wedge pattern, signaling a potential bearish move. The price is expected to decline slightly from this level.
Canadian economic data showed stronger-than-expected results, including a better unemployment rate, higher Ivey PMI, and a strong trade balance, boosting the CAD. In contrast, U.S. data revealed a higher unemployment rate and weaker Non-Farm Payrolls, putting pressure on the USD.
SHORT 📉
✅ Like and subscribe to never miss a new analysis! ✅

GBPAUD → Correction to strong support before continuing growthFX:GBPAUD is forming a range with a consolidation target after breaking the base of the ascending triangle. The pound is correcting due to the dollar
Technically, on the daily timeframe we have a strong bullish structure, the price is trying to accelerate after breaking the trend resistance, but against the background of the dollar correction the pound sterling is also making a small pullback. There are no strong fundamental changes and the general direction may continue.
At the moment the focus is on ob, located in the zone of 2.0285, as well as the liquidity zone, which is located below 2.0285 + weekly low - 2.015, which also hides a huge pool of liquidity that can be tested.
Resistance levels: 2.05088
Support levels: 2.0285, 2.0151
On the background of the uptrend and the correction to the support after the update of the maximum, we can consider the strategy - false breakdown of the support with the purpose of continuation of the growth. Emphasis on 2.0285 - 2.015
Regards R. Linda!

BITCOIN → The fall continues... 82K → 76K → 73KBINANCE:BTCUSD is in a sell zone. Trump's comments on the federal reserve, crypto summit failed to impact the crypto market other than a global shakeup and liquidation...
The market has failed to see a proper bullish driver, so far. Trump's comments on the Fed ended in a global shakeup (liquidation). Yesterday's summit went so far as to prevent the cryptovalt market from turning green.
Technically. Global growth is temporarily halted, the flagship is moving into a deep correction phase, with 73K still the primary target. The market needs liquidity, as it will not be possible to grow at the expense of buyers and only bullish leverage all the time.
Price is forming a 90K - 82K range in the short zone after exiting the global consolidation. False break of 91K resistance ( global consolidation support ) ended with a fall, which may continue to both 82K and 73.5K.
Resistance levels: 89400, 91K, 93K
Support levels: 82K, 78K, 73K
The key zone of interest and liquidity is 73-66K. The price is working on a false break of resistance, the imbalance of forces in favor of bears, thus the first stop may happen in the zone of 82K ( lower boundary of the range ). Further it is necessary to observe the reaction to the support. Consolidation, breakdown and consolidation below 82K will provoke a fall to lower targets.
Regards R. Linda!

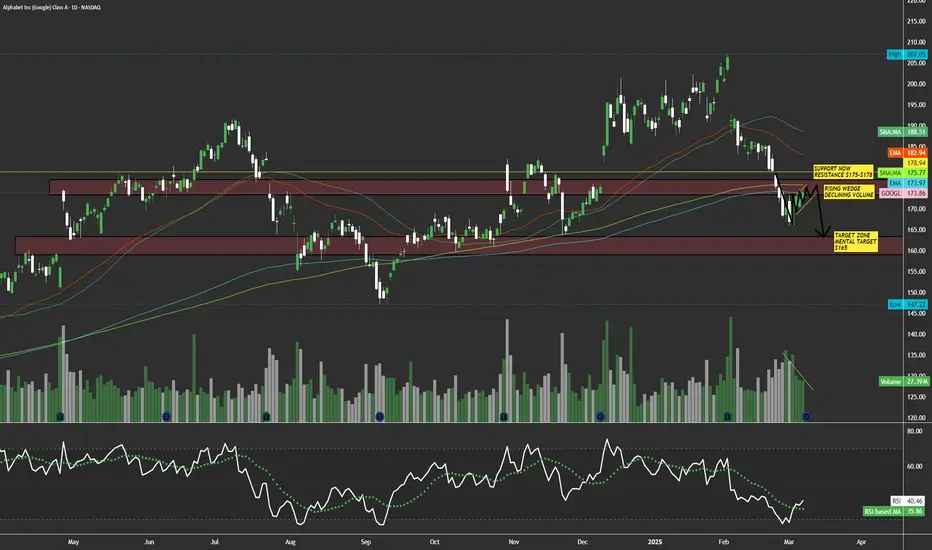
$GOOGL Rising bearish wedge with declining volume; $165 belowNASDAQ:GOOGL here looks weak to me trying to reclaim it's support of $175-$180. This is on my watchlist for a short term short, if this name tanks back into the $150's I will load everything I got for the long side. I see this name in a downside trend currently in a rising wedge with declining volume, buyers can't hold it up much longer. It's retested that support on 3 or more daily candles and hasn't busted through. I expect this name to drop into a support zone of $160-$165. I will look to enter puts off a retest of $176-$178 area keeping the stops tight.
WSL.
60% Upside - H5 Trade of the Week!H5 Trade of the Week!
In this video, we are talking about a phenomenal potential trade that allows us to take action if we get some key items.
Everything is lining up for this one. We just need a few more items, and it will be time to enter!
NYSE:OSCR Breakout = $24/ $28
Not financial advice

BTCUSD – Descending Broadening Wedge With Key Buy ZonesBitcoin is trading within a Descending Broadening Wedge on the 6-hour timeframe, a pattern that typically signals increasing volatility before a potential breakout. The price is fluctuating between two diverging trendlines, with several critical buy levels forming along the structure.
Descending Broadening Wedge Resistance Breakout at 94,543
The upper boundary of the wedge, around 93,000 to 94,500, serves as dynamic resistance. If Bitcoin pushes through this level, it could trigger a breakout toward the first target at 108,000 and possibly extend to 124,407. Volume has been increasing near resistance, indicating strong market participation.
Ascending Trendline Rebound at 84,536
This level aligns with an ascending support trendline inside the wedge. Bitcoin has previously bounced from similar trend structures, making this an important zone to watch for a potential reaction.
Double Bottom Possibility at 79,006
The 79,000 level has acted as support in previous price movements, creating a possible double bottom scenario. If the price stabilizes here, it could be an early sign of trend reversal within the wedge.
Descending Broadening Wedge Support at 75,092
The lower boundary of the pattern, around 75,000, remains a major support level. This is where previous downward movements have found buying interest, making it a crucial point for potential price reversals.
Stop Loss at 69,000 to 68,000
A drop below this range would indicate that the wedge structure has failed, opening the possibility for further downside movement.
Bitcoin remains within a widening consolidation phase, with increasing volume showing heightened market activity. As long as the price respects the wedge boundaries, these key levels present potential opportunities for positioning ahead of a breakout.

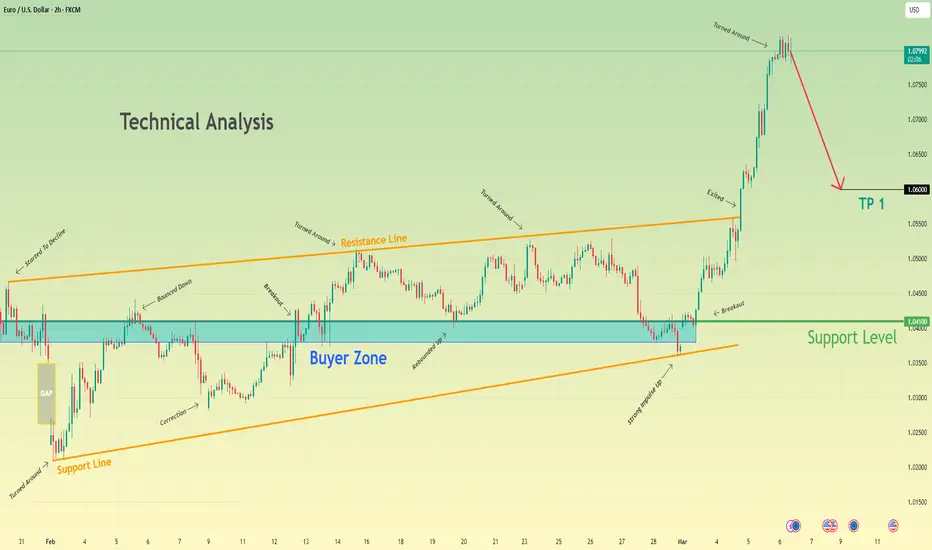
After strong impulse up, Euro makes correction to 1.0600 pointsHello traders, I want share with you my opinion about Euro. Looking at the chart, we can see that the price entered a wedge formation and immediately started to decline. The Euro broke through the 1.0410 level, creating a strong gap before reaching the wedge's support line and beginning to rise. In a short time, it climbed back to the support level and attempted to break it but failed, pulling back slightly. After that, the Euro returned to the 1.0410 support level and finally managed to break through. Following this move, it reached the resistance line of the wedge and made a correction down to the support level. Then, the Euro pushed back up to the resistance line, consolidating near it for a while before dropping to the buyer zone, where it later touched the wedge’s support line again. From there, it made a strong upward impulse, breaking the 1.0410 level once more, exiting the wedge, and surging to 1.0820. However, more recently, the price reversed and started to decline. I believe the Euro may enter a corrective phase after such a strong upward move. Based on this, my TP is set at 1.0600 points. Please share this idea with your friends and click Boost 🚀
Bitcoin may reach resistance line and then drop to 83400 levelHello traders, I want share with you my opinion about Bitcoin. A few days ago, Bitcoin entered a descending wedge and began to decline within it. Soon after, the price dropped to the seller zone, which aligned with a resistance level, and eventually broke through. Following this move, BTC quickly fell to the 83400 support level, which coincided with the buyer zone, and even dipped below, breaking through the level. After reaching the wedge’s support line, Bitcoin immediately reversed and started moving upward. In a short time, the price reclaimed the 83400 level, performed a retest, and continued its upward movement. Later, BTC climbed to the resistance level and briefly entered the seller zone, where it consolidated near the wedge’s resistance line before dropping back to the buyer zone, breaking through 93600. Within the buyer zone, the price touched the wedge’s support line before making a strong impulse upward, breaking back above 83400. Currently, BTC is still moving higher, and I anticipate that the price will reach the wedge’s resistance line before reversing downward. Based on this scenario, my target is set at the 83400 support level. Please share this idea with your friends and click Boost 🚀

GOLD → Consolidation ahead of NFP. What can happen?FX:XAUUSD is heading for resistance after a false breakdown of 2895. The market continues to test 2926 with the aim to break this zone. There is news ahead and the risks of increased volatility are growing.
Markets remain jittery over Trump's tariff plans, which supported gold demand. Trade tensions and mixed U.S. jobs data are adding to inflation risks, which could weaken the dollar. All eyes are on the NFP report.
Based on the analysis of the last few reports, a rough conclusion is that on average in the first 15 minutes, weak data led gold to rise 60 points and strong data led gold to fall 50 points
However, other factors such as inflation and data revisions may dampen the market reaction. The final effect depends on investors' assessment of the Fed's future policy.
Resistance levels: 2926, 2942
Support levels: 2912.5, 2909.5, 2895
Before the news, the price may test 2926 with a false breakout (MM trap for liquidity) and roll back to the nearest support.
But further prospects depend on the news. Gold is in consolidation 2926 - 2895. On the background of possible weak data gold may overcome 2926 and accelerate to ATH. Strong data may provoke profit taking and correction to 2895 - 2875
Regards R. Linda!

When you're Dancing on the ceiling; Short then LongWe recently broke-out of a trading range, to the Upside. Short now for Temporary Profits, or, Wait for the price to follow the grey line I drew in illustrating the likely Anticipated move. Buy long, at-or-near the Pullback (top Dashed line).
Should go (up) Down Upppp!
For your added Confidence, i recommend Waiting for a Bullish Candle After the retest to Pullback Level; you Want to See a Green candle after touching that Dashed line.

USDJPY → Readiness to break the daily support levelFX:USDJPY is testing strong key support at 148.64 for a breakdown. A falling dollar could affect further movement
The falling dollar is supporting the Japanese Yen, thus we may see the currency pair falling.
The price is trying to break the support of the daily level. A pre-breakdown consolidation of 150.3 - 148.64 is formed relative to this support. The last retest of the level ended with a small false breakdown, indicating that there is no one to defend the support anymore, there was no reaction except for another local consolidation, the purpose of which is to accumulate the potential to break the support.
Resistance levels: 150.3, 150.95
Support levels: 148.64, 147.17
The focus is on the level of 148.64 concerning which the market is struggling. The bulls have little chance to hold this level, as the dollar's fall exerts quite a lot of pressure.
The breakdown and fixing of the price below 148.64 may provoke a fall to 147 - 144.
Regards R. Linda!

$HOSKY Poised for a 500% Surge Amidst Falling Wedge BreakoutHOSKY Token ($HOSKY) the first dog-themed token built on the Cardano blockchain is poised for a breakout amidst a prolonged steeped falling wedge pattern that has kept the token in suspends for almost 3 months since consolidating on the first week of December last year.
so many patterns hints at a potential bullish reversal one of which is the growing ecosystem of the cardano blockchain. Data from DefiLlama shows a growing volume in the Total Value Locked (TVL) on the Cardano ecosystem with about $442.41 Million locked so far in TVL.
Further validating the bullish thesis is the RSI which is currently at 52 giving $HOSKY more space to capitalize on the 500%. The daily chart pattern shows $HOSKY is trading below key Moving Averages (MA).
HOSKY Token Price Live Data
The live HOSKY Token price today is $1.06e-7 USD with a 24-hour trading volume of $467,937 USD. We update our HOSKY to USD price in real-time. HOSKY Token is up 5.30% in the last 24 hours, with a live market cap of $24,229,480 USD. It has a circulating supply of 227,999,999,999,931 HOSKY coins and a max. supply of 1,000,000,000,000,001 HOSKY coins.

Alchemy Pay - March 2025A possible descending wedge for the short term. The price is in a good zone.
This chart is not investment advice. Always do your own research!

AAVE/USDT BIG BIG BIG LONGWho knows me know that my favourite figure is a falling wedge, so this is textbook one
Easy 30% gain

Textbook falling wedge on TAOEasy and perfect creation on 4h and daily chart
Falling wedge on TAO if it will completes is an easy 100% in a month, otherwise very very easy 10/20%

SOLUSDT at Critical Resistance – Will Bears Take Over? Yello, Paradisers! Is SOLUSDT setting up for a major drop? The technicals are flashing warning signs, and you need to pay attention.
💎SOLUSDT has broken down rising wedge, showing a loss of bullish momentum. On top of that, a bearish divergence is appearing, and the price is currently testing key resistance at the 200 EMA—a combination that significantly increases the probability of a bearish move.
💎If SOLUSDT retests the resistance zone and the 200 EMA again, a double top formation could play out. But before jumping in, waiting for bearish confirmation is the smart move.
💎If price breaks above and closes a candle above the resistance, it will invalidate the bearish thesis. In that case, patience is key—waiting for clearer price action will be the best approach.
🎖Trading isn’t about guessing—it’s about waiting for high-probability setups and executing with discipline. Stay sharp, Paradisers, and remember: the market rewards patience, not impulsive moves.
MyCryptoParadise
iFeel the success 🌴

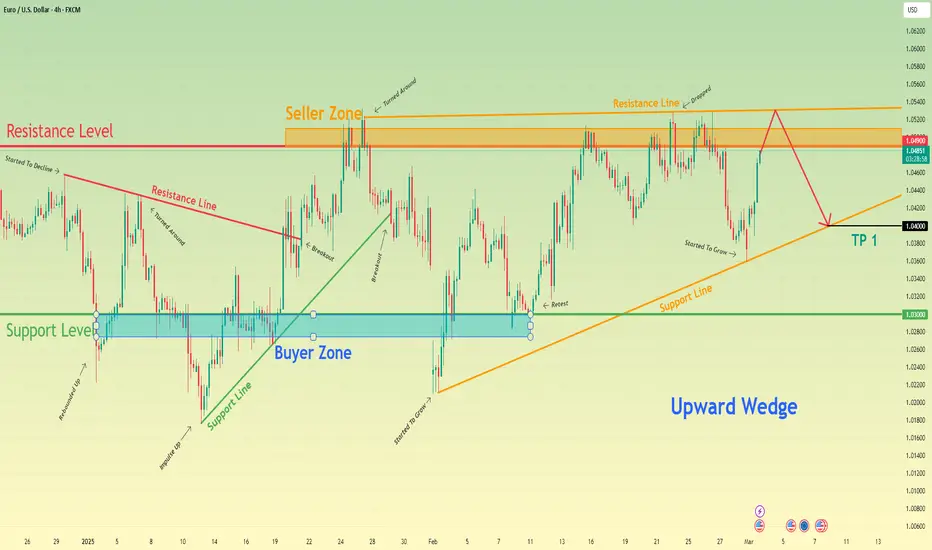
Euro can reach resistance line of wedge and then drop to $1.0400Hello traders, I want share with you my opinion about Euro. Observing the chart, we can see that the price reached the resistance line before beginning to decline. Shortly after, the Euro dropped to the support level, aligning with the buyer zone, then rebounded back to the resistance line before falling again and breaking below the 1.0300 level. Following that, the Euro made a strong upward move, pushing past the resistance level and briefly entering the seller zone. However, the price quickly reversed and started declining within a wedge pattern, eventually breaking through the support line as well. It then fell to the lower boundary of the wedge, forming a gap before beginning to climb again. Not long after, the Euro broke above the 1.0300 level, retested it, and surged toward the resistance level, where it immediately re-entered the seller zone. After some consolidation in this area, the price dropped back to the wedge’s support line, breaking below 1.0490 once again. Recently, however, it rebounded and is now trading near the 1.0490 resistance level. From my perspective, the Euro has the potential to rise toward the wedge’s resistance line, breaking above the resistance level before reversing downward. If that happens, I expect the price to break below 1.0490 again and continue falling toward the wedge’s support line. That’s why I’ve set my TP at 1.0400, as it aligns with this key level. Please share this idea with your friends and click Boost 🚀
Silver Buy Gold Sell I am showing you (Silver-Gold) pair .
MCX:GOLD1! is Showing a bearish pattern while MCX:SILVER1! is showing a bullish pattern.
Also the Silver-Gold Pair is showing a break out after consolidating.
Looking all these is likely we can see the pair moving from 11k to 23K-24K.
This post is just my perception and for study purpose only.
I am not a SEBI registered analyst. As stock market has risk of loosing money.
Please invest your hard earned money carefully.
I cannot be held responsible for any loss in the stock/Commodities market.

Nifty Trend directionNifty 22080 has resistance around 22106=22121. As long as thus resistance not broke down, we shall expect Nifty to test 21850
