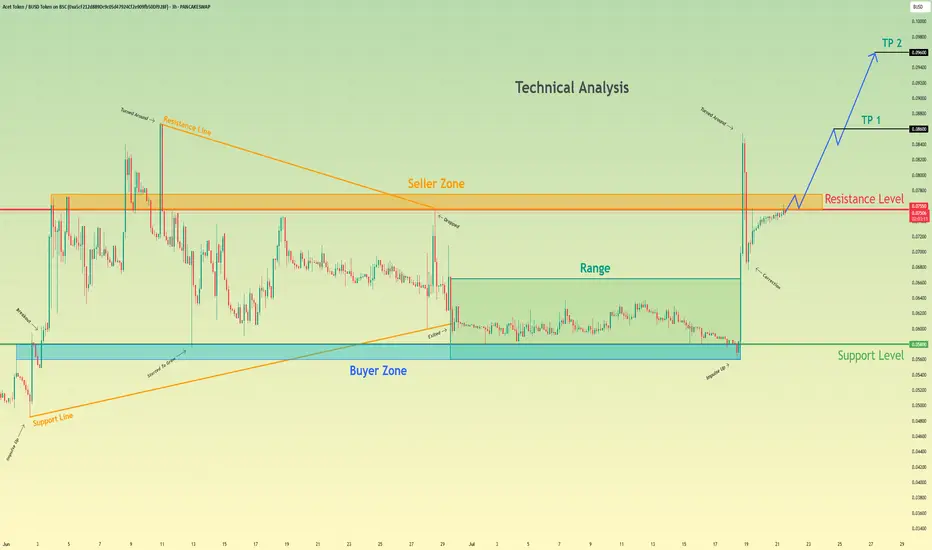
Acet Token will break resistance level and continue to move upHello traders, I want share with you my opinion about Acet Token. Looking at the recent price action, we can see a clear narrative unfolding. The asset initially formed a large wedge pattern, experiencing a trend reversal that led to a breakdown and a period of prolonged consolidation within a defined range between the buyer zone around 0.0580 and the upper boundary. Recently, however, the market showed a strong impulse, breaking out of this range and decisively moving upwards. Currently, the price of act is testing the key resistance level at 0.0755, an area historically defined as a seller zone. The hypothesis is that after this powerful impulse, the asset will manage to break and hold above this resistance. A successful retest of the 0.0755 level would likely signal a continuation of the uptrend, paving the way towards our specified take-profit targets. The first goal is set at TP 1 at 0.0860, with a further extension to TP 2 at 0.0960, capitalizing on the anticipated bullish momentum. Please share this idea with your friends and click Boost 🚀
Wedge
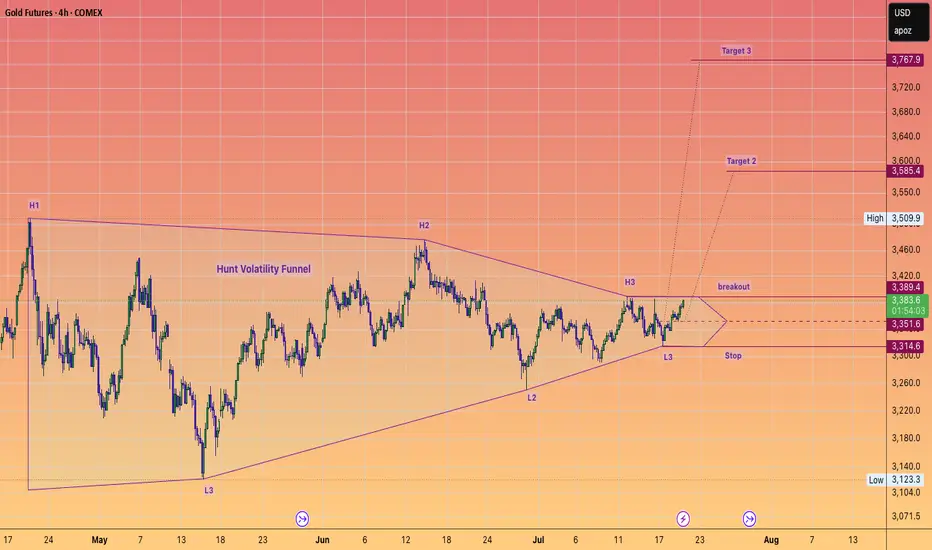
Trade Alert! GOLD to $3800 SOON.#HuntVolatilityFunnel setup which is about to trigger to the upside.
This setup should take gold to or very close to $4K IMHO
#GC
#GOLD
#SILVER
#METALS
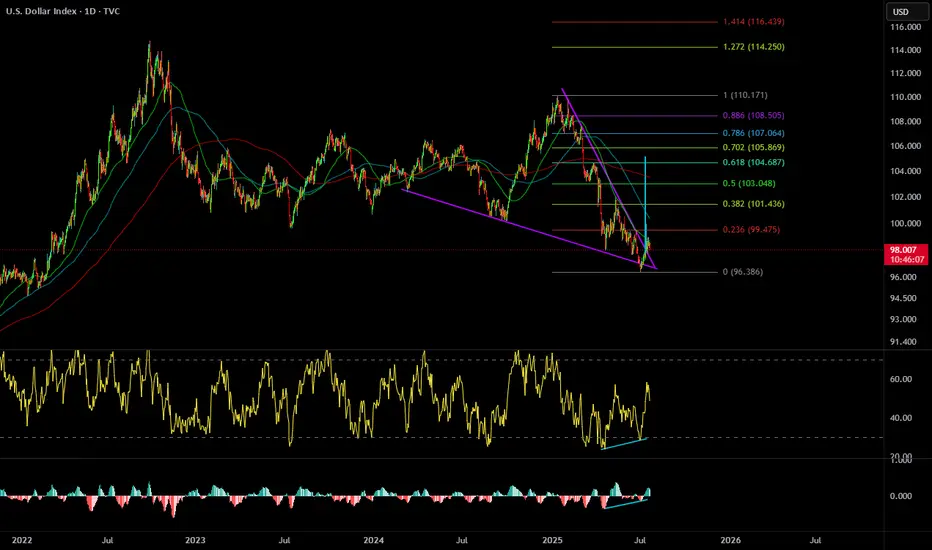
Dollar $DXY Bullish WedgePretty clean falling wedge with divergence. Aligns with a pullback to come on BTC and Stocks.
A move back to 104 area would do some damage to risk on assets.
Follow for updates.
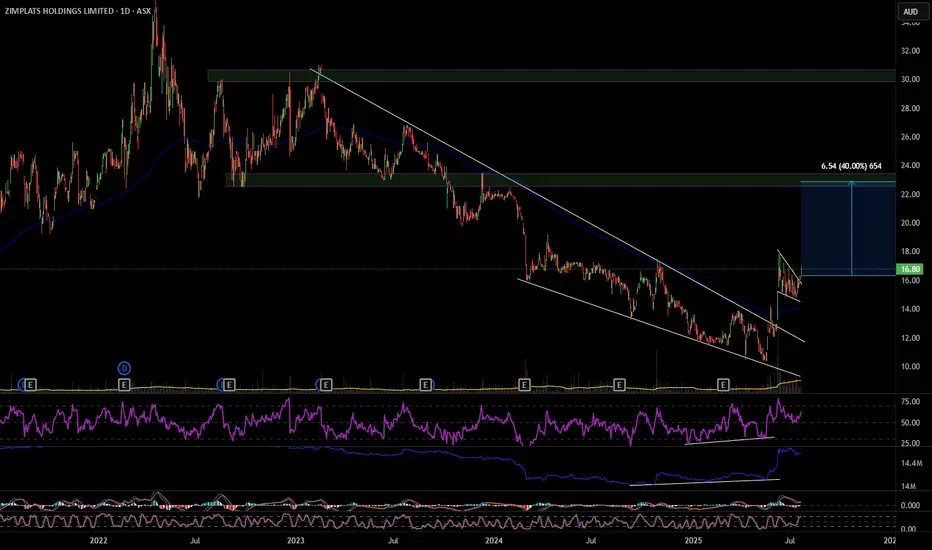
ZIM 40% move up
ZIM has broken out of a descending wedge with bullish RSI and OBV divergence, also multiple divergences on smaller time frames. On the hourly it's had a pull back and formed a bull flag that it has also broken out of. ZIM looks to have formed a change of structure forming higher highs and higher lows, my first target will be $22.90 a move of 40%. Definitely one to consider. Good luck and happy trading 🍀
GOLD-XAUUSD vs. The FED: Technicals or Fundamentals?Good Morning Traders,
Let’s break down what gold is showing us on the 1-day chart:
- **Resistance:** 3,378
- **Support:** 3,282
- There’s a noticeable **head and shoulders pattern** on the chart. Under normal conditions, gold’s target sits at **3,170**.
Gold is highly sensitive to fundamental factors. Sudden war news or events like last week’s rumors about Trump firing the Fed Chair can trigger serious volatility.
That’s why I always combine **technical and fundamental analysis** in my approach.
For gold to reach the 3,170 target, the **3,282 support level must first be broken**. Since that hasn't happened yet, we can't confirm a bearish move—fundamentals play a key role here.
Keep in mind: this is a **swing trade** setup based on a 1-day chart. Reaching the target could take time.
I want to sincerely thank everyone who’s been supporting my analyses with likes—your support is
my biggest source of motivation when it comes to sharing content.
Much love and respect to you all.💛

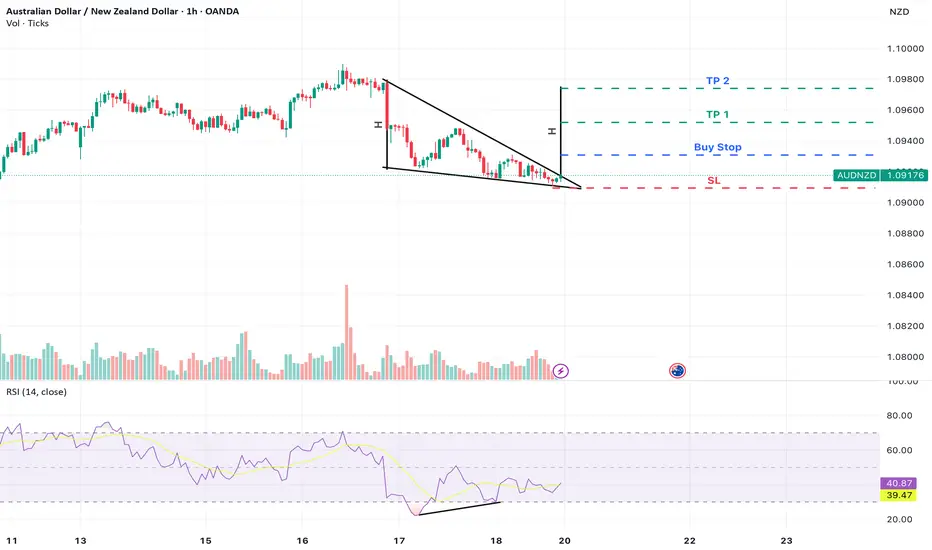
AUD/NZD – Falling Wedge Breakout with Bullish DivergenceAUD/NZD is currently forming a falling wedge pattern on the 1-hour timeframe, a structure typically associated with bullish reversals. Notably, bullish divergence on the RSI is developing while price continues to print lower lows, RSI is making higher lows, indicating weakening selling momentum.
Trade Setup:
Buy Stop Entry: 1.09309 (above recent Lower High — confirmation of breakout)
Stop Loss: 1.09094 (recent Lower Low )
Take Profit 1 : 1.09520
Take Profit 2 : 1.09740 (full pattern projection target)
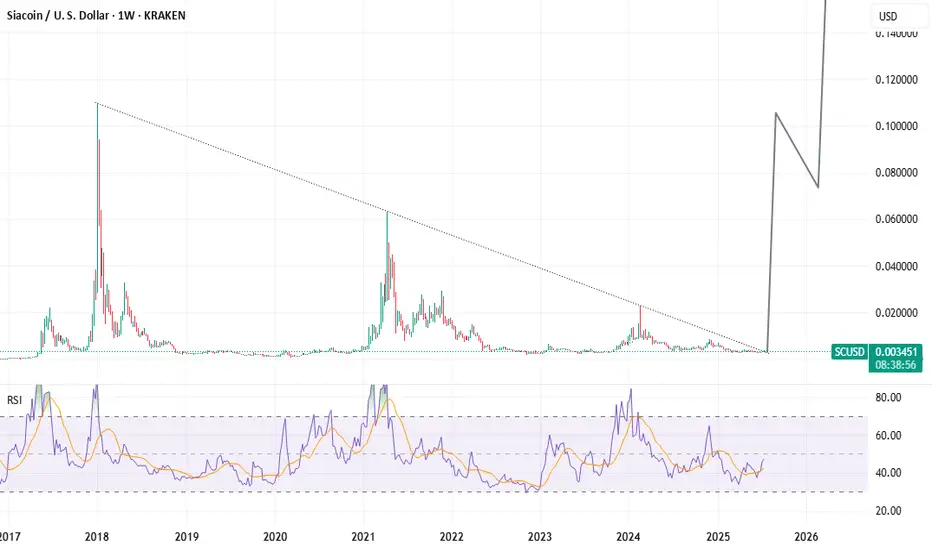
8-Year Breakout Confirmed! SIACOIN Hardfork Activated!Breaking out from a near-identical structure to XRP’s Q3 2024 move, Siacoin (SC) is poised to moon.
Once a top 20 crypto, SC has just closed outside an 8-year falling wedge on the weekly—marking the end of nearly a decade of compression.
But this isn’t just a pattern breakout—it coincides with the biggest technical overhaul in Sia’s history, rolled out on the 10-year anniversary of the token’s launch. Some of the new features:
- Full protocol overhaul — complete rewrite in Go (from siad to hostd/renterd)
- Faster performance — significantly improved upload/download speeds
- Modular architecture — easier dev integration, plug-and-play infrastructure
- Efficient storage contracts — new ephemeral account system for faster payments
- Lower gas costs — more cost-effective microtransactions for storage users
- Better redundancy & reliability — improved renter-host coordination
- Stronger developer tools — RESTful APIs + CLI tools for building on Sia
V2 basically turned Sia from a clunky decentralized Dropbox into a scalable, developer-friendly Web3 storage protocol, just in time for the AI + data sovereignty wave.
Still buried in market cap rankings, SC has the potential to quietly reclaim a top 30 spot as the world rediscovers decentralized storage. This isn’t a meme coin—it’s a battle-tested, utility-rich project with real infrastructure, real adoption potential, and serious upside.
#Siacoin #SC #Sia
OMSE falling wedge after IPONeutral on OMSE, another relatively new ticker. Similar to my previous post on DVLT, this ticker is fundamentally strong but stuck in a falling wedge after IPO. Price is struggling to break the daily 20EMA (overlayed on this 4H chart) and has rejected multiple times. The company has strong financials, take the time to do some DD, however this pattern could break to the downside and hit new lows before we see any type of rally given the weakness in this sector at the moment. Set alerts and watch the price action play out, or don't bet your rent money on any direction if entering a position.
I'm just a cat not a financial advisor.

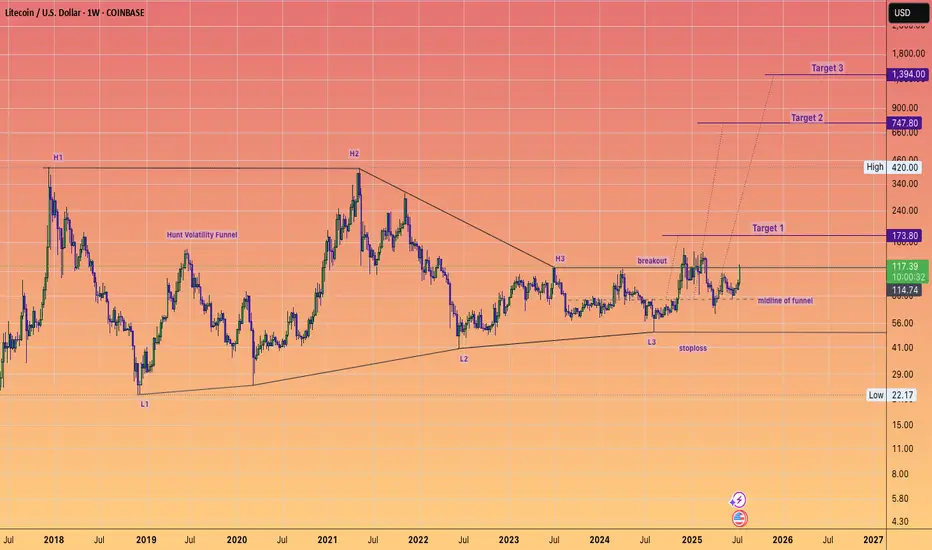
Litecoin has maintained it's HVF and can STILL do a 10X...in the coming years.
This is a massive pattern formed over 7 years and I expect over performance of target 3 ultimately.
The day to week price action really does not matter when you have beautiful setups like this.
Keep stacking at these low prices.
@TheCryptoSniper
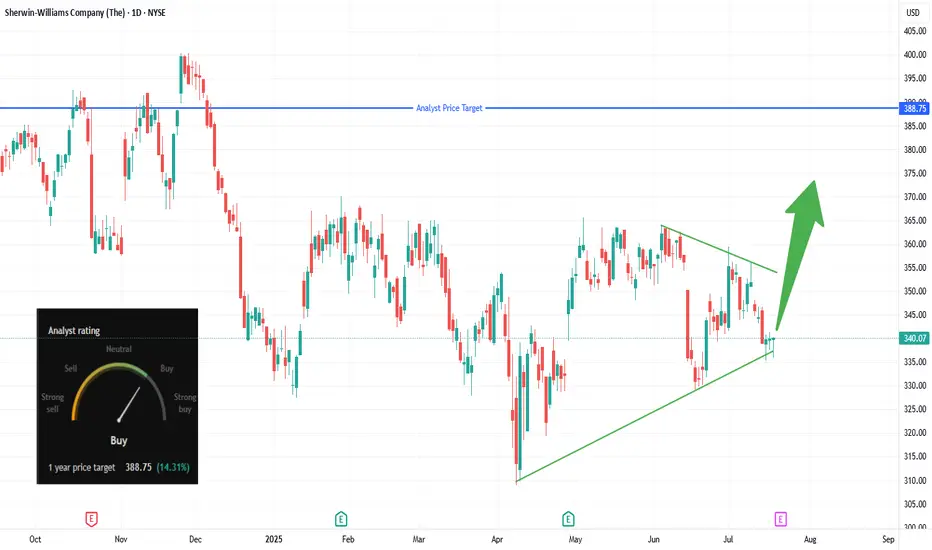
SHW Bulls Ready to Paint the Tape Green?📋 Trade Summary
Setup: Price bouncing off ascending trendline support in a tightening triangle pattern.
Entry: Market buy at ~$340
Stop-loss: Below channel support at $327.74
Targets:
Initial: $355 (trendline break)
Main: $388.75 (analyst price target)
Risk/Reward: ~1:3 R/R
🔎 Technical Rationale
Trendline Support: Price is holding the ascending channel bottom for several months.
Triangle Squeeze: Compression signals potential for a volatility breakout.
Daily Timeframe: Recent bounce coincides with overall market rotation into industrials.
🚀 Catalysts & Context
Analyst Price Target: $388.75 (+14% upside, see chart)
Recent Buy Ratings: Analyst consensus now “Buy” after last earnings.
Sector Rotation: Paint/coatings sector seeing inflows as cyclicals recover.
📈 Trade Management Plan
Entry: Market buy at $340; consider adding above $355 on confirmed breakout.
Stop-loss: $327.74 (below channel support).
Adjustment: Trail to breakeven after move above $355.
Scaling:
Take partial profits at $355
Hold remainder toward $388.75
🗳️ What’s Your View?
Are you watching SHW? Comment below or vote:
🔼 Bullish
🔽 Bearish
🔄 Waiting for confirmation
** Be sure to follow us so you don't miss the next big setup! **
⚠️ Disclaimer: Not financial advice. Trade at your own risk.
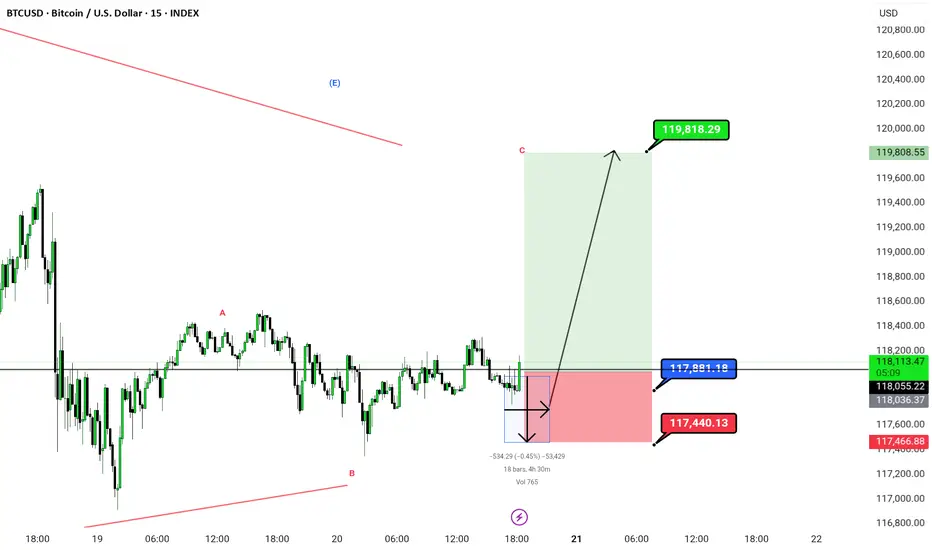
Btc triangle burst |. Bullish This chart shows a 15-minute timeframe analysis for BTC/USD (Bitcoin/US Dollar) using Elliott Wave .
---
📊 Chart Summary:
Wave Structure:
Labeled with corrective wave A–B–C, indicating the end of a corrective pattern.
Price is currently in the potential reversal zone near Wave B, suggesting a bullish move toward Wave C completion.
---
✅ Trade Setup:
Entry Zone: Around current price levels (≈117,889.74)
Stop Loss (SL): 117,440.13 (marked in red)
Target (TP): 119,818.29 (marked in green)
Risk-to-Reward Ratio (RRR): Approx. 1:4, a favorable trade setup
---
🔍 Key Technical Observations:
Bullish Projection: A large green zone indicating strong bullish momentum if Wave C plays out.
Invalidation Zone: Price falling below 117,440.13 would invalidate the bullish count.
Volume Marker: Small thunderbolt symbol at the bottom could imply a volume spike or a critical event time.
Chart Title: Published under Greenfireforex branding, timestamped Jul 20, 2025, likely indicating a public or private analysis post.
---
📌 Possible Interpretation:
This chart suggests a buy opportunity for BTCUSD if price respects the bottom zone (117,440) and begins to climb toward the projected target (119,818). It uses wave theory logic assuming this is a Wave C rally, and price has completed a corrective move.
I'm ready to answer in comments session
Solana and BNB Chain Lead Blockchain Growth: Weekly HighlightsRecord Activity: 342 Million Transactions in Just 7 Days
July 2025 marks a historic milestone for the crypto industry: in a single week, public blockchains processed more than 342 million transactions — the highest figure in the history of decentralized networks. Two platforms stood out the most: Solana and BNB Chain, ranking at the top in network activity and showcasing both technological maturity and growing user demand.
Solana — The Engine of Hyperactive Web3
Solana continues to prove its reputation as one of the most high-performance blockchains. Over the past week, the network processed over 200 million transactions, accounting for more than 58% of total activity. This achievement is driven by Solana’s high throughput and ultra-low fees, making it highly attractive for mass adoption and retail developers.
One of the main growth drivers has been the surge in meme coins and simple tokens created on Solana through platforms like Pump.fun. While these assets are often speculative, they generate massive traffic — tens of millions of transactions daily from thousands of users. This in turn boosts TVL and DEX activity.
But Solana is no longer just about gamified tokens. Increasingly, serious projects in DeFi, infrastructure, and Web3 gaming are launching on the network. New NFT platforms, liquid staking services, and retail investment apps are transforming Solana into a hub for both speculators and long-term participants.
BNB Chain — Stability, Infrastructure, and Maturity
While Solana grabs attention with viral growth and hype, BNB Chain demonstrates the steady strength of a mature ecosystem. The network handled approximately 65 million transactions, securing second place in the weekly rankings. User and developer activity remains consistently high, while tools for building DApps and DeFi products continue to expand.
Recent upgrades, including faster block finality and support for new standardized smart contracts, have enhanced user experience and transaction speed. In 2025, BNB Chain is targeting throughput of up to 20,000 transactions per second, aiming for scalability on par with centralized exchanges.
BNB Chain also plays a strong role in GameFi, logistics solutions, stablecoins, and cross-chain interoperability, positioning itself as a foundation for integrating traditional business models into the crypto ecosystem.
Why This Growth Matters
This record-breaking week signals that crypto has moved far beyond speculative trading. Blockchains are becoming operational environments where millions of value-driven transactions occur daily.
The surge in activity on Solana and BNB Chain underscores a key trend: platforms that combine high traffic capacity with usability and cost efficiency are taking center stage.
Risks and Challenges
Despite the positive outlook, vulnerabilities remain:
Solana could overheat. Activity driven by meme coins is volatile — if hype fades, engagement could plummet.
BNB faces competition from Ethereum L2. Fast, low-cost L2 solutions like Arbitrum and Optimism could lure users away.
Regulatory threats. Any sanctions or restrictions, especially in the U.S., could negatively impact both networks.
Conclusion
Solana and BNB Chain represent two distinct strategies for success:
Solana: speed, scale, and viral engagement.
BNB Chain: stability, ecosystem depth, and infrastructural strength.
Their dominance during the biggest week in blockchain history proves they are among the key architects of the new digital economy. Which one will maintain leadership in the second half of the year remains to be seen — but one thing is clear: the fight for the heart of Web3 is on.
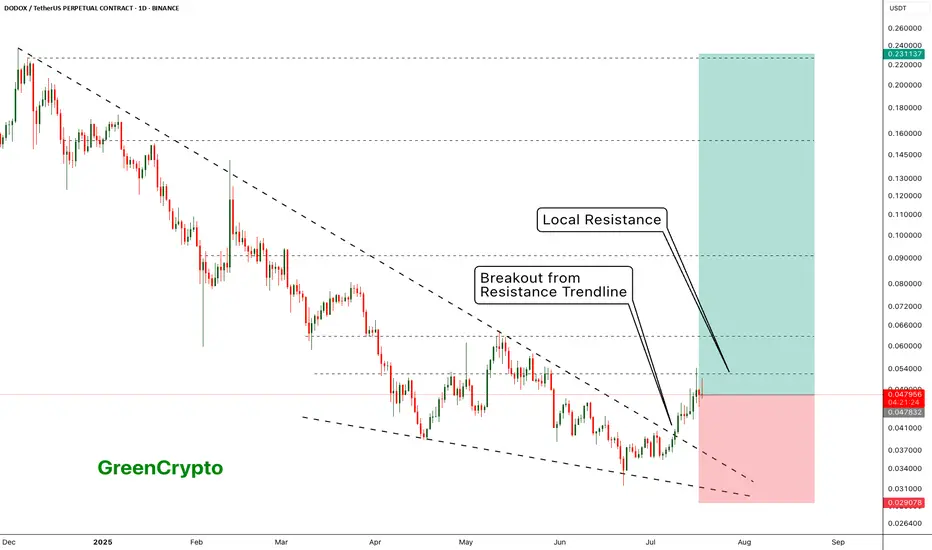
DODOX - Resistance is holding it back - Huge Potential- DODOX has successfully broken out from the resistance trendline
- Now its being pushed back back the weak local resistances
- I see a huge upward potential here.
Entry Price: 0.048271 ( Or you can wait for it breakout from the local resistance of 0.063051)
Stop Loss: 0.029078
TP1: 0.062621
TP2: 0.079766
TP3: 0.103243
TP4: 0.151853
TP5: 0.222332
Max Leverage 5x.
Don't forget to keep stoploss
Cheers!
GreenCrypto
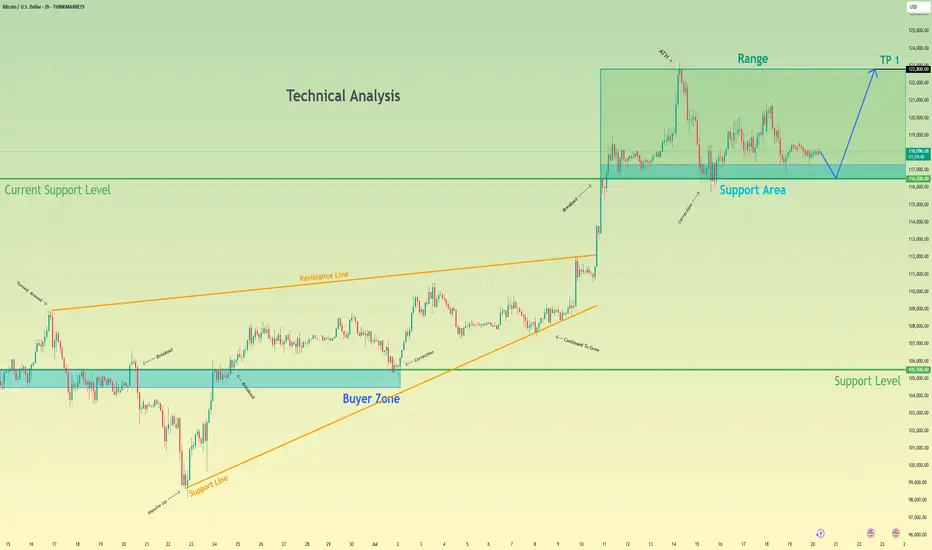
Bitcoin may bounce up from support area to 122800 pointsHello traders, I want share with you my opinion about Bitcoin. Analyzing the broader market context on the BTC chart, the past price action has carved out two significant technical structures: a wide trading range and a larger upward wedge pattern. The formation of this wedge indicates a generally positive market sentiment, though the narrowing price swings suggest a decrease in upward momentum. The foundation of the current structure was established around the buyer zone of 105500 - 104500, a level that has historically proven to be a robust floor. This historical behavior provides a critical reference for our hypothesis. Currently, we are observing bitcoin's price action closely, interacting with the current support area, located between 116500 and 117300. The character of the movement here is largely corrective and consolidative, pointing to a state of temporary equilibrium. This consolidation near the lower boundary of the wedge is a pivotal point. My thinking is that a final, brief dip to thoroughly test the 116500 - 117300 support area is a high-probability scenario. Such a move would effectively absorb remaining sell-side liquidity before a reversal. We can then anticipate an impulsive move upwards across the range. Therefore, the logical take-profit for this long position is set at 122800 points, as this level marks the upper resistance of the range and a natural target. Please share this idea with your friends and click Boost 🚀
Disclaimer: As part of ThinkMarkets’ Influencer Program, I am sponsored to share and publish their charts in my analysis.
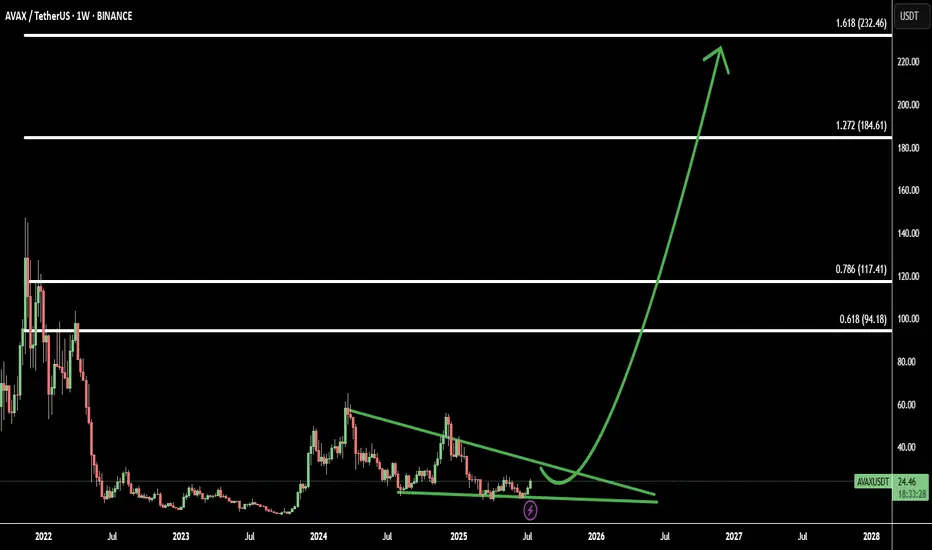
AVAX Breakout from Falling Wedge: Tracking 4 Fibonacci TargetsAvalanche (AVAXUSD) has broken out of a falling wedge pattern on the weekly timeframe, signaling a potential shift from bearish consolidation to a bullish continuation phase. The breakout is a strong technical signal often associated with trend reversals.
Using Fibonacci extensions from the breakout base, I’ve mapped out 4 critical target levels:
Target 1: 0.618 Fib – first major resistance after breakout - 94.18
Target 2: 0.786 Fib – deeper retracement and strong reaction zone - 117.41
Target 3: 1.272 Fib – full extension, potential profit-taking point - 184.61
Target 4: 1.618 Fib – aggressive upside target for extended rally - 232.46
These levels align with historical price structure and may act as magnets for bullish momentum if volume confirms the breakout.
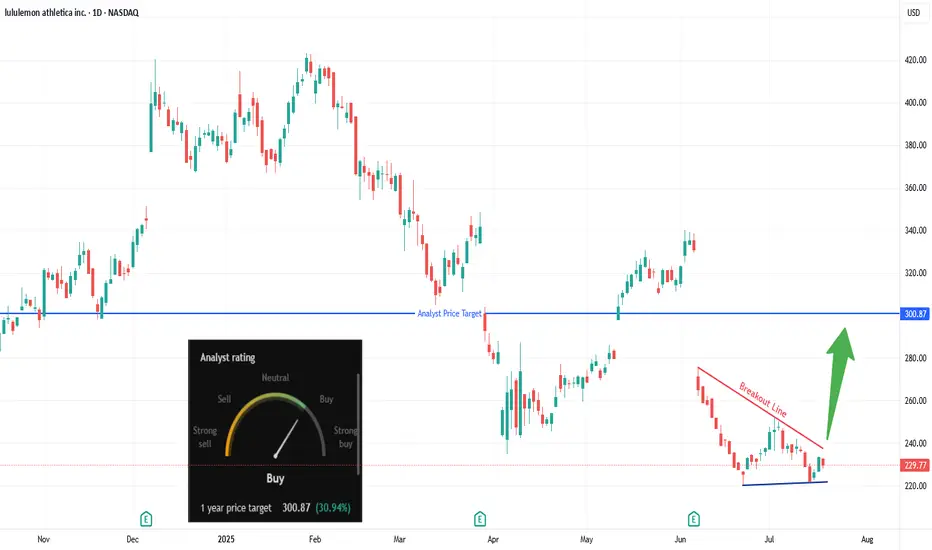
Are Bulls Quietly Loading Up on LULU?Trade Summary 📝
Setup: Descending wedge forming after sharp drop; price testing breakout line.
Entry: Above $240.
Stop‑loss: Below $220 swing low/support.
Targets: $260 , $293–$301 (analyst target).
Risk/Reward: ~3:1 (tight stop, multi-level upside).
Technical Rationale 🔍
Key Signal #1: Descending wedge/bullish reversal pattern; oversold bounce.
Key Signal #2: Bullish divergence forming on recent lows; higher low established.
Context: Daily chart; aggressive sellers losing momentum as wedge tightens.
Catalysts & Context 🚦
Recent gap down created potential “magnet” for gap fill upside.
Surge in unusual OTM call buying last week hints at speculative bullish positioning.
Analyst 1-year target: $300.87 (+30% upside); rating upgraded to Buy.
Watching for sector rotation into consumer discretionary/retail names.
Trade Management Plan 📈
Entry: Only on daily close above $240 breakout line.
Stop‑loss: Initial below $220; trail to breakeven if $260 target hits.
Scaling: Trim at $260, hold partial for $293–$301 extension.
What’s your view? Are you watching LULU? Comment below or vote:
🔼 Bullish
🔽 Bearish
🔄 Waiting for confirmation
*** Follow us now to ensure you don't miss the next big setup ***
Disclaimer ⚠️: Not financial advice. Trade at your own risk.
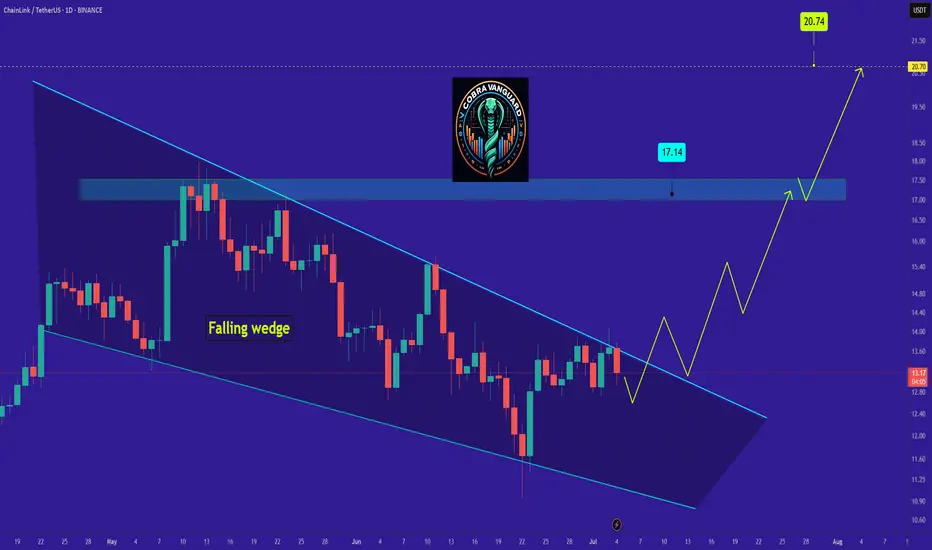
LINK's Situation, A Comprehensive Analysis !!!So if you pay attention to the LINK chart you can see that the price has formed a Ascending wedge which means it is expected to price move as equal as the measured price movement.( AB=CD )
NOTE: wait for break of the WEDGE .
Best regards CobraVanguard.💚
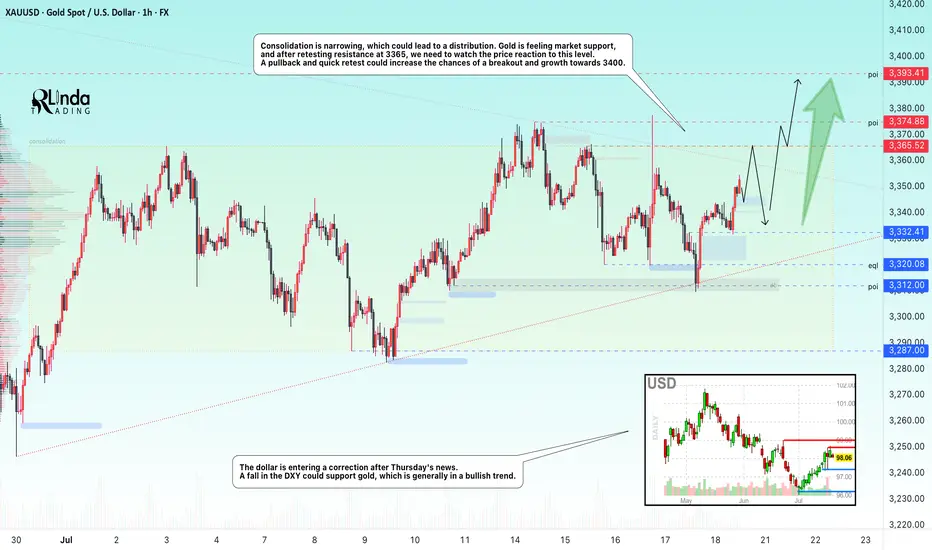
GOLD → Retest of consolidation resistance. Chances of a breakoutFX:XAUUSD bounces off support at 3312, forming a false breakdown at 3320. The price is heading towards consolidation resistance. The chances of continued growth are increasing...
Gold rebounded from its low amid statements by Fed member Waller about a possible rate cut in July. However, strong US sales and labor market data strengthened the dollar and held back XAU/USD growth. Despite statements by some Fed members about maintaining a tight policy, traders continue to expect rate cuts before the end of the year. The focus is on new economic data that could affect the dollar and gold prices.
Technically, consolidation is narrowing, which could lead to distribution. Gold is feeling market support, and after retesting resistance at 3365, we need to watch the price reaction to the level. A pullback and quick retest could increase the chances of a breakout and growth to 3400.
Resistance levels: 3365, 3375
Support levels: 3332, 3320, 3312
There is a high probability that there will be an attempt to break through the consolidation resistance amid expectations of a rate cut. This phase may be accompanied by either a correction to retest and return for a breakout, or a breakout and consolidation of the price above the level. Today, Friday, I expect a retest and correction, as there may not be enough local potential for a breakout of this level, and the price has already lost some of its momentum since the opening of the session...
Best regards, Linda!
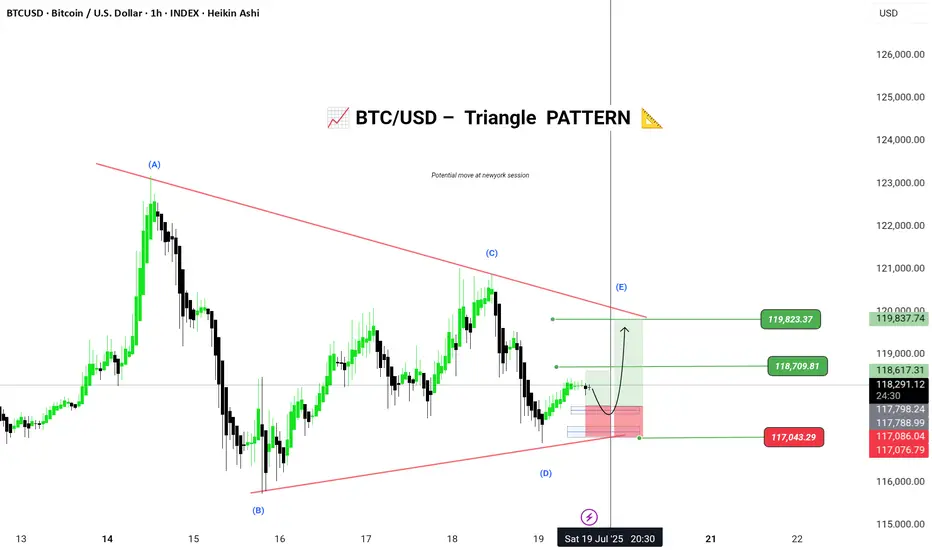
BTC/USD – Triangle Wave E Setup (Potential Bullish Breakout)Bitcoin is currently forming a contracting triangle (ABCDE) structure on the 1H chart. The market appears to be respecting the lower trendline support and could be completing Wave D, now preparing to push into Wave E.
🟢 Entry Zone: 117086 – 117076
🎯 Targets:
• 118709
• 119823
⛔ Stop Loss / Invalidation: Below 117043
🧩 Pattern: Elliott Wave Contracting Triangle
📅 Timeframe: 1H (Heikin Ashi)
📌 Chart by: @Greenfireforex
📌 Wait for a bullish confirmation candle above the support zone for a safe long setup. Triangle break could lead to momentum continuation toward the targets.
---
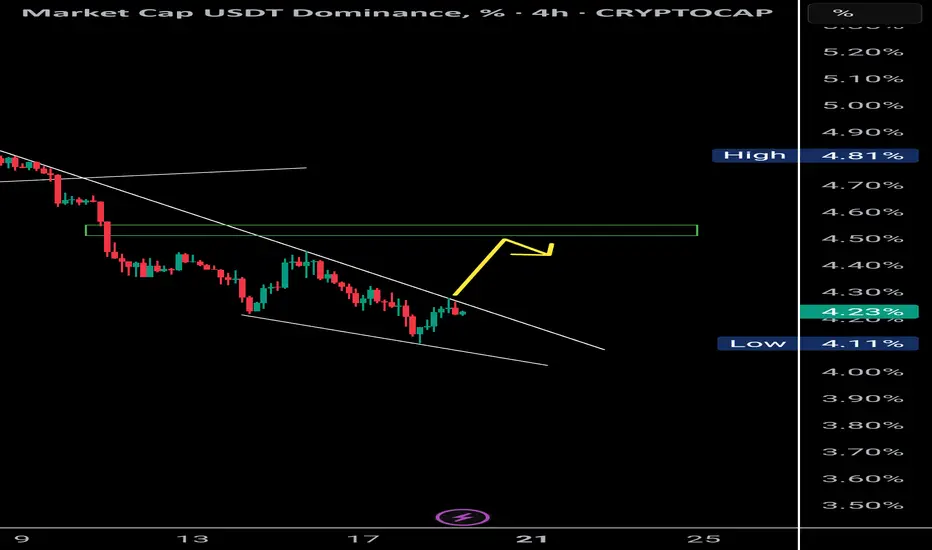
USDT Dominance Forming Bullish Divergence | Altcoins May Retest 📉 USDT Dominance (4H):
Currently forming a bullish divergence with RSI, supported by a falling wedge structure. Price is respecting a clear supply OB (resistance zone) and might retest the 4.55% level.
🔁 Historically, a rise in USDT.D signals short-term corrections in BTC and altcoins, creating opportunities for OB/supply fills and long setups.
📊 This could be the retest phase for major crypto assets before resuming upward momentum.
🧠 Use this phase wisely — it’s where strong setups begin to form.
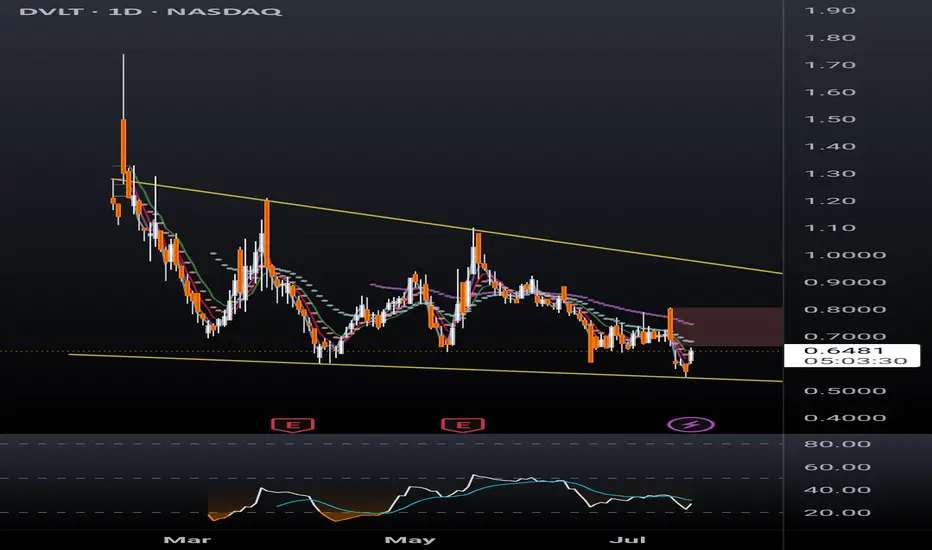
DVLT falling wedge, TP $1+DVLT a relatively new ticker is already drawing a lot of attention. Up 13% today after hitting new all time low yesterday, sure to catch a lot of eyes from retail investors. With recent news releases such as a licensing agreement with IBM, a lawsuit against naked short selling, and US patent allowances, target prices have been announced ranging from $3 to $11/share.
Disclaimer, this ticker is PRONE TO HEAVY DILUTION, however in order to remain listed on NASDAQ the SP will have to hit $1 and remain there. This being the case, the company must have something in the books to break upward out of this falling wedge and give shareholders a reason to stay with the company long term.
I'm just a cat not a financial advisor.
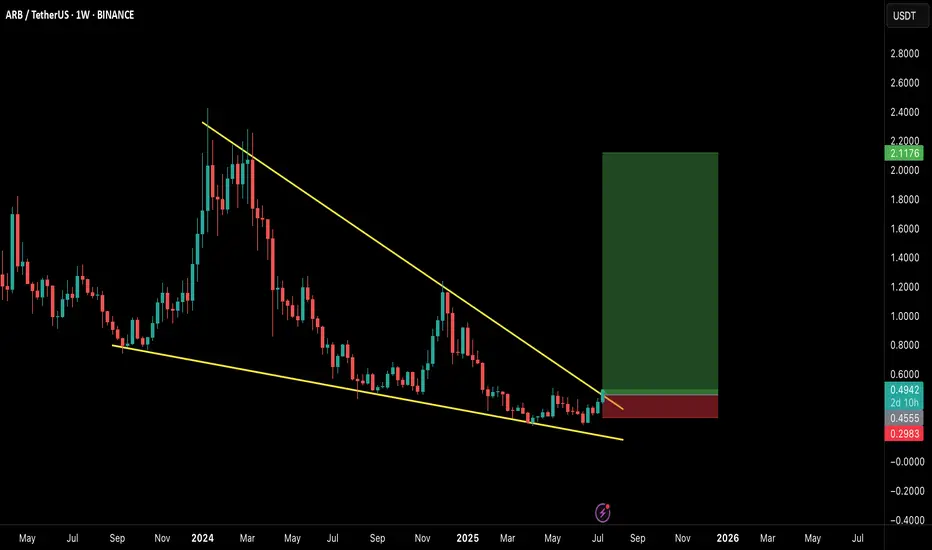
ARB/USDT – Weekly Breakout Setup!Hey Traders!
If you’re finding value in this analysis, smash that 👍 and hit Follow for high-accuracy trade setups that actually deliver!
Massive Falling Wedge Breakout in Play!
ARB just confirmed a breakout from a long-term falling wedge pattern on the weekly timeframe, which has historically been one of the most reliable bullish reversal structures in technical analysis.
🧠 Why this setup matters:
The falling wedge has been forming for over a year, indicating long-term accumulation and compression.
Price has clearly broken above the descending resistance, suggesting a potential shift in momentum.
The structure resembles previous explosive moves, and this could just be the start of a multi-month rally.
🟢 Trade Setup:
Entry: CMP ($0.49) & accumulate on any dips
Targets:
🎯 $0.85
🎯 $1.30
🎯 $2.10+ (Full wedge target)
Stop-loss: 🔴 Close below $0.30
Timeframe: Mid to long term (6–12 weeks or more)
🚀 Bullish Signals:
Weekly breakout candle with strong volume (confirmation pending close).
Market-wide sentiment is gradually turning, and ARB may become one of the leaders.
📌 Final Thoughts:
This is a high-conviction swing setup with a strong reward-to-risk ratio. Keep an eye on weekly close confirmation and market sentiment for better entries.
💬 Let me know your thoughts or if you’re riding this setup too!
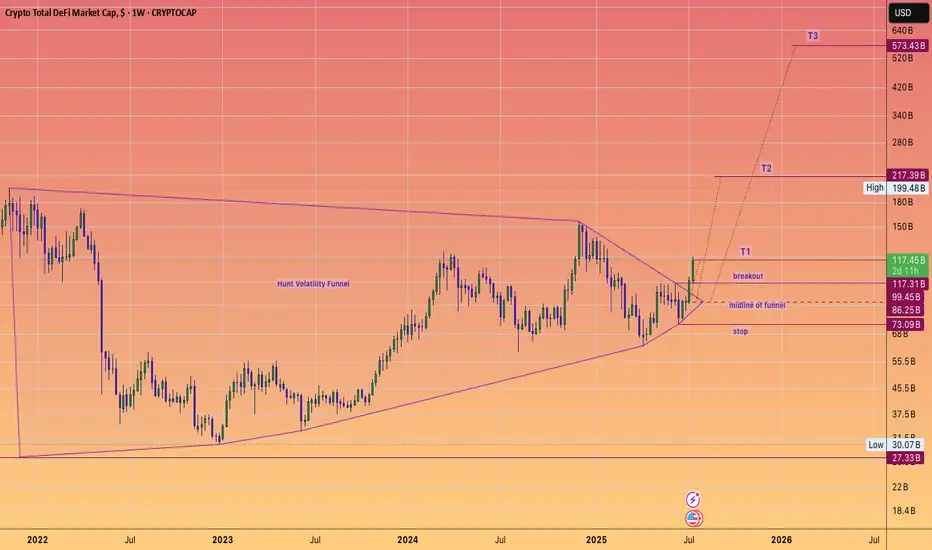
DeFi Moonshot! Moon mission to $573 Billion dollars!DEFI fuelled by Ethereum, built on proven protocols and stablecoin legislation is ready to keep cranking higher for the rest of the year. And instead of a Defi summer of emergence (2020), a multi season of adoption that takes it to half a trillion dollars, hitting these targets of a #HVF
@TheCryptoSniper
The components set to benefit are:
Uniswap #UNI ~ $12.3 Billion
Lido DAO #LDO ~ $9.1 Billion
Aave #AAVE ~ $7.5 Billion
MakerDAO #MKR ~ $4.6 Billion
GMX #GMX ~ $2.5 Billion
Curve #CRV ~ $1.9 Billion
Synthetix #SNX ~ $1.1 Billion
Pulsex #PLSX ~ $0.46 Billion
Key points:
The #TotalDefi index is currently at $117B aligning closely with the $123.6B of TVL
As we see hundreds of billions of dollars get digitized watch this index climb onwards and upwards... With $1 Trillion dollars and obvious milestone that is surely set to be met ... one day.