SOL: Wedge Pattern!SOL/USDT is making a rising wedge pattern on 1 day chart.
There can be 2 scenarios:
1. If SOL breakout through the lower trend line below 40 then the targets are on next support areas marked on the chart (Green)
2. If SOL holds the area in the wedge then the targets are on next resistance areas marked on the chart (Red)
Share your views in the comment section.
Like & follow for more easy and simple trading ideas.
Thank You!
Wedgepatterns

STAR - Wait for the confirmation Expecting a breakout at the level of 357-360
These are my thoughts am not recommended advisor.. Do your own analysis , when you enter , please be prepared with minimum 3-4 good reasons why you enter.
* Giving confirmation but failing to breakout
* Lets wait for confirmation and make conclusions from MA and VOL
* Falling Wedge followed by good consolidatory support zone
PS: This is for educational purpose. Feel free to give your own thoughts and I am happy to learn from you.

falling wedge wedge NASDAQ first six months of the year has been bad for nasdaq. it has made more than 30% correction after coronavirus boom.
this series of lower low and lower high has made falling wedge pattern
in this downward correction because fed QT beginners investor made loss while big investor were waiting from sideline for 30% correction.
new quarter and new half of the year and recession in usa has been started
✅will Nasdaq benefit form portfolio rebalancing in H2 2022 ?
✅will nasdaq make new all time high in stagflation (because it will take several years to send inflation back to 2%)
✅will fed pause rate hike in September fomc ?

Ethereum ETH at critical support border of rising wedge !!!Ethereum at critical support border of rising wedge !!!
As many other cryptocurrencies ETH is in a rising wedge that is typically a bearish pattern
Right now we are at critical levels on price chart and RSI again - exciting hours are imminent dear Crypto Nation
Will keep you updated
*not financial advice
do your own research before investing

FTMUSDTHello my dear friends
I hope we will have a profitable week together (:
Considering the specified ranges and the ascending wedge pattern at the end of the upward trend and the negative divergence of RSI, it seems that the possibility of correction to the blue range of $0.2657 is not out of mind.
Please keep in mind that if you want to trade with this analysis, you must place the loss limit above the blue range, for us the priority is the range, not the technical pattern.
We would be happy to hear your comments

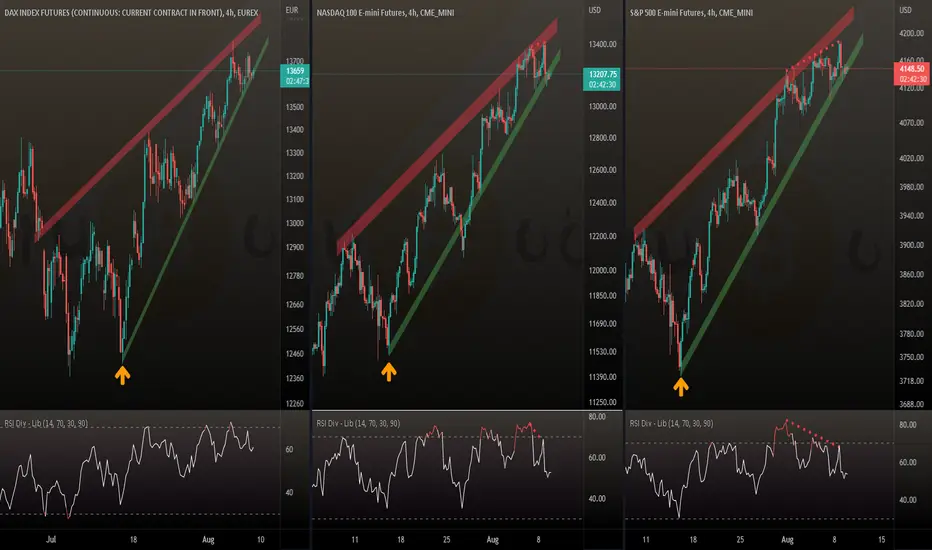
DAX SPX Nasdaq - some rising wedges - some bearish divergencesDAX SPX Nasdaq - some rising wedges - some bearish divergences
Not a really bullish cocktail at all - all indices at the critical support line a the moment
Some hours of trues dear Crypto Nation? But I can't imagine a real direction decision before tomorrows CPI announcement
Will keep you updated - still nothing happened yet
*not financial advice
do your own research before investing
falling wedge enter at bottom or after breakoutfalling wedge enter at bottom or after breakout..The Leading E-commerce Platform in Africa

BNB rising wedge #BNB/USDT
$BNB is above lower line of rising wedge.
The same scenario of #BTC!
🐻 break down from lower line will drop price to support zone.
🐮 rejection from lower line of this pattern will increase price to upper line and maybe resistance zone.

ENJUSDTHello my dear friends
According to the negative divergence of RSA, if the price range of $0.573 is completely consumed, then the probability of reaction to the yellow area ($0.697) is high.
From the yellow area, we expect the formation of a corrective trend up to the range of $0.515 and $0.418.
We would be happy to hear your comments.

META "Triple Bottom" Inside "Falling Wedge" Pattern
Patterns Identified- "Triple Bottom" inside "Falling Wedge" pattern
Bottom to neckline measurement is approx. 17.89! The measurement for the wedge from its lowest low and highest high is approx. 198.46.
My entry will be just above the break of the neckline at 172. I will use a stop loss which I won't disclose on this forum. Profit taking areas will also be set prior to placing the trade.
Follow my channel for more trading ideas and to share your trade ideas with me.
*This is not financial advice.
Loved & Blessed,
MrALtrades00

Polygon (MATIC) x Total volume traded on UniswapAs per the bearish divergence from February 2021 to May 2021, this indicator has early signaled the top.
Now the traded volume is about to exit a bearish channel.
We also have an expansion wedge that is about to be broken along with the 50% retracement.

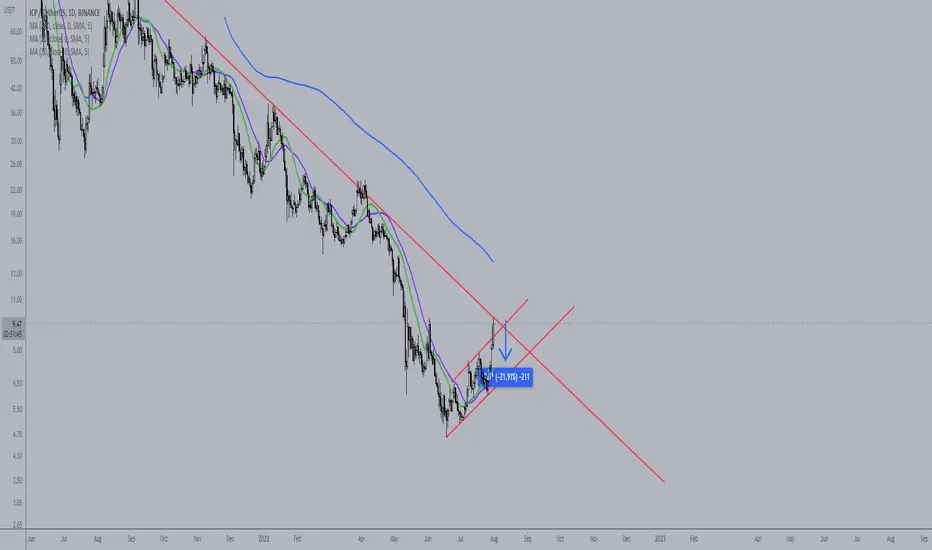
ICP/USDTICP in Wedgepattern, short oportunity. Breakout this wedge invalid this idea.
IT NOT FINANCIAL ADVICE
Study case !
Will SPY fill the gap or make a short squeeze?I would bet on the short squeeze... sometimes the market doesn't follow logic, but I could be wrong, obviously.
1. Price testing long pandemic retracement of 21.4% at $ 405.49.
It broke 38.2% short retracement from the last top.
Stochastic DMI in dangerous region.
2. Is there still room to go up?

% of stocks above 200 moving average (SPX)This indicator anticipated the fall of the SPX well in advance, according to the yellow line on April 12, 2021.
Showing a clear divergence.
As SPX went up, the indicator went down.
Only on January 10, 2022 was there a trend reversal in SPX, going down.
Now the indicator appears to be anticipating a rally.

Bearish Wedge Sell Points (in red)Two different types of Wedges both showing a similar sell point entry
The sell point is right below the wedge, so if a breakdown occurs, a retest and consequent rejection follows
This is common between both wedge patterns
From personal experience I have seen Rising Wedges act more bearishly than Broadening (megaphone) structural wedges
However both of them have the potential to be bearish.

CHEF - Beat earnings and revenue. Low risk setupTest with pilot position, 10% of full position. Beat earnings and revenue guidance.
You don't need to know what's going to happen next to make money ~Mark Douglas
Lose like a pro and keep trading, or lose like a novice and quit ~Mark Ritchie

Trading opportunity on DOTUSDT PolkadotBased on technical factors there is a Long position in :
📊 DOTUSDT Polkadot
🔵 Long Now 6.69
🧯 Stop loss 5.90
🏹 Target 1 7.50
🏹 Target 2 8.40
🏹 Target 3 9.25
💸Capital : 1%
We hope it is profitable for you ❤️
Please support our activity with your likes👍 and comments📝

GBPUSD, H4 - Resistance at Fibo levelPrice moves within wedge pattern and it reacted on 50% Fibo level. Possible some move down towards 1.1900. Breakout from wedge pattern needed as confirmation. Trade carefully!

GOODBYE MR.SPYFrom the 10th of June to July 21 we have been trading inside an ascending channel. On the hourly chart we can see price action inside of the channel and what we see here is an ascending wedge formation which will push the price action back into a downwards spiral. MACD is crossing the signal line on the hourly to the downside along with a heavy three day streak of a green market proving a slowdown is necessary. 390 zone minimum

💡Don't miss the great BUY opportunity in BTCUSDHi dears
It looks like we are forming a wedge pattern that has a very good price on the floor, and now we expect to climb at least to the pattern ceiling, and even next week the ceiling of the pattern may be broken and up to $ 30000. I tried to set the least risky targets.
What do you think? I would be happy to support me with Likes, Comment and Fallow !❤️

USDJPY Showing a WedgeHey traders,
USD is trading higher across the board based on hawkish FED, after good US NFP figures last week. The next key event to watch is going to be tomorrow when we will get the US CPI data. This will be an important event for traders' decision to see if inflation is slowing down or will FED have to be even more aggressive. If suddenly CPU numbers will really come down, then we think US yields will drop as 10-year US notes can break above the horizontal resistance. And this can then be a trigger for a drop on USDJPY.
In fact, from an Elliott Wave perspective, we see an ending diagonal which is known as a reversal pattern. Usually you will see a strong reversal in a trend when the ending diagonal is finished. But when it's that? Well, when lower trendline support and wave (4) swing supports are broken. For now that's not the case, so it's deffinitely too soon for any "reversal" to be confirmed, but it's good to have it in mind while pair trades below 140.40. That's an invalidation level as wave three must not be the shortest.
Trade well,
Grega

BTC outlook for 18 July 2022. BTC respecting the strong support zone, following the wedge nicely. Currently BTC is making a nice bullish push towards the next resistance zone around 22,6k. If we can continue with this momentum and close above this strong resistance zone I believe BTC will continue pushing upwards to tests the next major levels around 26,7k in the near future.

Ascending Wedge forming on BTCA potential ascending wedge is forming on 1H BTC chart.expext BTC to drop from highest peak.you could see volume decreasing in the wedge as it builds higher highs which gives this pattern strength.good luck!
