GBPNZD- Bearish Wedge Pattern - SHORT SELL GBPNZD ; after series of HH and HL, now is the time for the market to take some reversal. market has formed divergence on 30 M time frame. we can see formation of Bearish Wedge patter which is a strong indication of up-trend getting weaker.
Once, market breaks the LH we can enter into the market. we have got projection on the charts (thanks to wedge pattern)
we have 4 TPs with a R:R of 1:1, 1:2 , 1:3 and 1:4 respectively.
SL is placed slightly above last LH.
Wedgepatterns

USDCHF - BUY CALL - Divergence + wedge pattern + Accumulation USDCHF - currently the pair is in consolidation phase, followed by RSI Bullish Divergence and A wedge pattern. These two formations followed by a Bearish trend gives us an indication that market will take a bull run after accumulating positions.
we plan our entry as follows.
Entry Point : After break of Resistance level (LH)
TP1 : with a risk to reward of 1:1
TP2 : 1:2 Risk to Reward
Stop LOSS : slightly below the LL of bearish trend.

Be careful with EOS !!!The EOS will increase 30 cents and reach to the top of the wedge in the coming weeks .
Give me some energy !!
✨We spend hours finding potential opportunities and writing useful ideas, we would be happy if you support us.
Best regards CobraVanguard.💚

SWIGGY MAY DELIVER ON TIME Swiggy's stock has been facing challenges recently, with its share price hitting an all-time low after the IPO lock-in period ended. The company has been struggling with profitability, and its losses widened to ₹1,081 crore in Q4FY25, compared to ₹555 crore in the same period last year. Despite this, analysts remain cautiously optimistic, with 13 out of 20 maintaining a "buy" rating on the stock.
Swiggy's food delivery business has shown strong growth, but its quick commerce segment, Instamart, has been underperforming compared to competitors like Blinkit. The company has been aggressively expanding its store count, but rising expenses have impacted its bottom line. Some analysts believe Swiggy is following a similar path to Paytm, struggling to convert losses into sustainable profits.
- Revenue Growth: Swiggy's revenue has been increasing steadily, with a 45% year-on-year growth.
- Profitability Concerns: The company reported a net loss of ₹1,081 crore in Q4FY25, nearly double the previous year.
- Market Sentiment: Analysts remain cautiously optimistic, with some maintaining a buy rating despite recent stock declines.
- Stock Price Target: The average long-term price target for Swiggy is ₹600, representing an 87.32% upside from its current price.
- Competitive Position: Swiggy continues to dominate the food delivery market, but its quick commerce segment (Instamart) faces stiff competition.
- Market Sentiment: Despite recent losses, Swiggy remains a midcap stock with strong investor interest.
Overall, Swiggy's stock is facing selling pressure, and traders may want to watch for breakout signals before making a move
BUT PERSONALLY I WILL ADD SOME QTY AT CURRENT LEVELS.

bullish tradel'm anticipating gold to buy until it broke the previous high that was set on 21/4/2025. lm anticipating that the market will grab liquidity to the previous high and then make a temporary draw down

Wedge bullish breakoutl'm anticipating an upward breakout out of the wedge pattern but before the market buy im looking forward to see a false breakout to the downward and then reverse to the upward

Will This Descending Wedge Push HYPE to 22.5?If we take a closer look at the price structure, the orange and blue arrows show that BITGET:HYPEUSDT is in an overall uptrend. Meanwhile, the white arrow represents a minor pullback—just a ripple within the bigger trend.
When we connect the orange to the white, and then the white to the blue arrow, we can spot a descending broadening wedge formation. Given the current bullish structure, this pattern is more likely acting as a continuation rather than a reversal.
After the pattern is completed, the key level to watch is the resistance around 16.62, which comes from the white arrow's high. This level will decide whether price can break through and continue its bullish momentum toward the target zone at 20.52 – 22.55, or if sellers will step in and cause a rejection.
In case of a rejection, we might see some sideways movement as the market consolidates before making the next move.

Silver Breakdown: Rising Wedge Bearish Move Towards Target1. Chart Overview
This 4-hour (H4) chart of Silver (XAG/USD) shows a clear Rising Wedge Pattern, a bearish technical formation. The price action recently broke below the lower support trendline, confirming a downside move. Several key levels, indicators, and trading strategies can be derived from this setup.
2. Identified Chart Pattern: Rising Wedge (Bearish Reversal)
A Rising Wedge is a pattern that forms when price consolidates between two upward-sloping trendlines, with the support line rising at a steeper angle than the resistance line. This pattern is considered bearish because it signals weakening buying pressure and an impending breakdown.
Uptrend Formation: The price had been moving within a wedge, forming higher highs and higher lows.
Volume Considerations: A wedge breakout is often accompanied by increasing volume, further confirming the trend shift.
Breakout Confirmation: The price has decisively broken below the lower boundary of the wedge, indicating that sellers are taking control.
3. Key Technical Levels & Trading Strategy
Resistance Level (Rejection Zone) – $34.00 - $34.50
The upper boundary of the rising wedge acted as strong resistance.
Multiple price rejections confirm sellers' dominance in this area.
Any future retest of this level may provide a new opportunity for short entries.
Support Level (Broken & Retested) – $32.50 - $32.80
This zone previously acted as strong support, preventing price from falling lower.
Now that price has broken this support level, it could act as resistance if a retest occurs.
A confirmed rejection here will further validate the bearish outlook.
Stop Loss Placement – $34.16
A logical stop-loss placement is slightly above the previous swing high and resistance area.
If price moves above this level, it would indicate that the breakdown has failed, invalidating the bearish setup.
Bearish Target – $30.76 (Measured Move Projection)
This level is derived from the height of the rising wedge pattern projected downward.
The area around $30.76 aligns with a previous support zone, making it a reasonable target for the current breakdown.
4. Price Action & Future Expectations
Current Market Sentiment: Bearish
The break below the wedge confirms a bearish sentiment.
A slight retracement to the previous support (now resistance) around $32.80 - $33.00 is possible before further downside.
If selling pressure remains strong, Silver is likely to reach the $30.76 target in the coming sessions.
Alternative Scenario: Bullish Recovery
If the price moves back above $34.16, the bearish outlook is invalidated.
A sustained move above this level could indicate a false breakdown and may push Silver toward new highs.
5. Trading Plan Based on This Setup
🔹 Entry Strategy:
Look for a retest of the broken support zone ($32.80 - $33.00) to enter short positions.
A rejection from this level with bearish confirmation (e.g., a bearish engulfing candle) strengthens the trade setup.
🔹 Stop Loss:
Placed above the wedge resistance at $34.16 to protect against false breakouts.
🔹 Take Profit Targets:
First Target: $31.50 (intermediate support level)
Final Target: $30.76 (measured move projection of the wedge)
6. Conclusion
This Rising Wedge Breakdown on Silver’s H4 chart presents a strong bearish trading opportunity with a well-defined risk-reward ratio. The break below key support signals continued downside, with $30.76 as the next major target. However, traders should monitor any retest of the broken support zone to confirm further selling momentum before entering new positions.

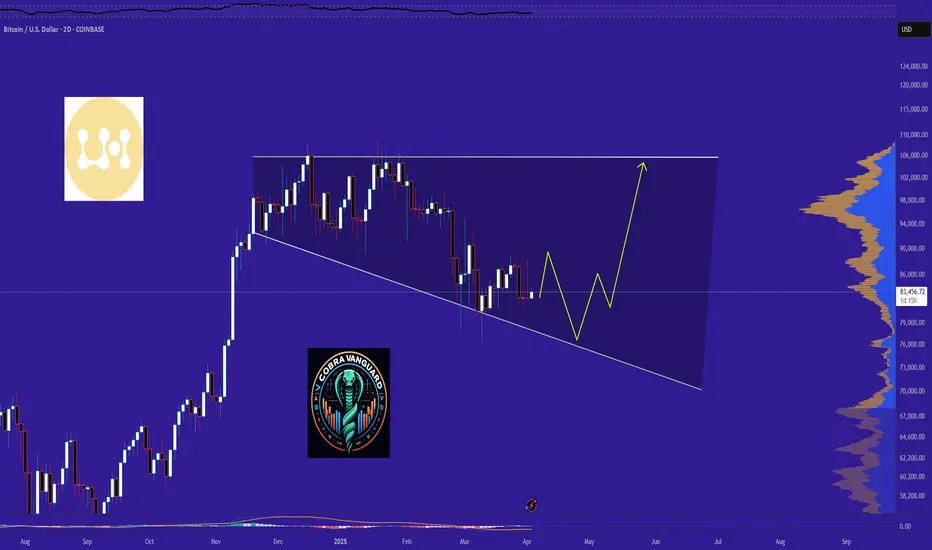
BTC Ready for PUMP or what ?The BTC will increase 20k and reach to the top of the wedge in the coming DAYS.
Give me some energy !!
✨We spend hours finding potential opportunities and writing useful ideas, we would be happy if you support us.
Best regards CobraVanguard.💚
_ _ _ _ __ _ _ _ _ _ _ _ _ _ _ _ _ _ _ _ _ _ _ _ _ _ _ _ _ _ _ _
✅Thank you, and for more ideas, hit ❤️Like❤️ and 🌟Follow🌟!
⚠️Things can change...
The markets are always changing and even with all these signals, the market changes tend to be strong and fast!!
Ultimate Guide to Mastering Chart PatternsChart patterns are essential tools for traders looking to identify high-probability setups based on price action. Among the most reliable continuation and reversal patterns are triangles, wedges, and flags. These formations help traders anticipate market direction and make informed decisions based on breakout potential, trend strength, and volume confirmation.
In this guide, we’ll explore the key characteristics, trading strategies, and confirmation techniques for each of these patterns to improve trade execution and risk management.
Triangle Patterns
Types of Triangle Patterns
Triangles are consolidation patterns that indicate a period of indecision before price continues in the direction of the breakout. There are three main types of triangle patterns:
Ascending Triangle – A bullish continuation pattern where the price forms higher lows while resistance remains flat.
Descending Triangle – A bearish continuation pattern where the price forms lower highs while support remains flat.
Symmetrical Triangle – A neutral pattern where price forms lower highs and higher lows, squeezing into an apex before breaking out.
How to Trade Triangles
Identify the Triangle Formation: Look for at least two touchpoints on each trendline (support and resistance) to confirm the pattern.
Wait for Breakout Confirmation: The price should break above resistance (bullish) or below support (bearish) with strong volume.
Set Entry & Stop-Loss Levels: Enter the trade after a candle closes beyond the breakout point. Set a stop-loss below the most recent swing low (for bullish trades) or above the swing high (for bearish trades).
Measure Target Price: The expected move is typically equal to the height of the triangle measured from the widest part of the pattern.
Wedge Patterns
Types of Wedge Patterns
Wedges are similar to triangles but are characterized by sloping trendlines that converge in the same direction. They indicate a potential trend reversal or continuation depending on the breakout direction.
Rising Wedge – A bearish reversal pattern that forms during uptrends. The price makes higher highs and higher lows, but the slope narrows, signaling weakening momentum before a breakdown.
Falling Wedge – A bullish reversal pattern that forms during downtrends. The price makes lower highs and lower lows within a narrowing channel before a breakout to the upside.
How to Trade Wedges
Identify the Wedge Pattern: Look for a contracting price range within two sloping trendlines.
Watch for a Breakout: The price should break either above (for falling wedges) or below (for rising wedges) with increasing volume.
Confirm the Breakout: Use additional indicators such as RSI divergence or moving average crossovers to validate the move.
Set Entry, Stop-Loss, and Target: Enter after the breakout candle closes beyond the trendline, with a stop-loss outside the opposite side of the wedge. Target the height of the wedge projected from the breakout point.
Flag Patterns
Characteristics of Flag Patterns
Flag patterns are continuation patterns that occur after a strong impulsive move (flagpole), followed by a period of consolidation (flag) before price resumes the trend. Flags can be classified as:
Bullish Flag – Forms after a strong upward move, followed by a downward-sloping consolidation.
Bearish Flag – Forms after a strong downward move, followed by an upward-sloping consolidation.
How to Trade Flag Patterns
Identify the Flagpole: Look for a sharp price move in one direction, which forms the base of the flag.
Confirm the Flag Formation: Price consolidates within parallel trendlines that slightly slope against the prior trend.
Wait for the Breakout: Enter when price breaks out of the flag pattern in the direction of the previous trend with strong volume.
Measure Target Price: The price target is typically equal to the length of the flagpole projected from the breakout point.
Set Stop-Loss: Place the stop-loss below the lower boundary of the flag (for bullish flags) or above the upper boundary (for bearish flags).
Common Mistakes & How to Avoid Them
Trading Before Confirmation: Many traders enter too early without waiting for a breakout confirmation, leading to false signals.
Ignoring Volume: Breakouts should be accompanied by a volume surge for validation; weak volume can indicate a fake breakout.
Setting Tight Stop-Losses: Giving the trade enough room to breathe by placing stops outside key support/resistance levels prevents getting stopped out prematurely.
Forgetting to Manage Risk: Always follow proper risk-reward ratios (at least 1:2) to ensure profitable long-term trading.
Final Thoughts
Triangle, wedge, and flag patterns are powerful tools for traders who understand their structure and breakout behavior. By combining these patterns with volume analysis, trend confirmation indicators, and proper risk management, traders can increase their chances of success. Whether you're trading stocks, forex, or crypto, mastering these patterns will enhance your ability to navigate the markets efficiently.
__________________________________________
Thanks for your support!
If you found this guide helpful or learned something new, drop a like 👍 and leave a comment, I’d love to hear your thoughts! 🚀
Make sure to follow me for more price action insights, free indicators, and trading strategies. Let’s grow and trade smarter together! 📈

BTCUSDT Falling Wedge ( Possible Scenario )BTC is testing the key level at 81600 right now and if this level fails to hold BTC will falls to 69-72k which is the bottom of falling wedge

Falling Wedge Pattern For ZCash??When a security's price has been falling over time, a wedge pattern can occur just as the trend makes its final downward move.
The trend lines drawn above the highs and below the lows on the price chart pattern can converge as the price slide loses momentum and buyers step in to slow the rate of decline.
Before the lines converge, the price may breakout above the upper trend line.

The THETA chart sure has a story to tell!*"Here is a copy of my latest THETA chart, which I recently covered. There is a lot of information to be discovered simply by looking at it and drawing the proper conclusions. This will be one to watch as we move forward into the 'April flash crash' thesis I have been widely discussing.
Even if it doesn't materialize as I've theorized, there are still some interesting developments that could be coming regarding the future of this asset.
Good luck, and always use a stop loss!

Still Bullish on Bigger Time Frames.Still Bullish on Bigger Time Frames.
Hidden Bullish Divergence has appeared.
Immediate Resistance lies around 186 - 189
Crossing this Level with Good volumes may
expose 197 - 200
Fresh Entry should be Triggered if 205 is Crossed
& Sustained; only then it may resume its Uptrend.

AudJpy formed rising wedge pattern!Looking for Impulse Down.
AudJpy formed rising wedge pattern as continuation pattern and AJ should continue fall to the deep. Make sure you have your own rules on RR and follow them. This is just a trading idea to help you gain better knowledge. If you have any question ask me in comments.
Learn & Earn!
Wave Trader Pro

USDJPY Signal - 5 months support test 24.2.25148.60 to 152.70 range
Currently trading at 149.70
Support of 148.60-149.80 range is holding strong for the past 5 months.
Standard correction 300 pips up towards 152.70 makes sense following the expanding wedge pattern highlighted on the chart.
100 pip downside compared to 300 pip upside swing trade.
Make logical, timed, calculated action sticking to a plan and managing risk as top priorities.
GOOD LUCK!

S&P 500 BREAKOUT?! 18.2.25Simple as can be.
1. November 2024 - Feb 2025 wedge pattern, converging support and resistance with higher highs and lows.
2. Descending trend-lines within the wedge, first line broken Jan 16th (highlighted) - 3% jump in 3 days of trading, second line broken today, Feb 18th.
3. Potential rise to the top of the wedge pattern, around the mid 6300's.
Stay logical, with a plan and consistent.
Fortune favors the brave!

EURUSD 240 MINS CHART TIME FRAMEThe Structure looks good to us, waiting for this instrument to correct and then give us these opportunities as shown on this instrument (Price Chart).
Note: Its my view only and its for educational purpose only. Only who has got knowledge about this strategy, will understand what to be done on this setup. its purely based on my technical analysis only (strategies). we don't focus on the short term moves, we look for only for Bullish or Bearish Impulsive moves on the setups after a good price action is formed as per the strategy. we never get into corrective moves. because it will test our patience and also it will be a bullish or a bearish trap. and try trade the big moves.
We do not get into bullish or bearish traps. We anticipate and get into only big bullish or bearish moves (Impulsive Moves). Just ride the Bullish or Bearish Impulsive Move. Learn & Know the Complete Market Cycle.
Buy Low and Sell High Concept. Buy at Cheaper Price and Sell at Expensive Price.
Please keep your comments useful & respectful.
Keep it simple, keep it Unique.
Thanks for your support
Tradelikemee Academy
Saanjayy KG

Nothing !!!The price will reach the top of wedge = 0.007 in the short term.
Give me some energy !!
✨We spend hours finding potential opportunities and writing useful ideas, we would be happy if you support us.
Best regards CobraVanguard.💚
_ _ _ _ __ _ _ _ _ _ _ _ _ _ _ _ _ _ _ _ _ _ _ _ _ _ _ _ _ _ _ _
✅Thank you, and for more ideas, hit ❤️Like❤️ and 🌟Follow🌟!
⚠️Things can change...
The markets are always changing and even with all these signals, the market changes tend to be strong and fast!!

Novo completely oversold🐂 Trade Idea: Long - NOVO
🔥 Account Risk: 20.00%
📈 Recommended Product: Stock
🔍 Entry: +/- 750.00
🐿 DCA: No
😫 Stop-Loss: 675.00
🎯 Take-Profit #1: 1,000.00 (50%)
🎯 Trail Rest: Yes
🚨🚨🚨 Important: Don’t forget to always wait for strong confirmation once possible entry zone is reached. Trade ideas don’t work all the time no matter how good they look. Do not get a victim of FOMO, there is always another trade idea waiting. 🚨🚨🚨
If you like what you see don’t forget to leave a comment 💬 or smash that like ❤️ button!
—
Novo Nordisk is completely oversold (in fear of RFK) and so is the rest of the Pharma sector as well. Nevertheless, Novo is still printing money and trial results for a new product should come in end 24 or beginning 25 for the oral version of the weight loss drug. The fear over political decisions in the US should be used to buy the Pharma sector. For me, it is Novo and Regeneron.
—
Disclaimer & Disclosures pursuant to §34b WpHG
The trades shown here related to stocks, cryptos, commodities, ETFs and funds are always subject to risks. All texts as well as the notes and information do not constitute investment advice or recommendations. They have been taken from publicly available sources to the best of our knowledge and belief. All information provided (all thoughts, forecasts, comments, hints, advice, stop loss, take profit, etc.) are for educational and private entertainment purposes only.
Nevertheless, no liability can be assumed for the correctness in each individual case. Should visitors to this site adopt the content provided as their own or follow any advice given, they act on their own responsibility.

NASDAQ begins possible 15% correction from topNQ has completed a rising wedge complete with the last-gasp over-through. A weekly sweeping reversal is not in place pending Friday's close. This correction might (MIGHT) be uglier than most bulls want to see. Time will tell.

Uptrend & Downtrend Bullish Falling Wedge Pattern TutorialA bullish falling wedge is a charting pattern that signals a potential reversal from a downtrend to an uptrend. Here's a breakdown of its key characteristics:
Shape: The pattern forms a wedge that slopes downward, with the upper trendline connecting the highs and the lower trendline connecting the lows. The key is that the highs and lows get closer together as the pattern develops.
Trend: It typically forms during a downtrend, indicating that selling pressure is decreasing.
Breakout: The pattern is bullish when the price breaks above the upper trendline. This breakout suggests that the downward trend is losing momentum, and an upward trend may follow.
Volume: During the falling wedge formation, volume tends to decrease, which supports the idea that selling pressure is diminishing.
Retest: After the breakout, it's common for the price to retest the upper trendline, and if it holds, it provides further confirmation of the bullish reversal.
Example
Imagine a stock that has been falling for several months. The price forms lower highs and lower lows, creating a narrowing wedge. Suddenly, the price breaks above the upper trendline with increased volume, signaling a potential reversal and the start of an upward trend.

