CHRUSDT LONG IDEACHRUSDT has touched very important support and shown pin bar and entry bar, also formed a wedge pattern. CHR can touch specified targets.
tp1:0.1610
tp2:0.19
tp3:0.2360
tp4:0.34
tp5:0.4863
tp6:0.7
sl:0.1
Wedgepatterns

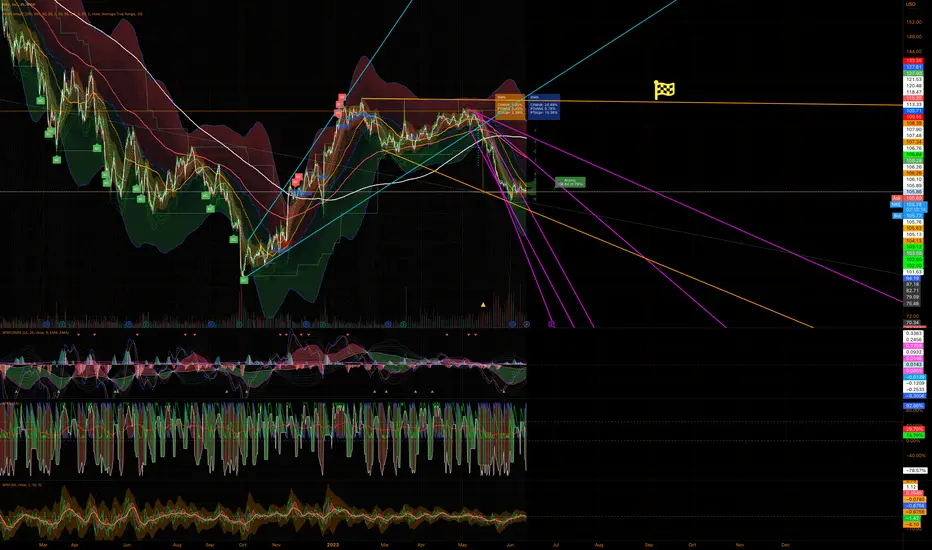
TSM is bottoming here with this wedgeWith this wedge forming with TSM and this trendline as support I think this could be a monster trade. I'm targeting 135 for Wave 3, 115 for Wave 4, and then around 160 for Wave 5.
Some people think this could fill the gap but I don't think so. If you look at TSM and Tesla they look very similar and Tesla didn't fill the gap and stopped halfway just like TSM will do. If it does fill the gap then it would break to the downside of the trendline and then it wouldn't be good.

📉 COMBO/USDT Falling Wedge Setup! 📉📈 #COMBOUSDT is currently showing an intriguing Falling Wedge pattern on the chart, hinting at a potential bullish reversal! 🚀
📉 The price has been forming lower highs and lower lows, shaping the falling wedge pattern. This suggests a period of consolidation and diminishing selling pressure.
🧩 Falling wedges often lead to upward breakouts, indicating a potential trend reversal and the start of a new bullish phase.
💡 Watch closely the resistance and support levels within the wedge to determine the possible breakout direction.
📊 Technical indicators are providing some positive signals for a potential reversal, adding further weight to the bullish scenario.
🔔 Keep an eye out for a breakout above the upper trendline, as it could serve as a signal for the beginning of a bullish trend. Set your profit targets and stop-loss levels accordingly.
📅 Remember to practice sound risk management and trade responsibly. Always conduct thorough research before making any trading decisions.
🚨 Exciting times ahead for #COMBO! 🚨 Let's see how this Falling Wedge unfolds! 🤞
(Note: This post is for informational purposes only and should not be considered as financial advice. Trading carries risks, and past performance is not indicative of future results. Always do your due diligence and seek professional advice if needed.)
#CryptoTrading #TechnicalAnalysis #BullishSetup #TradeSmart #DYOR #CryptoMarket #ChartAnalysis #EmbraceTheWedge #BullishTrend 🚀📈💹

NIFTY to start falling more than S&P500 from next week onwardsNIFTY/SPX chart has hit the upper trendline of ASCENDING WEDGE this week. it had hit the upper trendline 2 TIMES and the lower trendline 3 TIMES till now and has reversed every time since 2020
we can clearly see that whenever the price has reversed from the LOWER TRENDLINE , NIFTY has started performing better than S&P500 and whenever price has reversed from the UPPER TRENDLINE S&P500 has started performing better than NIFTY
Now that the REVERSAL is imminent in the WEDGE pattern and global markets are VERY BEARISH , hence we can expect that the BEAR RALLY of indian market is over and it will become MORE BEARISH than the USA market from the next week onwards
SP:SPX
NSE:NIFTY
Thanks a lot for reading...

Doge bearish Dogeusdt forming a rising wedge pattern (short timeframe) ,which is considere as a bearish pattern, breakdown of pattern can lead to downward movement in doge.
.
.
.
.DYOR

EURCHFEURCHF has formed a falling wedge pattern with strong bullish divergence. As the price has already shown the good bullish reaction from this level. Will the price continue to grow higher ?

IWM - joining the bull party soon?Bull cycles usually start with heavy weight stocks (especially those in technology and discretionary) taking the lead, with small-caps usually joining the party at a later stage and when this happens, the bull run will be a lot more obvious by then.
The IWM (tracking 2000 small-cap stocks) had been stuck in a wide-ranging wedge since hitting a low in June 2022 and with this we experienced huge volatility when we attempted to long these stocks despite that they looked to have bottomed out.
A look at the monthly chart showed that the MACD is about to switch into the positive territory for the IWM, a significant indicator that it's longer-term outlook is starting to look bright(er).
On its daily chart, the 200-day moving average has even begun to exhibit a subtle upslope. Hence, I am hopeful that the IWM will be breaking out of the wedge above 198 in the near future (perhaps within a few weeks if not days).
It is no surprise that more and more of the smaller stocks are beginning to break up, despite that some still experienced a lot of volatility that could be difficult to sit tight. However, having a clearer vision of its longer-term outlook should give some confidence to dip our toes in for stocks with the right technicals and even if we were shaken out, the confidence to retest our entry when the technicals line up again.
Disclaimer: Just my 2 cents and not a trade advice. Kindly do your own due diligence and trade according to your own risk tolerance and don't forget that money management is (probably the most) important! Take care and Good Luck!

📈 $APE Wedge Setup Identified! 📉Hey traders! I've identified a potential wedge setup on NYSE:APE that could present an exciting trading opportunity. Let's dive into the details!
📌 Ticker: NYSE:APE
📌 Wedge Pattern: Identified
📌 Timeframe: 2 day RSI - Wedge Identified
📊 Chart Analysis:
The price action on NYSE:APE has formed a wedge pattern, characterized by converging trendlines. This pattern typically indicates a potential breakout or breakdown in the near future.
📈 Bullish Scenario:
If the price breaks above the upper trendline of the wedge with significant volume, it could signal a bullish breakout. This may lead to a potential upward move in the price, presenting a buying opportunity.
📉 Bearish Scenario:
Conversely, if the price breaks below the lower trendline of the wedge with significant volume, it could indicate a bearish breakdown. This may result in a potential downward move in the price, offering a potential selling opportunity.
💡 TradingView Analysis:
For a more detailed analysis, feel free to check out the chart on TradingView using the following link:
📣 Let's connect and discuss this potential trade setup! Share your thoughts and analysis in the comments below.
🔔 Don't forget to follow for more updates on NYSE:APE and other exciting trading opportunities!
#APE #WedgePattern #Breakout #TradingOpportunity #TechnicalAnalysis #TradingViewAnalysis
Disclaimer: This is not financial advice. Remember to do your own research and consider your risk tolerance before making any trading decisions.
Happy trading, and may the markets be in your favor!
STP - Professor Node It All

📉 Descending Broadening Wedge Spotted on $DOTHey traders! Today, I want to share an exciting chart pattern I've identified on MIL:DOT (Polkadot). Let's explore the descending broadening wedge and its implications for potential price action. 📊💡
Pattern: Descending Broadening Wedge 📉🔽
Symbol: MIL:DOT 💰
Overview:
A descending broadening wedge is a distinct chart pattern characterized by expanding price swings within converging trendlines. This pattern suggests increased volatility and the potential for a reversal. Let's dive into the descending broadening wedge pattern on MIL:DOT and assess its significance. ⚡💹
Key Features of the Descending Broadening Wedge on MIL:DOT :
Expanding Price Swings: Notice the widening price swings within the converging trendlines, creating the broadening pattern. This indicates growing volatility and potential market dynamics shift. 📈📉
Reversal Potential: Descending broadening wedges are often considered as reversal patterns, indicating a possible trend change. It's crucial to monitor price action for confirmation. 🚀📈
Trading Strategy:
Entry Point: Consider entering a position once MIL:DOT breaks out above the upper trendline of the descending broadening wedge. This breakout could signal a potential reversal and the beginning of an upward move. ⬆️💰
Stop-Loss: Implement a stop-loss order below the lower trendline to manage risk and protect against potential downside. ⛔️📉
Target Levels: Identify key resistance levels or previous swing highs as profit targets. Adjust your position size and take profits accordingly. 🎯📈
Risk Management:
Maintain proper risk management techniques, including position sizing, setting stop-loss orders, and adhering to your trading plan. Be aware of the risks associated with trading cryptocurrencies like $DOT. ⚠️💼💡
Disclaimer: Trading cryptocurrencies involves risks, and it's essential to conduct thorough analysis and seek professional advice before making any investment decisions.
#DescendingBroadeningWedge #DOT #Polkadot #Cryptocurrency #TrendReversal #TradingStrategy #TechnicalAnalysis #Volatility #RiskManagement
In conclusion, the descending broadening wedge pattern identified on MIL:DOT indicates a potential reversal in the making. However, it's crucial to wait for a confirmed breakout above the upper trendline before considering any trades. Stay tuned for further updates on $DOT! 💹🚀
(Note: This post is for informational purposes only and should not be considered as financial advice.) 💡💼📚

BPCL is a BUY CMP377 for Targets upto 450This stock is travelling within the Wedge, now its time to reach higher end of the Wedge, once it breaks out of wedge then open blue sky

$SAVE Spirit Airlines Massive Falling wedge SetupSpirit Airlines
Showing a massive trendline from $40 range.
Take profits as we break the wedge up to the $33 area and maybe even back up to $40
-- Long Term Swing Trade setup here
Enjoy!

$PLUG - Long Term Swing Trade - Falling Wedge SetupNASDAQ:PLUG
Wedging since 2021!!!
TPs at each fib level but ultimately swing to ~$48
Push Play Enjoy -- This is charted not in LOG scale

Bullish Falling Wedge Pattern Forming on $UPWKHey Traders! Today, I want to share an exciting technical analysis discovery I made on the stock of Upwork Inc. ( NASDAQ:UPWK ). It seems that a bullish falling wedge pattern is forming, indicating a potential reversal in the near future. Let's dive into the details!
📈 Ticker: NASDAQ:UPWK
📅 Timeframe: Daily Chart
📊 Pattern: Falling Wedge
📉 What is a Falling Wedge?
A falling wedge is a bullish chart pattern characterized by a contracting range between two downward sloping trendlines. It typically forms during a downtrend and signifies a potential bullish reversal. This pattern suggests that the selling pressure is diminishing, and buyers may soon regain control, driving the price higher.
🔍 Identifying the Falling Wedge on NASDAQ:UPWK :
By analyzing the daily chart of NASDAQ:UPWK , we can observe the following:
1️⃣ A clear downtrend in the stock's price over the past few weeks.
2️⃣ Two converging trendlines: The upper trendline connects the lower highs, while the lower trendline connects the lower lows.
3️⃣ Decreasing trading volume as the pattern develops, indicating a decline in selling pressure.
📈 Price Targets and Trading Strategy:
If the falling wedge pattern plays out as anticipated, we can expect a potential bullish breakout above the upper trendline. This breakout could trigger a bullish rally, possibly reaching the following price targets:
1️⃣ Target 1: Resistance level near $40.00
2️⃣ Target 2: Psychological resistance level near $45.00
🛡️ Risk Management:
As with any trading strategy, it is essential to manage risk effectively. Consider implementing the following risk management techniques:
1️⃣ Set a stop-loss order below the lower trendline to protect against unexpected price movements.
2️⃣ Adjust position size according to your risk tolerance and overall portfolio management strategy.
🔔 Conclusion:
Keep an eye on Upwork Inc. ( NASDAQ:UPWK ) as it develops this falling wedge pattern. The formation suggests a potential bullish reversal in the near future. However, remember that technical analysis is not foolproof, and market conditions can change rapidly. Combine this analysis with other relevant factors before making any trading decisions.
Disclaimer: This post is for informational purposes only and should not be considered as financial advice. Always do your own research and consult with a qualified financial professional before making any investment decisions.
Happy Trading! 📈💰
#TechnicalAnalysis #FallingWedgePattern #UPWK #BullishReversal #TradingView

Ready to add $NKENYSE:NKE is ready to rebound (20%), if you want to add to your portafolio, this is the time!
ok NYSE:NKE , just do it!
Previous Pattern Targets vs. Possible Path Back to Top or BottomHBAR made two major wedge patterns that hit pattern targets with incredible accuracy.
First - a bullish wedge exit that led to a 3x measured move up and a final wick up that ultimately stopped approx. halfway between 3.5x and 4x.
Second - a bearish wedge exit that has so far reached a 2x measured move down from where it exited.
Let's see if it makes a 3rd wedge that, when exited in either direction, may revisit weekly top or hit all-time low on a 2x measured move in either scenario; potentially creating a double-top or a double-bottom at its completion.

Power Finance CorporationHello & Welcome to this analysis
It is now approaching a bearish Harmonic ABCD and it that process also forming a rising wedge suggesting some profit taking might come in.
In the short term stock has support at 175-165 and below that near 150 where medium to long term investors would come in. It has resistance around 184-187, if it manages to breach above it then next resistance is near 210.
Overall medium to long term has strong upside potential and could be a strong SIP candidate.
Happy Investing

CAT idea long wedgeWedge formed, looking for some retest of previous levels.
Especially if overall market strength continues to go as it has currently been going.
If it breaks down, I don't see CAT going much lower.

Oil is shaping to a bearish wedge pattern.Hi, I can see a wedge in the Oil 4H time frame. The entry level is between 74.20-74.8. You can set your stop loss at 75.1 and your target for this pattern should be at 71, 70.1 and 69. It's better to wait and watch for price consolidation at the entry point before entering the trade.

AMD WedgeNASDAQ:AMD creating a wedge on the one hour time frame. This indicates that NASDAQ:AMD is going to have a small pull back. When it hits the bottom of the wedge, then that may be another great entry point to enter. From the bottom of the wedge, if it doesn't break out downwards, then it may be the last element needed to push up to the 2 price targets.

ABFRL POSSIBLE WAVE COUNTS - ADITYA BIRLA FASHION AND RETAILHello Friends,
Today I am sharing my view on Aditya Birla Fashion And Retail Limited.
ABFRL is now ready for new long positions as per Elliot Wave structure.
It is suppose to complete WAVE ABC as Expanded Flat Correction which usually comes in 3-3-5 waves.
Now price is in 5th wave of corrective wave ABC which any time get reversal from downtrend to uptrend.
MACD showing strength as price is making lower low but macd makiing higher low
similar Scenario with RSI
confirmation of reversal
One can make new long positions in ABFRL after the breakout of wedge pattern.
Disclaimer
I am not SEBI registered analyst.
all the studies are for educational purposes.
I am not responsible for any kind of your profits and losses.

📈Ethereum fake bullish scenario📉BINANCE:ETHUSDT
COINBASE:ETHUSD
Hey everyone, first take a look at my previous analysis and positions.
Along with the analysis of Bitcoin, Ethereum can also continue its upward trend up to the stop-hunt range if the price stays above the 1854 level.
Consider the impact of the ADP Employment Change & ISM Services PMI & Fed Interest Rate Decision.
5.25% or even lower can pump Btc and Eth.
Please share ideas and leave a comment,1
let me know what's your idea.
CrazyS✌

FINAL WEDGE PATTERN/CADCHFTECHNICAL : as we can see, CADCHF reach a new demand zone and bounce from that level . in my opinion CADCHF makes a final wedge structure !
FUNDAMENTAL : According to financial reports Bot , Unemployment Rate and Inflation Rate of CANADA are improving.
so wait for breakout and then open a long position .

$3K DROP: WAVE V of (V) of ((a)) to target area 27558 - 27330!!!BITCOIN is going down in a corrective (X) wave of sub-millennium degree, and is being divided into waves ((a)),((b)), and ((c)). This WAVE 4 (divided into a WXYXZ correction and please notice the rising wedge) retraced almost 100% of WAVE 3, and now BITCOIN is about to DROP $3k again into a WAVE 5. BITCOIN is heading to a very significant PIVOT POINT which is the end of WAVE 5 of V of (V) of ((a)). Then is UP in a WAVE ((b)) of (X)!!!
