ETHBTC - 2 ETH may soon buy 1 BTCBINANCE:ETHBTC is one of the most hated trades on the market right now. And based on price action from recent months and years - definitely for good reason. Ethereum is being viewed as a stale rust-bucket compared to the superior monetary properties of Bitcoin and the younger exuberance found in Solana. However don’t bet the house on that narrative continuing over the coming months. To me it seems that Ethereum may well have its time to shine once again...
Reasons to be super bullish
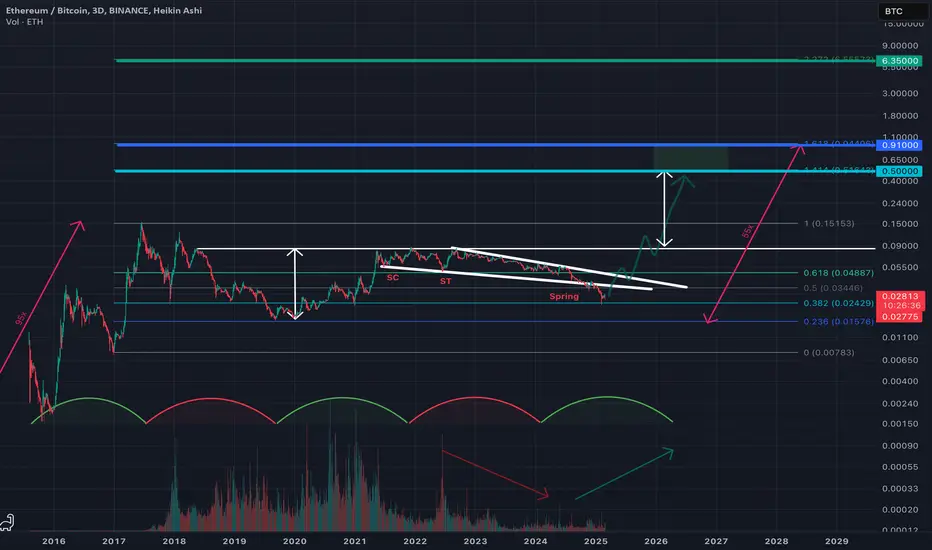
As crazy as it may be to say this, Ethereum can soon reach the rather insane price target of 0.5 BTC per ETH in the coming 18 months.
The pattern for the last 6 years has been one of accumulation, Wycoff Accumulation to be exact. Just look at similarities with an example pattern of GOLD posted from a few years ago, of it similarly being in deep accumulation and the price action that followed.
I’m willing to stick my neck out and say that the Wycoff (coiled) spring from the BINANCE:ETHBTC chart above has now completed, after over-shooting the downwards wedge (in white). Such an overshoot usually leads to the most volatile reversals, and is therefore one of my favorite trading patterns.
Not only that, BINANCE:ETHBTC also has a clean-looking cup & handle pattern forming, dating back to May 2018. Should that come to fruition, the minimum price target (taking the height of the cup via white arrows) would equate to 0.5 BTC. That just so happens to also perfectly coincide with the 1.414 fib level drawn.
Now, would Ethereum stop there? You’ve got to imagine so. However it may not…
BINANCE:ETHBTC 's onset to markets saw a 95x (pink arrow). Taking the same measured move, from the bottom in January 2020, would equate to a 30x move from current levels or a 55x from 2020's bottom. That would indicate a final target of 0.91 BTC, at the 1.618 fib, by around April 2026.
Another reason to suggest the selling is over, RSI is putting in a higher low, whilst price is making a lower low.
BINANCE:ETHBTC is mirroring the same setup as September 2019, with similar targets possible.
Reasons to be sceptical
We should be in a clearly bullish period, between Mar-24 to Apr-26 although we have yet to see bullish price action as of today. BINANCE:ETHBTC already enduring its bearish period from Dec-21 to Feb-24, this is unlikely to be another.
If we’re going to see the above come into fruition, we must soon see a huge uptick in volume in Ethereum in the coming days. Watch the green arrow underneath the chart to see if that happens over the coming 15-18 months.
BINANCE:ETHBTC looks to have already bounced off the 0.024 BTC per ETH. Or the 0.382 fib level (turquoise line). I expect very limited downside from here.
What might trigger a bullish change?
MSTR thanks to Michael Saylor has popularised his company as a quasi-leveraged ETF, turning the balance sheet of his company into a fast-tracked success.
Can you think of another company that is flush with billions of cash that is aligned with defi, NFT & decentralized markets and has one person on the board calling the shots for their investment committee? GameStop could well be the first public company to put Ethereum on their balance sheet and spark a huge step-change in the amount of institutional investment into ETH, over say BTC. They currently have $4.8bn in cash on their balance sheet and have yet to announce any M&A or changes to their corporate treasury.
Watch-out for catalysts, alt-season I sense is coming...
Wedgesfalling
WAVESUSDT is testing the supply zone inside a rising wedgeThe price had a nice breakout from the descending channel on the daily timeframe.
After the breakout the market had another breakout from the static daily resistance with volume on 1.8$ area.
on 4h timeframe the price is testing the supply zone, the 2.5$ area is a key level for WAVES, and now the market is creating a rising wedge.
A rising wedge is a bearish chart pattern consisting of two converging trend lines, with the first line connecting the recent lower highs and higher highs, and a second trend line connecting the recent lows. The resulting shape looks like a triangle that is angled upward. The opposite of a rising wedge pattern is a falling wedge.
What's next?
If the price is going to lose the local support and retest it as new resistance we could see a retracement until the previous daily support on 2$ area

Up Means Down / Down Means Up for BitcoinSuper simple idea here, each time we've been in a rising wedge we've finished it with a move down. Each time we've been in a falling wedge, we've finished with a move up.
The present falling wedge started as a rising wedge and then moved down, now it is a falling wedge, and now I'm expecting correction as we've been in a downtrend for a little over 400 days here.
Support/Reistance Areas:
Support - area in the green box
Resistance - red box
Targets:
TP 1 - appears to want to get to at least 26.6-26.7k, somewhere between the 200 day SMMA and the 200 week MA.
TP 2 - could see 30.2k, somewhere in the middle of our previous bearish wedge, crossing above the 200 day SMMA.
Conclusion:
If both targets are reached, will re-evaluate and publish an updated chart. If we break and close below the falling wedge, idea is invalidated.

DOTUSDT Falling wedge + bullish divergence in many indicatorsI'm deeply in love, don't you know pump it up, you got 2 pump it up.mp3


possible falling triangle wedgewatch the falling wedge for the bullish reversal. 20 SMA ~365. interesting symmetry from the swing high to what now might be the swing low. due own due diligence, not a recommendation either way! large risk profile in this name as ATH is up over 400% year to date.

Gold just keeps on going!This trade has been even better than my 1st targets show. I did not exit this trade still yet. I may though soon as we may be at a top and this trade has made so much money for me. Gold has been very good to me this year. Here is my initial trades ideas I posted too and links below.
initial idea:
change of plan of the idea:
and revalidation of original idea:
This shows that a plan can be altered as condition change, and in the end still end up valid.
Hope you have found this interesting. Please press thumb up in my idea if you like this.
<3 Miss Bunny

it's going to go about 42000$ this weekBe greedy when others are fearful.
No one is worried about the future, especially cryptocurrency ! there is a beautiful pattern ( bullish falling wedge ) ! :-) it's going to go 42000$

TQQQ if you don't short you might be in for an atomic Wedgie!!!Since Sept TQQQ looks like it's formed mini Wedge patterns inside possible Wedge ready to Form. The downside is calling to complete this atomic Wedgie Sandwich!!! Don't be tricked by the long play or the atomic wedgie will hurt!! This is only an incredible idea so please do your own due diligence! Comments welcome!


🐻 Wedges Patterns 🐃Hello, my dear friends! Today we are talking about Wedges Patterns!
Link on a good view👇🏻
Let's start!!!💪🏻
Wedges are some of the main classical figures in technical analysis. There are two types of wedges:
☝🏻 - Rising Wedge pattern - both sides of the figure are directed up;
👇🏻 - Falling Wedge pattern - both sides of the figure are directed down.
✔ A rising wedge pattern is formed when price increases slow and a tapering pattern forms. Price can't go longer rise further, but at the same time, as if they continue to gradually update local highs. That's suggests, that the pressure of sellers (bears) is gradually increasing in the market.
✔ A downward wedge pattern is formed when price decline slows down and a tapering pattern is formed, and volume indicators gradually decrease. Prices are no longer able to decline further, but at the same time, as if they continue to gradually update local lows. That's suggests, that the pressure of buyers (bulls) is gradually increasing in the market.
💡My picture shows, that the “Wedge” directed 👇🏻 down is a bullish 🐃 model, since the trend is up and the price has broken the resistance line (went up).
And the “Wedge” directed up ☝🏻is a bearish 🐻 model, as the trend is directed down and the price has broken through the support line (went down).
📢 These signals are strong and YOU can trade on them.
⚠ But if the price in both cases would go in the opposite direction (the opposite direction to the trend), then this would be a weak signal. Trading in this case is not recommended, as it's too risky. 🙅🏻♀️
🙏🏻Guys, thanks for reading me!🙏🏻
💪🏻Subscribe and stay with me forever🧡
I'm appreciate your likes in support🥰
Your Rocket Bomb🚀💣
PS : 👇🏻👇🏻👇🏻Below I put links on my previous ideas 👇🏻👇🏻👇🏻

TOMO/BTCSTP Crypto Alert 5/22/20 @everyone -- Swing Trade - - - 4hour chart looking bullish - Swing Trade - Falling Wedge
Ticker: TOMO/BTC
Entry: 4150-4250 sats
Take Profits:4350, 4450 ,4550, 4650(.236 fib), 4750, 4850, on up to 6550-> (measured move of the falling wedge) -->11k-12k sats is longer term target of the fib extension!
Stop Loss: 5-7% stop loss however you wish to implement (depends on your entry)
3C Smart Trade Link:
