Weed
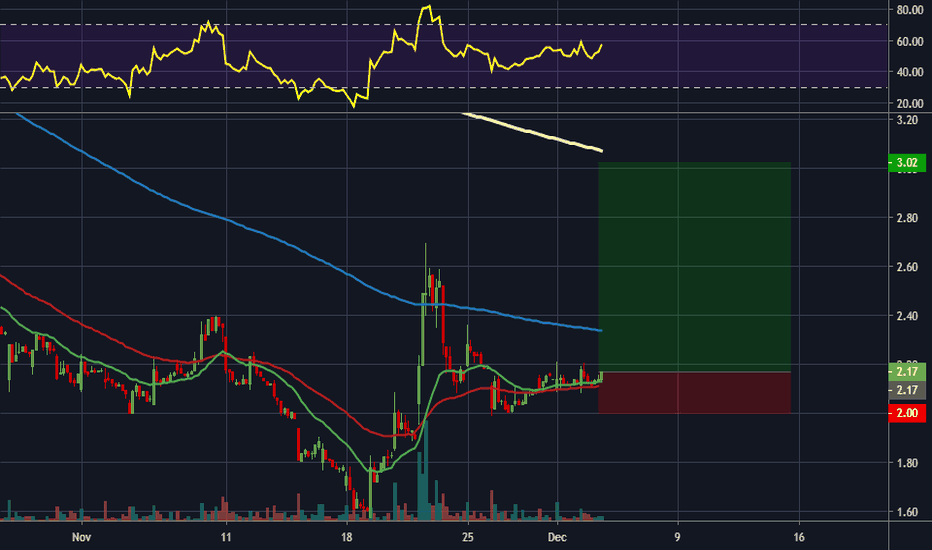
buy point on WEED, Bull Run!?!After a long downtrend on WEED there was a false breakdown out of the channel and a strong move up which saw a price rejection at the red resistance line.
The price has now broken the resistance and just needs to break the 200MA, after this resistance is broken a bull run is very probable. Buy point marked on chart.
Warrants On Sale :)
Here is a breakdown I did of the relative cost of warrants (RCW) in respect to cost of SP (3$ to exercise Warrants)
Shares VS Warrants %RCW
$10.24 $3.51 34.3%
$5.81 $2.76 47.4%
$4.63 $2.34 50.4%
$3.69 $1.71 46%
$2.65 $1.05 39.6%
$0.75 $0.21 28%
Todays Sale Dec 19
$0.74 $0.17 22% (If you're converting S -> W today is one of the best days to do so)
If you analyze this and actually graph it you get a bell curve, this means that when the SP is low or high the relative cost of warrants is low and when the SP is in between ATH & ATL the the relative cost of warrants is much higher.
Do what you do with this data, I already said too much. IMO
Have a freakin gr8 d3y
WeedMD should bounceWeedMD should recover after almost 1year long downtrend, despite drop in sales they are shortly after harvest, I suspect lots of new buds are already in curing, soon ready for sales. On the top of that lfpress.com
This price range looks like great entry for long term position, however short term rapid recovery would be well deserved.
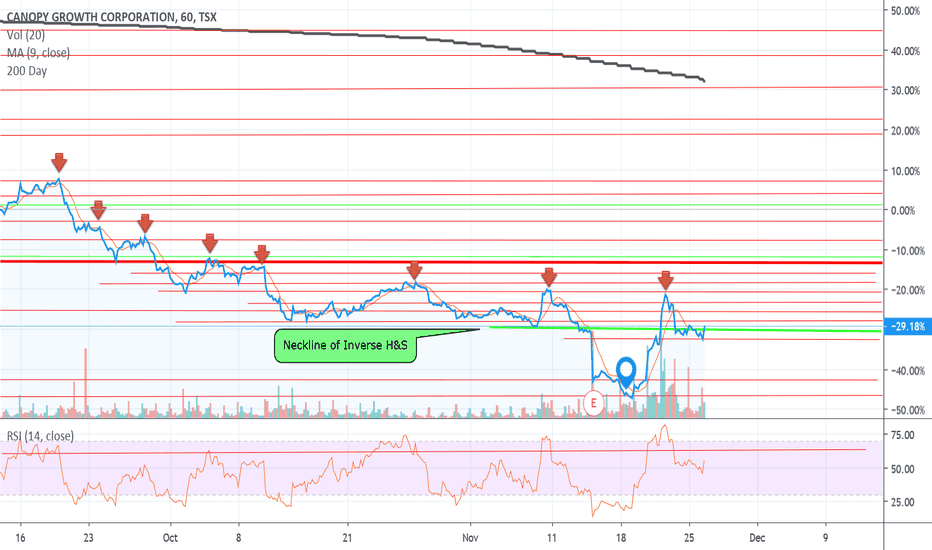
Canopy Growth: inverse head and shoulders on the 4hrThis is a very apparent inverse head and shoulders on the 4hr time frame. The stock has been butchered in the last few months. Seems like since the new CEO announcement, the stock developed this inverse head and shoulder bottom. It's currently sitting right on the neckline. Watch for a breakout on the neckline.
GWPH Long IdeaIm thinking that GWPH goes higher from here. The 8sma is crossing the 13ema. Last time it went higher for weeks. I'll take this BUY here.
LONG HEXO AGAINLooks great for a long position. Not usually a Fib trader but it works out well for this trade.
God Speed,
Mr. Manbearpig
LONG CRONI have been following the weed sector closely as it has a favorable vol indication for someone with my size and have determined that there is a strong probability that we are due for some oversold bounces in this sector. Might be worth throwing in a bet and calculating RR accordingly. Modify as needed according to your risk tolerance and size.
God Speed,
Mr. Manbearpig
Bull Flag or Descending Triangle.Since my post several days ago linked to this chart, you'll notice $WEED is holding the neckline area of the inverse H&S, forming two additional patterns known as a bull flag & descending triangle.
Seeing how the sector has thrown under the bus for the better part of 1 year, I'm expecting to see the Bull Flag play out.. Simply to go against the bearish narrative that's becoming a bit more hysterical by the day..
Time will tell per usual.
AURORA CANNABIS (ACB) | Risky, But Probably Worth It!Hi,
Aurora Cannabis Inc. produces and distributes medical cannabis products.
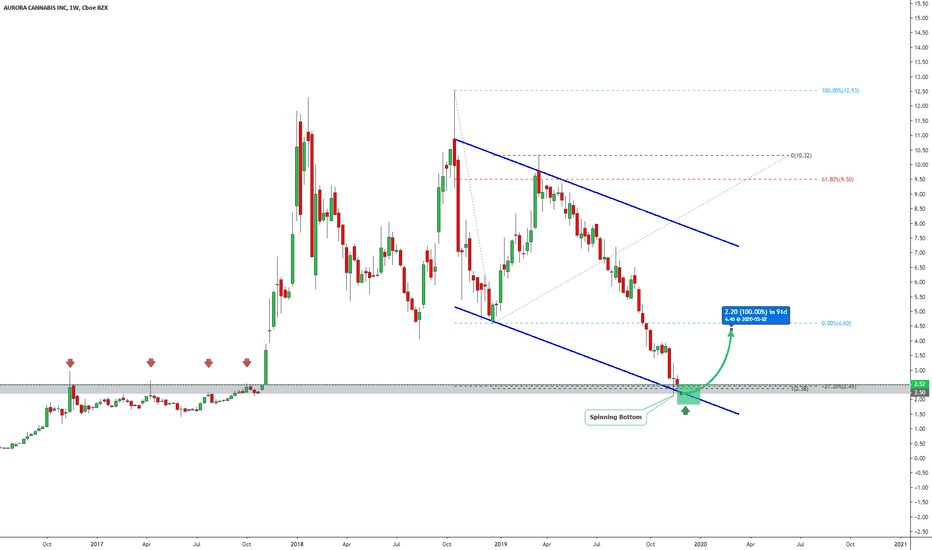
Obviously, it has some mixed fundamentals but technically it may find some buyers around 2.00 - 2.50.
Technical criteria are pretty strong, some of them are a bit subjective but in general, we have a strong crossing area. The green box consists of:
1) 2016 & 2017 high/resistance should start to work as a support level.
2) Actually, it has already started to act as support. In the last week, the price got a rejection upwards from the gray area (2016/17 high) and formed a Spinning Bottom candlestick pattern - bullish candlestick pattern.
3) Now, a bit subjective but still, channel projection worked as a support level and they make up a crossing area with the gray zone.
4) The crossing area becomes even stronger because we have D point exactly inside of it from the pattern called AB=CD
5) Fibonacci Extension 127% should make it (marked bounce area which stays between 2.00 - 2.50) also a bit stronger.
6) The current seasonal "pattern" favors buyers. It means that the end of the year has been pretty profitable for Aurora and the last upwards rally started about a year ago also in December.
Target is up to you but the strongest resistance level stays around the 5.00 and if it reaches there from the current area then it will be 100%+ profit.
Do your own research and please, take a second and support my effort by hitting the "LIKE" button, it is my only FEE from You!
Best regards,
Vaido
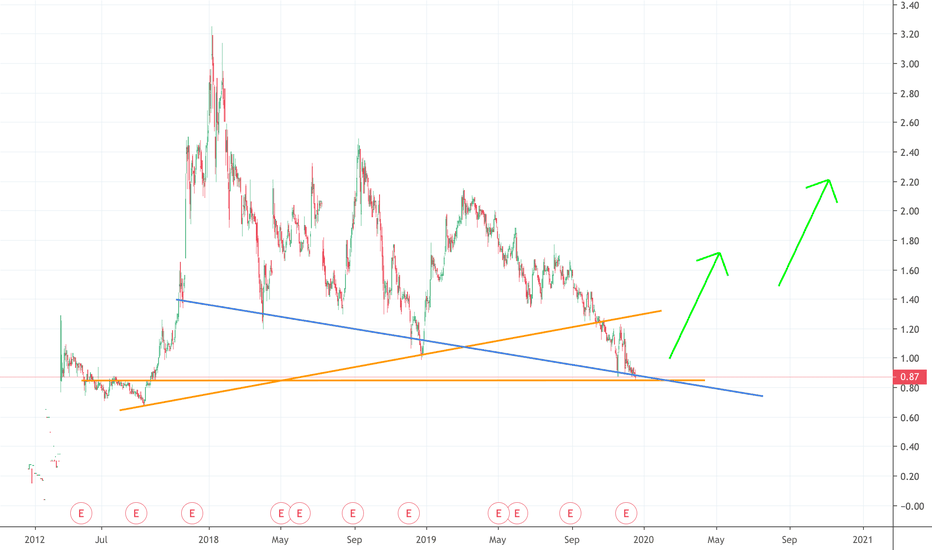
Canopy Growth TSX WEED.TO.. The hype cycle. Weekly with reports.Things have definitely finally hit levels that are in line with a longer term bottoming and possibly the re-confirmation of a base support at these levels of previous highs. If not, things look grim for this entire hype based market.
Wait for the next report? Wake me up in the spring.
Cannabis in Free fallAs we looked at this stock yesterday and shorted into the close. It was almost too obvious it would shoot down with the earnings report release. Now there is very little support going into this last downward leg until we reach 2$.
Capitulation mode is in full effect. didn't think it would happen this soon but investors are giving up on cannabis stocks sooner than I expected (this looks really bad for the overall stock market because cannabis is a perfect demonstration of pack psychology and a good measure of impulsivity in the markets). Time to hold shorts until this makes another BIG flat bottom which is characteristic of most bubbles.
Canopy Growth Corp: Above $21.70 increases the odds of a bottomConsider also, this stock is heavily shorted and earnings could start a short squeeze higher.


