VFF Healthy consolidation. No matter how fundamentally strong VFF Is and how solid their execution is , the overall volatility and psychology of the cannabis markets will effect share price.
Personally I believe VFF to be very well positioned, in a strong position financially and their operational plans are on track for 2018 and 2019.
Short term VFF is in for a tough battle up, overall bulls seem to be exhausted and the bears have been exerting some serious selling pressure both on VFF as an individual stock and the Canadian cannabis market as a whole.
From a technical analysis standpoint VFF has immense potential to retrace back to previous highs and maintain them, this would require the bulls to pick up steam.
I'm looking for industry wide catalysts and also VFF specific catalysts to move this stock. My time frame for the retracement back to $8.50+ is 2 months
Weed
Time to WEED out the bears.So as we can see, there was a nice positive consolidation between the current support and resistance channel, with quite strong buyer volume all day long. This has formed somewhat of a bull flag. There is a good possibility that we will re-test resistance again, however, this is somewhat necessary to confirm the third point for a new possible upward trend line. There was zero green shadow on the closing candle, with high green volume. Tomorrow will probably push above resistance, but as I said, may not close above. If it closes into the 78.6% retrace, we will be inherently safe at 31.00.
Thanks for viewing my charts!
Get on board the XXII express!If XXII fails to break previous resistance level I would get out and cut losses if you are a bull trader...bears might stick around and reap the long term benefits coming up this year. If you are a swing trader such as myself, check for that 3.20 to 3.40 if XXII breaks that previous resistance level and creates a new support by the end of the week.
Cannabis Index: ExpectancyIn terms of the Cannabis index, I expect an around 1250 open in the future. This is due to the rise of weed for medical purposes or recreational usage. Also new laws, large medical marijuana suppliers in Canada, as well as what is going on in Colorado and 4/20 right around the corner are definitely some key growth indicators. For potential, you can say "Roll the Weed" investment wise, however it is quite interesting to see the long term pricing indications of the Cannabis Index.
WEED update, bouncing off of fib. Coming down price action has bounced off of 50% from peak to peak values from the high in the 40s to the low in the 20s. Now looking with strong downward pull from bears. The retrace is almost surely over and this stock will resume its downtrend for now most likely.
How's the WEED?For a brief time we crossed resistance, but retraced and are now keeping in line with the support and resistance channel that has being tested and is currently consolidating. For the time being, the support line has been moved up, although keep an eye out or have a stop loss somewhere just below, maybe ~30.50. This is due to a slightly looming green shadow that was cast earlier this morning. Luckily it never formed a head and shoulders and held support quite nice. Hopefully this consolidation can take us in the right direction.
These WEEDs are out of control!After a brief pullback at the neckline, this Monday is showing up with some serious numbers! The support lines, as well as the downward trend line has moved up as we rocket through resistance, landing right in line with the arrow that I had indicated on the chart before last. When you approach a neck line like the one that we have just crossed, you should always be weary of a little pull back. Flying past 31.00 and almost clearing a whole retrace zone in one day, we approach new resistance, it can be anticipated that we will confirm new support when we close above, for the second time on the 4h chart. This may also be forming a head and shoulders or W pattern, where the top of the head will be will be at the resistance line. If it bounces off the next resistance hard at the 61.8% retrace, it might come down to complete that pattern, landing where the 8 day line touches support. Let's see how tomorrow plays out, if it does like it did today, it shouldn't take much to hit ~36.00.
Thank you for viewing my charts!
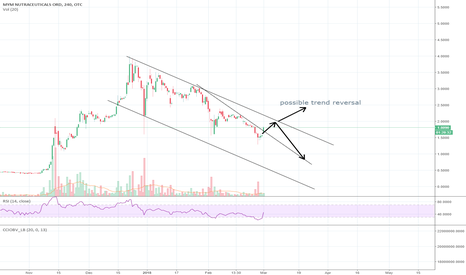
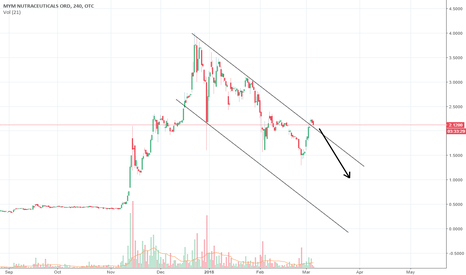
going testing upper trend linewell see if it breaks above falling channel or bounces downward to continue downtrend.
Short term long with high risk. First target looking at 2$. if it breaks above, momentum could carry it a bit further maybe 2.25$ however unlikely since the current bounce that we are experiencing is relatively low volume.
Bounced off resistance unexpectedly.Unfortunately, we didn't even close above the 0.5 re-trace, bouncing off the resistance pretty hard. Generally, closing with no shadow on a that big of a green candle would indicate an increase. There was definitely buyer volume coming in, although not quite as much as 02-05-2018, but we can see that the market opened with a giant shadow at the bottom of the candle. This indicates to me that there was most likely some whales that were waiting at that resistance/re-trace and took profit on that giant spread. I was hoping that something like that wasn't going to be the case. This is why the use of stop loss is vital, and to respect support and resistance. The Bloomberg article published yesterday that essentially called out the valuations of investors, probably didn't aide in new conviction.
I have added a new green trend line to indicate a slightly more sideways channel we are in. It is to early to determine if we are going to see a head and shoulders pattern that could take us above resistance. We are still looking good long. For now, it appears as though we may work our way down to re-test the support area, indicated by where the blue dotted lines intersect the 8 and 13 EMA's.
www.bloomberg.com
Thank you for viewing my charts!
3 perfect drives. resuming downtrend3 nice little waves to retrace huge losses from earlier. Losses happened to fast so we get a nice retrace. trade from earlier netted 28%.
Position now closed as it should bounce off upper trend line and resume the down trend.
After completing a ABC and small rally, we are going lowerAfter completing a ABC correction from its All time High on the daily chart ...and having small rally from there...it looks like the whole market is heading towards at least another correction...
one the ABCDE, once price approaches or even breaches E I would go short on any pop...
TIme frame is hard to tell, but March is looking tough for the stock market as a whole.
March 2-8 may be a key dates
Don't get high on your own supply-Huge news for Tweed getting go ahead on 1.3 M sq ft greenhouses in BC
-Rec. stores in Manitoba
-Speculation of NASDAQ listing
-Increasing bullish volume on the daily chart
-Bullish MACD cross
-Could be a "laggard" to MJN??
-Currently holding WEED overnight and hoping for a significant gap up, causing RSI levels to get to extreme highs on the hourly and shorter timeframe charts. IF this happens, I'll look to sell (likely right at open) and re-buy in (looking for a possible bounce off the $30.00 lvl) using 1/5 min chart RSI indication for an oversold bounce right after exiting. Lets hope this is the start of a very nice break out to, dare I say, all time highs???
Am I seeing things?Wow 9.54%! We absolutely blew past any form of futile resistance that I thought may have held us up a bit, into the 0.5 Fibonacci re-trace zone, waiting for an almost guaranteed close tomorrow to confirm above 29.50. I'm moving the support lines up faster than I can buy. The bulls are in full force with no sign of a flag, and even though I've drawn some measly resistance that we could stagger at, the volume right now is just to massive for me to believe that we will be stopped dead at 31.00. Today closed with essentially no wick, so tomorrow, hopefully we can make it there and past. I haven't seen a breakout like this since "The Shawshank Redemption".
Thank you for viewing my charts!
Heavy resistance. New support.There is still some seriously heavy resistance that we will have to face, considering it just barely cleared above the previous, with a long green wick although. I have moved the upward trend line to reflect the newly created likely support area, indicated by the green dashed line. If we can confirm a second retest above the current dashed red resistance line, the blue support can then be moved up along with it, and new resistance will be placed at ~28.75 and 29.70. I still do believe that unless the volume comes in, it will be a struggle to break past the point where the 8 and 13 lines cross the current resistance level at 28.0. If it does go up and bounce around in that resistance channel again, it could be forming the beginning of a left shoulder of head and shoulders pattern that can hopefully break us out of the .5 Fib. retrace.
Thank you for viewing my charts!
Cronos breaking through channel MJN breaking through falling channel after being added to the Nasdaq.
Good chance to continue upward trend. Look for pullback entry point
might test top of wedgeA few factors lead me to believe this stock might make a short term reversal.
First, RSI showing that bear strength is getting weaker. Additionally it seems to have formed a very short term double bottom (can be observed better in a short term timeline graph). On top of this price action could bounce off of 24% fib.
The trading range is decreasing as the wedge is getting more narrow, i wouldn't be surprised if the price action were to test the upper limits of the wedge if not break it altogether.
Well have to see how this develops till the end of the week
Consolidation station.It is looking it will consolidate for quite some time, however, they have just acquired the license for a facility in Aldergrove B.C. It will be interesting to see if it remains bearish during the primary phases of that operation. There's an indication it might retrace the .236 Fibonacci, where it intersects the upward trend line at this point, because support has already been established twice there. Hopefully it bounces off and keeps going in the right direction.


