Weekly $SPY / $SPX Scenarios for July 14–18, 2025🔮 Weekly AMEX:SPY / SP:SPX Scenarios for July 14–18, 2025 🔮
🌍 Market-Moving News 🌍
⚖️ Powell Faces ‘Epic’ Trade‑Inflation Dilemma
Former Fed economists warn Chair Powell is navigating nearly unprecedented terrain: tariffs are pushing up prices even as the labor market cools. Striking a balance between inflation control and growth support remains a formidable challenge
📊 Tariff‑Driven Inflation May Peak This Week
June’s CPI is expected to show a 0.3% month-on-month increase, potentially lifting core inflation to ~2.7%—its highest level in 18 months. These data will heavily influence the Fed’s decision-making process
🏦 Big Bank Earnings Kick Off
Earnings season begins with JPMorgan ( NYSE:JPM ), Goldman Sachs ( NYSE:GS ), Wells Fargo ( NYSE:WFC ), and Citigroup ($C) reporting. Strong results could offset trade and inflation anxieties; expect volatility in financials
📈 Goldman Sees Broader S&P Rally
Goldman Sachs projects the S&P 500 to climb roughly 11% to 6,900 by mid‑2026, underpinned by firm earnings and expected Fed rate cuts. But warns that breadth remains narrow, increasing downside risk without robust participation
⚠️ Summer Volatility Risk Lingers
Deutsche Bank warns that summer’s low liquidity and the looming Aug 1 tariff re‑imposition deadline may spark sudden market turbulence—even amid bullish sentiment
📊 Key Data Releases & Events 📊
📅 Monday, July 14
Quiet start—markets digest back-to-back CPI, tariffs, and clearing post‑earnings.
📅 Tuesday, July 15
8:30 AM ET – Consumer Price Index (June)
Watch for potential tariff impact in CPI; core inflation data are crucial.
8:30 AM ET – Core CPI (June)
10:00 AM ET – Empire State Manufacturing Survey (July)
Early view on Northeast factory trends.
📅 Wednesday, July 16
8:30 AM ET – Producer Price Index (June)
Wholesale inflation signals to validate CPI trends.
10:00 AM ET – Housing Starts & Building Permits (June)
📅 Thursday, July 17
8:30 AM ET – Initial & Continuing Jobless Claims
A gauge on labor-market resilience amid talks of cooling.
📅 Friday, July 18
10:00 AM ET – Federal Reserve Beige Book Release
Fed’s regional economic snapshot ahead of next FOMC.
⚠️ Disclaimer:
This is for educational/informational use only—not financial advice. Consult a licensed professional before investing.
📌 #trading #stockmarket #economy #tariffs #inflation #earnings #Fed #CPI #technicalanalysis
Week

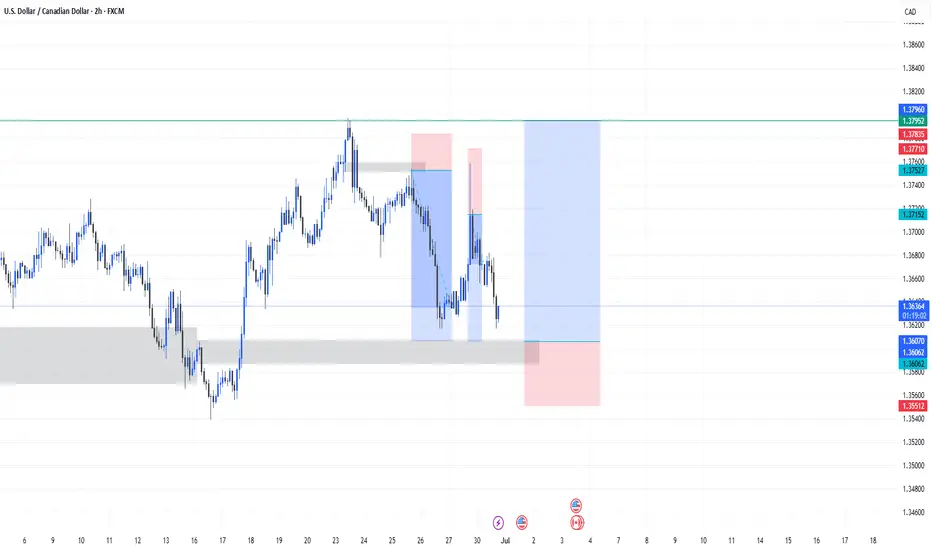
USDCAD long trade setup for this week📈 USDCAD Long Setup Idea – Weekly Play 💯
Here’s a clean bullish setup on USDCAD (2H timeframe) I’m eyeing for this week:
🔹 Key Zones:
- Demand Zone: Strong reaction from the 1.35500–1.36000 area, with price respecting this grey support block multiple times.
- Supply Flip: Previous structure zone turned potential demand.
🔹 Entry:
- Long position placed after liquidity grab and bullish rejection within the demand zone.
- Market structure is beginning to shift bullish after consecutive lower highs and lows broke.
🔹 Risk Management:
- SL below the demand zone at ~1.35512
- TP set near previous high around 1.37960 (resistance zone)
🔹 RRR (Risk to Reward Ratio):
- Solid risk/reward potential on this play – targeting a 3R move if momentum holds.
🔹 Trade Bias:
- Looking for a deeper retracement continuation up, aligning with possible DXY pullback.
- Watching for confirmations like bullish engulfing or structure break for entry trigger.
📊 Stay patient, follow price action, and manage risk properly.
(BTC) bitcoin "history"bitcoin compared to the 9 weeks down of jasmy. The last time Bitcoin went down for 9 weeks straight was during April-May 2022.

3 spots for a Buy before vertical $ORGOBuys were called for $5.11, $5.21 and $5.51 after long consolidation at $5 area.
It started moving up nicely into last 2 hours of the day, triggering stronger volume once above $5.50 and ramping into $6.75 after hours.
TOTAL Week: +60.8% per traded position
Monday: +12.9%
Tuesday: +17.0%
Wednesday: +9.5%
Thursday: +12.2%
Friday: +9.2%
12 trades on NASDAQ:NVVE NASDAQ:TRNR NASDAQ:MLGO NASDAQ:ESGL NASDAQ:BCG NASDAQ:ONVO AMEX:ATCH NASDAQ:STEC
10 wins
2 losses
TOTAL February: +397.7%
Slow and quiet last week of the February but still solid profit made. Looking for more explosive action next week to return with start of a new month. Wouldn't mind something like last week (+200% banger!)
Congrats on Feb gains and see you all on Monday morning, enjoy the weekend!

Euro / Dollar long week. Market Maker buy modelAnd so, we see that there was a reaction from the weekly FVG that was created back in 2022. Liquidity was not removed and early lows have been created (this may be for the next invasion and filling of the inefficiency of the FVG) So far we see support on the 4H BISI that was created from the weekly BISI, it was Friday, New York (which is good for a reversal for the model) All 4H SIBI hourly inefficiencies are filled and respect 0.5 quadrant
The wicks are causing damage, the bodies are telling the truth. While the nearest liquidity is formed on the weekly sibi, which is the initial model of the market maker for buying to this level. Let's see what candles will be formed.
+ we see on DXY touch Month Sibi High. its good for long forex market
+ candle formed Discount area

XAUUSD SHOW BULLISH CHARTLet it show bullish move in smaller time frame bigger time frame still breakdown and retesting closing below this range and next week opening will be red
personally not in any trade right now..

For Week 2023/11/20-24, A slight bearish move for XAUUSDConsidering the relatively muted weekend activity and the ongoing weakening of the USD, it's reasonable to anticipate a slight bearish correction for XAUUSD in the coming week. The absence of a significant weekend push and the prevailing market conditions suggest the potential for downward movement. However, it is essential to closely monitor any shifts in global factors, market sentiment, and economic indicators, as these could influence the trajectory of XAUUSD.

nzd/chf Week's LOW
Last week's low was not breached! However, it bounced back impressively! The previous week's high is quite far, almost halfway for potential trading! Let's use a tight stop because we are anticipating a bounce from the weekly low! It attempted several times to break below but couldn't sustain, and it bounced back nicely! Let's see if it will go higher!

USOIL - LONG - WEEKLY ANALYSISThe "USOIL" has been in a downtrend since May - 2022 and it stands to reason that we will start to see a bottoming soon if necessary.
In today's post, I will analyze in more detail at which key areas we can expect a bottoming.
- For this, we will look at the "USOIL" from the weekly view and integrate elements of the daily, weekly and monthly charts.
In the following, I will go into more detail about the individual areas and break them down in an understandable way:
1. | FIBONACCI RETRACEMENT |
For this Fibonacci retracement we take the movement,
which started in - December/2021 - and ended in - March/2022 -.
-> 0.786 FIB = 76.79 USD | Successfully processed
-> 0.88 FIB = 70.50 USD | Pending retracement
> As "BLUE" lines + area - drawn in the chart.
2. | FIBONACCI RETRACEMENT |
For this Fibonacci retracement we take the movement,
which started in - November/2021 - and ended in - March/2022 -.
-> 0.618 FIB = 70.25 USD | Pending retracement
-> 0.65 FIB = 67.18 USD | Pending retracement
> As "ORANGE" lines + area - drawn in the chart.
3. | DEMAND ZONES |
The demand zones formed at the beginning of the upward movement,
so they were created and in - November-December/2022.
-> MONTH ZONE = 62.46 - 77.41 USD | Pending settlement
-> WEEK ZONE = 62,46 - 72,97 USD | Outstanding settlement
-> DAY ZONE = 66,24 - 70,42 USD | Pending execution
> As "GREY" areas - drawn in the chart.
4. | POINT OF INTEREST
The point of psychological interest,
was created the first time in - August/2005 - and showed some reactions since then.
-> POI = 70.00 USD | Pending settlement
| In the upcoming situation, the POI should be used as a support.
| POI is used as ZONE -> no point exact support.
> As "TURKIS" line - drawn in the chart.
NOTE
-> Psychological numbers are relevant decision points, because the human brain (subconsciously) prefers round numbers.
-> For this reason, a lot of interest (orders) accumulates at these points, which serve as required liquidity for institutions.
4. | CONCLUSION
How the detailed scenario for "USOIL" could look like, cannot be guessed at the moment, so we have to postpone the more detailed consideration to the future.
Despite this, the key points I have presented, will most likely trigger a reaction.
-> As soon as we reach the areas, I will upload a detailed execution.
Feel free to discuss it in the comments and share our perspectives, I would be "burning" to hear your take on it all.
Thanks a lot and happy trading!

NZDCHF ShortNzdchf from approaching Daily Resistance level.
expecting a sell down to continue the bearish Trend

US30 TRADE IDEAUS30 closed last week at +0.20%. US30 had a strong sell out before pulling back up. US30 should continue in a bullish trend at the opening of the market.

AUDUSD bias 12th febAs shown in our markup, we've tapped into a supply on the daily time frame. After tapping into this supply, we've broken the structure to the downside on a four-hour basis.
This leads me to believe that coming this week we may see further downside for the Australian to U.S. dollar.
We have the CPI news this week, as well as a couple of other news events, These could be the catalyst to push this pair further to the downside.
We will be looking on a smaller time frame for possible entries lower... As always, we will monitor this to see if any entries are given, but as an overall bias we are expecting bearish movements for this pair.

SPY weekly Review 01/30/2023 - All timeframes, & AM routineIn this Video I do a quick analysis of the current condition of markets based on the SP500 proxy index the SPY. I also go through a few weekly data points as I am hoping to publish this every Monday to summarize the week head, and behind. This video is a bit long as I go through all my tools and routines, plus we have a very hectic week this week with FOMC, Earnings, Jobs, PMI, and much more. Inflation data on the horizon also (PCE Index which the FOMC cares most about, not PCI).

USD/CAD - SHORT SCENARIOS - ANALYSE – WThe "USDCAD" is in an uptrend since May – 2021, and it stands to reason that we can expect a top soon if necessary.
-> The USD is the base currency of the pair and should, shortly, enter a correction.
-> At which key areas we can expect a Local Top, I will analyze in more detail in today's post.
-> For this, we will look at the "USDCAD" from the weekly view and integrate elements of the daily, weekly and monthly charts.
table of contents
- 1st part = EXPLANATION - Used indicators + levels
- 2nd part = SCENARIOS - pro + con breakdown
- 3rd part = CONCLUSION
FIRST PART
1. | FIBONACCI RETRACEMENT |
For this Fibonacci retracement, we take the movement,
which started in - March/2020 - and ended in - May/2021 -.
-> 0.75 FIB = 1.40031 points | Pending processing
-> 0.786 FIB = 1.40989 points | Pending processing
-> 0.88 FIB = 1.43491 points | Pending processing
> As "BLUE" lines - drawn in the chart.
2. | FIBONACCI RETRACEMENT |
For this Fibonacci retracement, we take the move,
which started in - July/2022 - and ended in - August/2022 -.
-> 2.618 FIB = 1.40258 points | Pending processing
> As "PASTELL ORANGE" lines - drawn in the chart.
3. | SUPPLY ZONES |
The supply zones formed at the beginning of the downward movement,
thus they were created and in - March-May/2020.
-> MONTH ZONE = 1.38502 - 1.46685 points | Pending processing
-> WEEK ZONE = 1.38502 - 1.41409 points | Pending processing
-> DAY ZONE | 1 | = 1.39686- 1.40488 points | Pending processing
-> DAY ZONE | 2 | = 1,43750- 1,46685 points | Pending processing
> As "GREY" areas - drawn in the chart.
4. | POINT OF INTEREST |
The points of psychological interest,
were created the first time - in 2003 - and showed some reactions since then.
-> POI | 1 | = 1.38500 points | Pending processing
-> POI | 2 | = 1,40000 points | Pending processing
-> POI | 3 | = 1.41000 points | Pending processing
-> POI | 4 | = 1,46500 points | Pending processing
| POI should be used as resistance in the upcoming situation.
| POI is used as ZONE -> no point exact resistance.
> As "TURKIS" line - drawn in the chart.
5. | VOLUME PROFILE |
The volume profile describes the cumulative trading volume at each price level. In the analysis, the volume of the last "TOP" formation was analyzed.
-> VOLUME ZONE = 1.40100 - 1.41100 points | Pending processing
-> POC = 1.40500 - 1.40700 points | Pending processing
| Point of Control - The price level with the highest traded volume.
5. | OLD MARKET STRUCTURE BREAK |
The old market structure break, represents a psychological level because it was the decisive point in the last corrective move.
| MSB = 1.38502 points | Pending processing
PART TWO
Once the price reaches the broken down levels, we can expect a reaction from the market, which depends on the "weighting" of each level.
PLEASE NOTE - the USD is the base currency of the USD/CAD, so we are 100% dependent on the performance of the DXY.
1. | SCENARIO | TOP - at approx. 1.38500 points (Unlikely)
What speaks for this?
- "OLD MARKET STRUCTURE BREAK"
- "SUPPLY ZONES | W1 + M1"
- "POI (1)
+ this idea must be supported by the DXY!
What is against it?
- "VOLUME PROFILE" = little traded volume.
- "FIBONACCI" = between 0.618 - 0.75 FIB
- "USD (DXY)" = further appreciation.
2nd | SCENARIO | TOP - at approx. 1.40000 - 1.41000 points (Very likely)
What speaks in favor of this?
- "FIBONACCI RETRACEMENT (1) | 0.75 + 0.786 FIB"
- "FIBONACCI RETRACEMENT (2) | 2.618 FIB"
- "SUPPLY ZONES | W1 + M1 + D1 (1)"
- "POINT OF INTEREST (2) + (3)
- "VOLUME ZONE
- "POC
+ this idea must be supported by the DXY!
What is the argument against it?
- "FIBONACCI" = 0.88 FIB
- "SUPPLY ZONE" = D1 (2) liquidity
- "USD (DXY)" = further appreciation.
3. | SCENARIO | TOP - at approx. 1.43500 points (Unlikely)
What speaks in favor of this?
- "FIBONACCI RETRACEMENT (1) | 0.88 FIB"
- "SUPPLY ZONES | D1 (2)"
+ this idea must be supported by the DXY!
What is the argument against it?
- "USD (DXY)" = further appreciation.
CONCLUSION
It is impossible to say at this time what the exact scenario for "USDCAD" will be.
= Despite this, the key points I have presented, will most likely trigger a reaction.
-> As soon as the TOP formation emerges, I will upload a detailed SHORT execution.
-> Feel free to discuss it in the comments and share our perspectives, I'd be "burning" to hear your take on the whole thing.
If this idea and explanation has added value to you, I would be very happy to receive a review.
Thank you and happy trading!

S&P 500 ideas for next week.S&P possible scnario: S&P will bounce somewhere around here downside. making hidden bearish divergence and stops around 3 900 support area that there will be potential reversal zone. I am monitoring other markets on weekend and seems correction is needed. When it will bounce from 3900 will make inverted head and shoulders.

BANKNIFTY NEXT WEEKL 1st AUGUST, ELLIOT WAVE & TREND ANALYSIS Price almost traded in between 37200....38000 for 4 days as we expected last week. if price immediately breaks 3800 level on monday price can move above 388000 level in next 5 days trading sessions. But friday we saw price rejection from upper levels , so i am expecting a small correction of price till 0.38 of fib level.
If we analyse according to Elliot wave theory , currently price is in third wave , if price breaks 37100 support , we can expect little correction till 36200 in next trading sessions.

NIFTY 1st AUGUST WEEKLY ANALYSIS NIFTY has broken channel and is trading in major supply & demand area . Trend can be unpredictable until price breaks resistance area of 17400 . Earlier price took 2 weeks to break the zone , retracement is also possible from this zone. So be cautious and trade with less quantity .

About last weekHello guys,
last week was unprofitable.
About trade assessment:
NZDCAD; Sl, -2%, market just hit sl, and after going on to the my assumption.
AUDCAD; SL, -2%, bad idea, the market has turned, i thinking the market going to the trend, because daily trend is really strong.
NZDCHF; SL, -2%, trade which i did not share. Entry trade to opposite daily trend. (mistake)
EURAUD; TP, 2%, sell stop after, break and retest strong support, and helper is daily downtrend.
Thanks guys
Jindrich

CAN NIFTY MAKE POSITIVE MOVE NEXT WEEK if NIFTY breaks immediate resistance at 16900 level then it will trade in previous buyers and sellers area which lasted 2 week previous time, and it will also be trading near regression channel resistance area for third time, from 16900 to 17500 price will be voilatile it is better we trade nifty half the quantity lots what we used to trade reguarly .

eurgbp analysisexpecting a continues rise for pair, at this point we expect to only buy that will be more profiting

Bitcoin Macro Outlook (Regression, SMA)Long-term price analysis using Log regression bands, 50-Month SMA, 300 Week SMA, and 10 year Fibonacci levels


EURUSD Forecast – Wait for a Breakout Previous EURUSD forecast talked about price making a retrace to $1.06736 and the price retraced, but only to $1.06410.
Thing is that the price is now in the indecision area where we need to wait for a breakout.
Next week we need to wait for the price to break out from this range.
$1.05825 is the first target for the bulls that must be broken and retested to verify the breakout.
