EURUSD: Weekly Forecast 16th January 2022EURUSD has broken above a 7-month falling trendline, opening the door for more buyers.
However, the bigger picture shows a clear downtrend and the recent increase in the price could be just another major pullback.
Resistance was also seen at the supply level of 1.1450, causing EURUSD to give up over 70 pips before the week ends.
Nevertheless, a direction needs to be picked and we will follow the recent bullish trend and look for buying opportunities as the price pulls back a little more or finds support at the demand level 1.1370.
Weeklyanalysis

EURUSD - LONG TERM VIEWFX:EURUSD is currently trading in a range on weekly and daily basis.
The crucial resistance level is 1.14246.
The next two crucial levels are 1.15924 and 1.17006.
If the trend line and the range breaks, these crucial levels are the next to reach .
The forecast line is being followed from 2016, at 2020, we have seen a big volume when the price reached near to this line again.
Trade Details :
Trade Active: When range, trendline breaks
Entry at or below = 1.14246
Stop Loss = 1.11679 , or the Red Forecast Line
Target 1: 1.15924
Target 2: 1.17006
Trading period: 5-6 weeks or longer
Take your trade only after doing your own analysis and plans.
Happy Trading :)


WTI: Weekly Forecast 9th January 2022WTI continued to rise sharply last week and is becomingly clear it has resumed a strong bullish trend.
However, we will still continue to observe resistance at supply level 79.9 to 81.3 as it may still provide strong selling.
This week, we will wait for a pullback towards 77.3 to look for a buying opportunity.

Gold: Weekly Forecast 9th January 2022Gold came down again after a month-long of upward consolidation but found support at demand level 1787.
The trend is currently still ranging and the price is now trading right in the middle of the entire symmetrical triangle.
This week, we will observe for further support at the demand level 1787 and look for buying opportunity if it holds.
Otherwise, the price could break down and go lower towards the 1767 demand level and we can look for buying opportunities again at the bottom of the symmetrical triangle.

GBPUSD: Weekly Forecast 9th January 2022GBPUSD gained further last week and will be retesting the 7-month falling trendline very soon.
The price is already trading deep into the supply level at 1.3562, alongside with the golden ratio and thus a sudden reversal could take place anytime soon.
This week, we will attempt to sell as the price continues to climb higher with 1.3600 as the key level.

EURUSD: Weekly Forecast 9th January 2022EURUSD dived over 100 pips on the first trading day, found support at 1.1286 throughout the week, and made a comeback on the last trading day.
The price is still trading within a consolidation pattern and a retest of the supply level at 1.1383 is highly expected.
This week, we will wait for the retest at 1.1383 and towards the 7-month falling trendline to look for a selling opportunity.

XRP it's look bearish!!!In weekly timeframe. I look XRP extremely bearish where this cryptocurrency can to hold EMA 200 around level $0.54 cents.
Maybe, it's a good opportunity to buy more XRP more cheap and good discount to accumulate more.

WTI: Weekly Forecast 2nd January 2022WTI found resistance at 77 after another rally at the beginning of the week.
While the oil prices have been on the rise through December, it is becomingly obvious that this is part of a pullback for the bearish trend that formed through November previously.
The price has also came down on the last trading day which did cause some breakdown of its current bullish structure.
This week, we will be waiting to sell the pullback from 76.20 onwards, aiming for 73.
P.S. Give a thumbs up if you like our idea:)
Do follow us as we will be providing daily trading ideas as a continuation to our weekly forecast. Cheers!

Gold: Weekly Forecast 2nd January 2022Gold rose for the 3rd week since it took off from the demand level at 1768.
As the price reaches a key resistance at 1829, little resistance is seen and thus could extend the rally going into the coming week.
The gold is expected to continue rising through the vacuumed area from the current 1829 to the key supply level at 1850.
This week, we will wait for a pullback towards 1818 to buy again and aim for the top of the entire symmetrical triangle, as well as the key supply level at 1850.
However, we also see a good chance of pulling deeper towards 1805 should the current trend continues to follow its whippy structure.
P.S. Give a thumbs up if you like our idea:)
Do follow us as we will be providing daily trading ideas as a continuation to our weekly forecast. Cheers!

GBPUSD: Weekly Forecast 2nd January 2022GBPUSD stayed very bullish for the 2nd week since the BOE started raising rates.
There's no doubt that the pound can continue to climb higher but will face strong resistance as it approaches a major supply level at 1.3560.
The supply level also sits well at the top of a 6-month falling channel, together with the golden ratio.
This week, we will wait for a pullback towards 1.3500 for an intraday buy and look out for strong resistance from 1.3560 onwards.
P.S. Give a thumbs up if you like our idea:)
Do follow us as we will be providing daily trading ideas as a continuation to our weekly forecast. Cheers!

EURUSD: Weekly Forecast 2nd January 2022EURUSD has been squeezing out more bulls and managed to stand above an one and a half-month consolidation.
While the overall trend is still clearly bearish, there's just about enough gap between the current price and the supply zone at 1.1440 for another couple of bullish run in the intraday.
Therefore, we will wait for a pullback towards 1.1350 for an intraday buy in the coming week while looking out for a strong reversal as it approaches 1.1440 right at the top of a 7-month falling channel.
P.S. Give a thumbs up if you like our idea:) Do follow us as we will be providing daily trading ideas as a continuation to our weekly forecast. Cheers!

Weekly market analysis with gainers, losers and my viewI talk about how the major indices are placed on a weekly level and discuss the top performers and top losers of last week. Curious to hear your thoughts as well!

Bazaar Ki Baatein: What lies ahead for Nifty and the Indian mktsWeekly analysis of Nifty, Banknifty and the top gainers & losers among FNO stocks.

$F - Walking up the ChannelFord has been an awesome name to trade recently.
You can consistently enter a trade when we're at the bottom of the trade, and wait to catch a rip to the top.
Even on a volatile day like today, we were safely given an opportunity to enter the channel and ride it back up to the top.
I'll be looking to exit my position around 21.2!

Forex Forecast: Pairs in FocusWhen starting the trading week, it is a good idea to look at the big picture of what is developing in the market as a whole and how such developments and affected by macro fundamentals and market sentiment. There are a few long-term trends beginning to reassert themselves, so it can be a profitable time to trade the markets.
Big Picture 12th December 2021
Last week’s Forex market was very quiet leading up to Friday’s release of US inflation data, which was expected to be the key driver of market movements for the week. However, the data arrived almost completely in line with the consensus forecast, and the market did not react very strongly to it. This meant the week ended quietly with low price volatility.
Despite the long-term bullish US dollar trend, the greenback fell a little over the course of the week, and it also fell after the US inflation data were released. The inflation data showed that annualized US inflation is now increasing at a rate of 6.8%, the highest seen since 1982. However, the pace of the increase lessened, with the recent month’s increase coming in at only 0.8% compared to 0.9% in the previous month. It might be that the slight reduction in the pace of the increase is seen as significant enough to prevent more panic over inflation.
Risk sentiment improved over the week, with most stock markets higher and the benchmark US S&P 500 Index rising to approach its all-time high price. Most global stock markets rose over the week, as did the Australian and Canadian dollars which are commodity currencies and key risk barometers. The improvement in risk sentiment globally is probably mostly because there is an increasing feeling that the omicron coronavirus variant will not turn out to be as economically destructive as had been initially feared. Safe-haven currencies such as the Japanese yen, the Swiss franc, and the US dollar are all lower.
The precious metal silver fell to a new 50-day low price after falling quite strongly for several days. It bounced back a little on Friday but remains quite close to 1-year lows. Trend traders may be interested in going short on Silver.
I wrote in my previous piece last week that the best trades for the week were likely to be short of AUD/USD and NZD/USD, following daily (New York closes) at new lows. Fortunately, neither of these currency pairs made a new low at the end of any day during the week, so this was sufficient to stay out of what would have been losing trades.
Fundamental Analysis & Market Sentiment
The headline takeaways from last week were:
US CPI (inflation) data came in very slightly higher than had been expected and is now increasing at an annualized rate of 6.8%, the highest seen in 39 years. However, the pace of the monthly increase slowed slightly from 0.9% to 0.8%. Markets reacted little during the rest of Friday’s session.
A coronavirus variant of concern, named the omicron variant, has continued to spread around the world. The variant is heavily mutated, and latest studies suggest that it has a strong capacity to evade current vaccines. However, latest studies suggest that a maximal course of vaccination will still offer strong protection against severe disease.
The Reserve Banks of Australia and Canada held their respective interest rates and monetary policies steady in their monthly policy releases during the week. This probably had little impact on either currency, both of which rose firmly.
The coming week is likely to see a higher amount of volatility due to the busy economic calendar, with direction likely to be determined partly by the upcoming FOMC release and partly by how dangerous the omicron variant is shown to be as more tests are performed on it. The coming week’s major scheduled economic releases will be:
FOMC statement, federal funds rate, and economic projections.
Monthly policy releases from the European Central Bank, the Bank of England, and the Swiss National Bank.
British and Canadian CPI (inflation) data.
New Zealand GDP data.
US retail sales and PPI data.
German manufacturing and services PMI data.
Australian employment data.
Last week saw the global number of confirmed new coronavirus cases fall for the first time in seven weeks. Approximately 56% of the global population has now received at least one vaccination. Pharmaceutical industry analysts now expect a large majority of the world’s population will receive a vaccine by mid-2022.
The omicron variant has been confirmed as present in fifty-seven countries.
The strongest growths in new confirmed coronavirus cases overall right now are happening in Denmark, Finland, France, Italy, Jordan, South Korea, Laos, Luxembourg, Mali, Nigeria, Norway, Poland, Portugal, San Marino, South Africa, Sweden, Switzerland, Trinidad, and the UK.
Technical Analysis
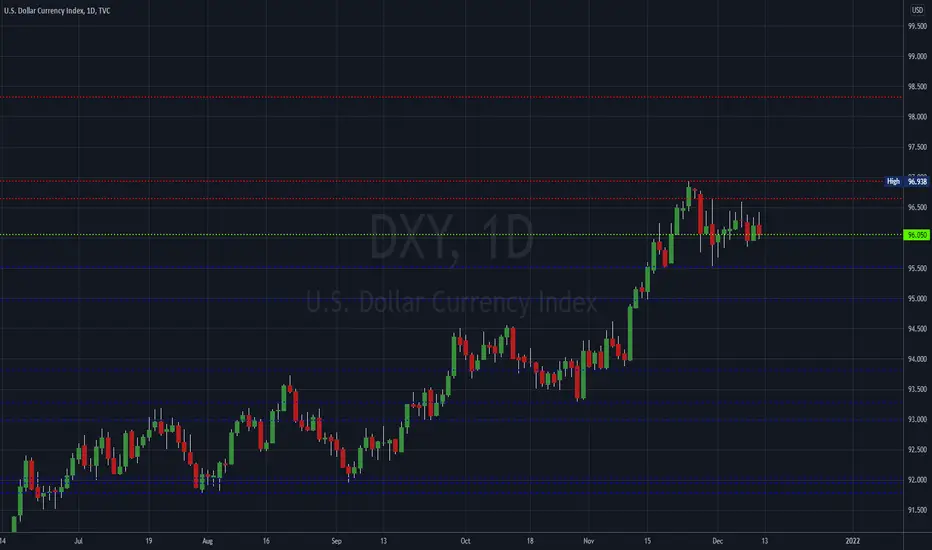
U.S. Dollar Index
The weekly price chart below shows the U.S. Dollar Index printed a bearish inside bar last week, after making its highest weekly closing price in over one year the previous week. While one weekly candlestick of a relatively small size is not enough to invalidate a long-term trend, it is notable that there is clearly strong resistance here, which has had some impact. This suggest that despite the trend, we may be due for a bearish pullback or even a reversal. However, probability suggests this strong long-term bullish trend is likely to continue, so there is no strong reason not to be prepared to a take a long USD trade over the coming week, but do not expect bullish momentum in the USD will necessarily save you.
XAG/USD
Silver priced in US dollars made its lowest weekly close since July 2020. However, there are a few potentially supportive inflection points below the current price down to $21.45. It is also true that the pace of the bearish decline has slowed, and that Friday was an up day. Therefore, it is far from clear that silver is going to decline now with good momentum, but there does seem to be a potential for a sharp breakdown once the price gets established below $21.45.
Traders may wish to short this at the weekly open or at least once the price turns bearish over a few hours, but more cautious traders might want to wait for a daily close below $21.45 or at least $21.53.
USD/TRY
The Turkish lira has been falling very strongly and losing an enormous amount of its value. The pace of the decline slowed last week, but we again saw the lira reach a new record low against the US dollar and close at a record low too. There is a strong trend here against the lira, the problem for traders is that it is very difficult to exploit this as Forex brokers are asking for huge spreads and overnight fees on long positions. However, the odds remain strong in favor of further declines in the Turkish lira.
S&P 500 Index
After trading below its 50-day moving average just last week, the major US stock index has risen strongly. Although the price did not trade yet at a new all-time high, the index made its highest ever daily close on Friday.
The weekly candlestick was solidly bullish and closed extremely close to the top of its price range. This, and the record high close, are bullish signs.
The S&P 500 Index looks likely to remain a good potential buy in the current “risk off” market environment, provided we get no nasty surprises from the omicron coronavirus variant.
Bottom Line
I see the best opportunities in the financial markets this week as likely to be long of the S&P 500 Index and short of Silver in US Dollar terms following a daily (New York) close below $21.45.
BULLISH ON TATA STEEL LTD.NSE:TATASTEEL
currently taking good support and shows bullish reversal . and also there is common pattern which this stock shows earlier also as after taking support on Simple Moving Average 44 , show bullish trend in a WEEKLY time frame.
IT CAN BE A GOOD TRADE.
Do your own analysis before investing.

BABA Weekly Options PlayDescription
BABA remains in extended downtrend that began 27OCT20, now has rejected new supply line established 20-22OCT.
Technical Indicators:
Fallen back below 50D EMA
Bearish MACD convergence
Supply line Rejection
Using A put debit spread, because profits are always limited by time.
Put Debit Spread
Levels on Chart
SL > 178
*Stops based off underlying stock price, not mark to market loss
The Trade
BUY
11/12 165P
SELL
11/12 140P
R/R & Breakevens vary on fill.
The long call is placed ATM for higher chance of profit,
The short call is placed at last known support.
Earnings on 4NOV are a risk factor.
Manage Risk
Only invest what you are willing to lose

Eur/Usd Weekly Analysis 11/08/21Eur/Usd is going to be a bit more complex to analyze this week but in my perspective, I am not really 100% bullish or bearish I have price moving onto the trend line around 1.58 to then maybe drop a couple pips before shooting up to 1.61/62 to fill some imbalances from the higher time frame move we had last week. But then after that it gets a bit complex weekly has establish a new lower high and lower low where investors and traders will have their sl set above this area at 1.67. And as we should know a new LL or LH doesn't mean price is going to continue in that direction. This makes me a bit skeptical as on the daily as welI , I believed could've crashed last week but instead grabbed a previous Daily low and closed above leaving me wondering if we would continue lower. The 2 different colored arrows are two possibilities I see on EU this week. This week may be a bit more complex to understand but we manage risk and adapt everything will turn out in our favor. Im out gang-- love!
-----------------
Go hit a follow on my parter-one of the best traders I know
@AlphaNarekD

DXY 01/11/2021 TradeplanHello, I am Agape
Daily and weekly swing trader
Very simple price action that DXY showed a nice bullish rejection on daily and weekly timeframe. So i place buy limit order at this yellow area.
SL below daily swing low
TP previous daily resistance
Manage your lot size
Place trade at your own risk

Apollo Tyres looks good on weekly chartApollo Tyres at near support on weekly timeframe. Good to Buy above 217 on daily timeframe closing basis.
Target - 237 Stoploss - 212
Risk : Reward - 1:4

Bearish Trendline Respected What About The Bullish CounterTrendGold is still technically in a downtrend overall according to the daily timeframe. It rejected off the trendline for the 4th time last week, so we may possibly break the monthly to continue to swing sell.
I've created a pullback trendline underneath to wait for a bullish continuation, or a break of the BULL trendline as additional confirmation of the bearish trend.
BEAR TPS:
• 1760.25
• 1750.37
• 1741.66
• 1726.44
]b]BULL TPS:
• 1772.14
• 1781.97
• 1793.93
• 1800.75

Bitcoin it's repeating the bull cycleI make this elliot wave analysis as now, we end the phase #2 of the bullish elliot wave cycle, so, we're entry in the phase #3 in the Bitcoin price. So, Bitcoin will be make a large bullish movement toward the new ATH that we could to leading to $100,000 USD in few weeks.
I can't to predict that Bitcoin could to leading until $500,000 USD, but I can to use the same parameters what Bitcoin do in the past as I show here.
Now, I will going to analyze the others timeframe and the past years how Bitcoin made movement using BLX or Bitcoin yearly timeframe as I called it.
Guys, if you found out that this idea may to support you, please share this idea with others crypto-traders to know my perspective in the market.
