Bitcoin Cash continue up to $1,500 USDThis cryptoucrrency show us an interesting trade to know that we're in this bullish trend. This it's the weekly chart and we see that Bitcoin Cash continue ascendint to $1500 USD in few weeks.
At the moment, this it's my information that I have in weekly timeframe!!!
Weeklyanalysis

USDCAD - ForecastUSDCAD Weekly Forecast
- keep looking for sell
- targeting level 1.25000 or lower this week
- if price drop impulsively then targeting towards level 1.35000 and below
Note: it has a potential longer target and I'm still in the trade

ICICI PRU On FIREEE !!!ICICI Pru is looking highly bullish from these levels, Breakout of 70+ Weeks.
Target 1 - 600+
Target 2 - 700+

DXY ForecastDXY Weekly Forecast
- Expect one more down to break previous weekly low
- Level to hit 91.200, potentially 91.000

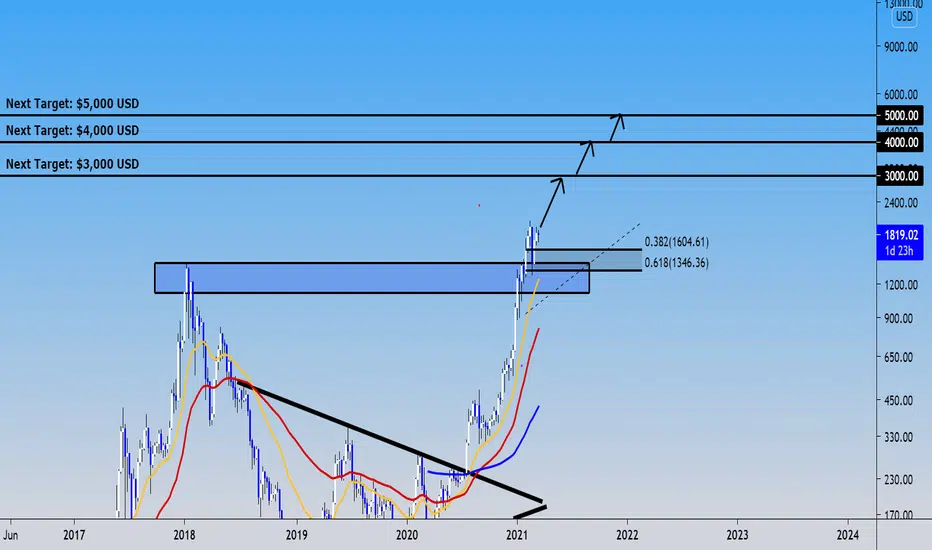
Ethereum rally it's exploding!!!This it's incredible, Ethereum it's above of $2,400 USD. Ethereum it's still as the second biggest cryptocurrency, just for below of Bitcoin. And Ethereum it's the second most expensive cryptocurrency. Now, I want to show you my prediction for Ethereum during this bull trend.
In weekly timeframe, Ethereum it's near to mark $3,000 USD in short term, and the level of $4,000 USD and $5,000 USD it's coming soon between short term-medium term.

SPX's weekly update. 2ed week of April 2021- P/E : @ 40 .93 .Third highest reading since "1875"!!! Tops land. " Usually bottom of crashes not tops".
- SPX's Dividend Yield: @ 1.45 Possible target is 1.10 2000's bottom !!! US10Y @ 1.666
historically 10y note underperforming SPX in April & it has a sideway movements in April as well.
- Insiders: 6 Sell, 2 Buy. No up date on the website, still April 1st reading !!!
- Seasonality: April is the best month of the past 20 years & 2ed past 10Y. Max 12.5% Min (-6.1%)
with Q2 of post presidential election, since 1950, gain of 5% (already 3.5 % in the firs 10 days LoL !!!
- Deviation : Daily - @15.37 % (80 % single pullback) weekly - @39.06% (76% single pullback)
and at the edge of a 54% double digits pullback.
- Candles Auto recognition : White Marubozu 84 % bullish move NEXT. Nothing 7 months for monthly.
- Putt/Call composite @.600 Vs. .597Vs. last week = Still holding Higher Highs/Higher low. Kind of bouncing from 50d MA. Golden Cross looming
-Total Option Volume: 478329 Vs. 378667 big increase 25% up from last week.
- VIX : In our safe green zone, we hit 16.69 Vs. 17. 40 last week
Lowest seen # since last years crash + Closed 2020's "GAP"
- VWAP: @ 58.30 = No man's land, closer to up swing..
- DIX : 44% No man's land closer to a bottom or up swing.
- GEX : @ 22,999,000,000. 55% tops land, 35 % up swing 10% false signal. (HIGHEST READING IN 2Y)
- SPX : Above averages . We are getting 3 of them in the 90s very rare bullishness move here. !!!!
- NYSE: Above average nothing to mention.
--------------------------------------------------------------------------
Key for this week :
1/ Bullish Barubozu Candle 84% success rate.
2/ Higher Deviation = Higher probability of a pullback.
3/ GEX is the highest in 2 years !!!

Weekly Break Down - Will Mention Top 10 Best Quality Trade'sGOLDEN ENGINE Weekly Break Down
i will Give Full Analysis / Opportunity's
With Huge Risk : Reward
TUMPS UP PLEASE AND WAIT FOR BEST ENTRY'S
Today Will mention Top 10 Trade's Available

Are yo prepared for the next wealth transfer in XRP? XRP it's growing up in these days and we see how the monthly chart, but looking this monthly timeframe, that it's extremely bullish in XRP. This it's my alert for you if you hold XRP
Remember, if you want, you can to use Bybit to accumulate XRP just fund XRP in your Bybit account and trade the par XRP/USD if you're intersting to accumulate this cryptocurrency and achieved your goals how much XRP Do you decide to accumulate?
For example: I have near of 5,000 XRP coins that I buy in this year when XRP was in twenties cents in January 2021. Right now, my 4,734 XRP have a value over $5,000 USD. But, I thinking to achieved 10,000 XRP coins, but my goal it's to find up a little more of the half of 5,000 XRP just making trading in Bybit continue re-accumulating XRP coins.
Guys, Simpson it's predicted very well the future of XRP, for that, there's a lot you tube videos that it
s talking about how the business, institutionals and banks it's interesting to adopt Ripple technology. Ripple technology it's the way that XRP use to transfer and move money hand to hand to negotiate, for that, part of the next wealth transfer, could to reach in XRP. But well, XRP it's a cryptocurrency with big fundamentals that XRP could to work for all financial markets based in all in money. The Simpson predict that xrp worth $589 USD. And looking this price, if the Simpson prediction it's okay, a lot people will be millonaire with XRP. Well, in my case if I hold near of 5,000 XRP coins, and if XRP reach the $589 USD, I will being millonaire with XRP. approximately get a profit near of $3 million.
Now, looking in medium term, XRP could to continue exploding in the following weeks as XRP continue explodin more and more!!!

Bitcoin break out the simetric triangle; nest prediction $70,000At the moment, Bitcoin it's up and right now the price it's still above of $60,000 USD. But, as Bitcoin break out this simetric triangle, the price need to make a pull back approximately at $59,500 USD to then, have a confirmation using the price action to valided that Bitcoin going to run towad the $70,000 USD soon.
This it's the Daily timeframe and it's look bullish, we see more better this simectric triangle. for that, my latest trade was in short position and well, I predicted very well, but I knew that Bitcoin it's form a possible accumulation zone that today we break out this zone. Now, Bitcoin it's so bullish.
And also, I want to share this weekly timeframe, I see that the next movement in few weeks like 3-5 weeks, we can to leading toward the $100,000 USD psycological point. For that, this next movement it's so similar as we have in the past movement.
Guys, if you found out that this idea it's so interesting for you, share this analysis with others traders to know my perspective and join me and together we are going to fight ourself.
At the moment, my trades are EOS, Tezos and XRP. At the moment, I decide to buy Litecoin in my yesterday analysis. And I see that who follow my XRP analysis, right now, we're in profit and XRP price it's around of $1.25 USD. Tha it's amazing, my prediction work very well and so impecable.

NZDUSD ForecastNZDUSD Weekly Forecast
- look for down move after higher pullback correction
- target level at least towards 0.68500
- potential further deeper towards 0.66200 and lower during end of month

EURGBP ForecastEURGBP Weekly Forecast
- look for one last down move before reversal
- target level at least towards 0.84700
- potential further deeper towards 0.84500 and lower

GBPUSD ForecastGBP Weekly Forecast
- one more up move to at least 1.38800
- then expect a pullback correction or sharp impulse to total down
- aim for target level 1.40200 and above if the pullback correction given

EURUSD ForecastEURUSD Weekly Forecast
- confirmed up move to at least level 1.18200
- potentially further up towards 1.18500 or above

SPX's weekly update first week of April. Historically A+ month.
- P/E : @ 40.93 .Third highest reading since "1875"!!! Tops land. " Usually bottom of crashes not tops".
- SPX's Dividend Yield: @ 1.45 Possible target is 1.10 2000's bottom !!! US10Y @ 1.672 " Exactly like last "
- Insiders: 6 Sell, 2 Buy. Selling is down from 137. No activity here what so ever. Are they waiting !!!
- Seasonality: April is the best month of the past 20 years & 2ed past 10Y. Max 12.5% Min (-6.1%)
- Deviation : Daily - @13% (64% single pullback) weekly - @35% (76% single pullback)
- Candles Auto recognition : Nothing found 4 weeks in a row weekly, 7 months in a row for monthly.
- Putt/Call composite @.597 Vs. .764 Vs. last week = Less puts bought last week than the weeks before.
Still holding Higher Highs/Higher low. Kind of bouncing from 50d MA. Golden Cross looming
-Total Option Volume: 378667 Vs 295309 big increase 30% up from last week.
- VIX : In our safe green zone, we hit 17.40 Lowest seen # since last years crash + Closed 2020's "GAP"
- VWAP: @ 65 = No man's land, closer to up swing..
- DIX : 40 No man's land.
- GEX : @ 5,857,000,000 "No man's land".
- SPX : Above averages . They had us going last week the break down of 50d MA. Was a Bottom !!!!
- NYSE: Above average nothing to mention.
www.tradingview.com

DXY ForecastDXY Weekly Forecast
- look for down move after the correction
- target level at least towards 92.500
- potential further deeper towards 92.000 and lower

AAVE/EUR Weekly Analysis (03-04-2021)1D-Chart:
- Since it has already break above the 'Main Triangle Upper Resistance', there is a bigger chance that the price will go up.
- Supertrend: Already bullish
- SMA 20 & 50: Price already above both MAs, and soon MA50 will cross above MA20. Another bullish sign.
- MACD(12,26,9): Still bullish, no divergence.
- RSI14: Hidden divergence -> bearish continuation
According to those facts above, I think:
- Currently Bitcoin has been ranging at around $59,000 for a few days and it could break out anytime, so the bullish/bearish of AAVE would really depends on where Bitcoin is heading to.
- The market of AAVE prefers a bullish one, but being very cautious. So the price might goes up, but slowly. The minor Fibonacci channel (parallel with the Main Triangle Upper Resistance line) will come more in play.
Possible Resistance:
- Minor Fib Channel: Level 0.618 (current price)
- Main Triangle Lower Support: @366
- 1D R1: @372
- Minor Fib Channel: Level 0.786 (@384)
- Major Fib Channel: Level 0.236 (@384)
Possible Support:
- 1D Pivot: @320
- Minor Fib Level 0.382 & Major Fib Level 0: @290-305 area
Remember, this is the crypto market, and anything can happen. This is not a financial advice, but just my own analysis/thought.
** If you agree and enjoy this idea, please like and/or comment.
** If you think I make an analysis error, please also share your thought so I can learn from my mistakes. Thanks!

ankr weekly short swing scalpWeekly pivot and monthly pivot both developing lower. Of course it could rise prior to their closing time. However they will lmost always revert to that far untested pivot following. One could buy the dip upon testing it or short swing to it with a average cost up in case it rises more leading up to the CLosure. Tarrget would be where the central pivot and/or weekly/monthly L3 comes in after this next weekly and monthly close on their respective levels.
Using camarilla pivots + cpr magnet reversion method. Weekly/monthly levels

Storj short swing monthy and weekly reversionWeekly pivot and monthly pivot both developing lower. Of course it could rise prior to their closing time. However they will lmost always revert to that far untested pivot following. One could buy the dip upon testing it or short swing to it with a average cost up in case it rises more leading up to the CLosure. Tarrget would be where the central pivot and/or weekly/monthly L3 comes in after this next weekly and monthly close on their respective levels.
Using camarilla pivots + cpr magnet reversion method. Weekly/monthly levels

Don't sell Bitcoin: This it's the best chart of the history!!Looking out, Bitcoin was the best performance in the human history. For that, I invite you to know what kind of money it's Bitcoin .
I learn this year how Bitcoin up in based the drop and the inflation in the world reseve currency, it's mean the U.S. Dollar, the U.S. Dollar it's death and guys, for that, FED or Federal Reserve or U.S. Central Bank it's print out more and more money in America. Also, as I'm in Puerto Rico , as Puerto Rico (my country and part of U.S.) it's received a lot economical stmulus from the FED and approvied by U.S. senate and government. But what happen in this time? That FED it's print out more and more money, and included more than past year, and in America all goods and service are inflated their price and Dollar loss the value, people don't know and it's not prepared of this storm. Depending the situation, if America collapse, there would be hyperinlation in the world economy, and so, America it's can to collapse!!!
For that, I invite you to understand this part what kind of money it's Bitcoin , becuase each satoshi have more value than U.S. Dollar.
Look the importance:
If you invest at least $500 USD when Bitcoin was $5,000 USD, you get 0.1 Bitcoin , now today, this 0.1 Bitcoin have a value of over $5,000 USD. In my case, as I have Bitcoin , Cardano, Chainlink, XRP and Ethereum , well, my value in Bitcoin it's over 0.1 BTC , it's mean approximately of 0.31 BTC between these cryptocurrency. My major value in Bitcoin it's in Cardano that my 11,234 Cardano coins have a value over 0.2 Bitcoin .
The best that I want for you it's understand this exercise and apply your knowledge in your personal day to day.
I share this link if you want to look how the banks work, how your money work, and much more that you can to explain you what school don't teach you about how the financial crisis it's form structurally.
Here the link of the documental: www.youtube.com

Litecoin show a good interesting opportuity; I reconsider it!!!At the moment, if you thinking to trade Litecoin, I thinking to trade Litecoin, this crytpocurrency show a good analysis and good position that I can to make a Daily analysis more secure and profesional for you. I see that Litecoin it's bullish and I entry right now in the marketprice around of $187 USD to long position until the $423 USD, I follow the Daily analysis.
I know today that Cardano and Ethereum was touch me my break even, in except, as I entry around o $1,500 USD in Ethreeum and touch my break even exactly at $1,700 USD, I get some profits in Ethereum, but in case of Cardano, I do not earn and loss, my profit was 0 without any loss, becuase I put a break even in the price entry in Cardano.
But, whatever, I see that Litecoin it's more interesting to trade Ethereum, but I change Litecoin for Ethereum to trade it.
Litecoin could to form a simetric triangle, notice that much crytpocurrrency it's in this pattern, for that, this it's a good opportunity to bought Litecoin or put in long position.
And the weekly analysis it's still bullish, for that, I make a Daily analysis in Litecoin.
Guys, if you found out that this idea it's very interesting for you, please comment below what do you think about Litecoin, and I invite you to share this analysis with others traders to know my perspective of this crytpocurrrency.

BTCUSD Weekly Analysis 21-03-2021Last week, we notice a divergence on the 1D TF, so as expected, the price did goes down. Then it slowly crawled up again only to reach $60,000 as the highest point.
During the week, in the lower 1H & 4H TF, we can see that a triangle was formed. It tried to break out the triangle in the upper direction, but it kept being pushed back again into the triangle, until today it broke out again, only in the opposite direction, where at current, it also breaks the 4H pivot support, but not confirmed yet.
If the price stays at current position, then we will have a continuation divergence (the dashed green line on chart) with higher low on chart but lower low on RSI. But since the bar hasn't closed yet, this might or might not happen.
Some scenarios that could happen for the coming week:
1) the price goes back up again above the pivot and bounce back up.
In this case, it will then need to go against several resistances:
- the Fib 0.382 level (in my chart)
- the Fib 0.5 level that is just a little bit under the 4H R1 and the ATH ($61,724.6), which is also about the R2 level on the current daily TF.
- If the price action goes above the ATH, then the next resistance would be the psychological level of $65,000 (a little higher than the R2).
- And lastly, it will meet another big resistance at the $70,000 level (also a little higher then the R3).
2) the pivot break holds up and the price went further down.
Here, we will consider several supports:
- the Fib 0.236 level (which is also about the R1 on the current daily TF)
- the MA 200 (which currently is at around $53,000)
- and then the S1, Fib 0 level, and the S2 that all are not too far apart.
If the S2 doesn't hold, then we can start to prepare to buy the dips :)
If the divergence that I mention at the beginning confirms, then the possibility of the 1st scenario would be bigger.
Remember, this is the crypto market, and anything can happen. This is not a financial advice, but just my own analysis/thought.
** If you agree and enjoy this idea, please like and/or comment. Thanks!

XRP it´s prepare to break out this accumulation zone!!!XRP it's so interesting, I hold XRP too as I hold Cardano, Ethereum and Chainlink, and obvioulsy Bitcoin, but there´s an interesting data that I want to share about XRP that it´s could to explode in the next movement so near to look.
As we are in this simetric triangle in this range o $0.40 cents-$0.60 cents. XRP it's prepare to up in this bull rally. When XRP break out this simetric triangle, it's very easy to we're gonna to mark the $1 dollar in medium term, and easily we can to goes to the historical maximum price of $3.50 USD in the past bull rally 2017.
I'd like this cryptocurrency not just that it's very cheap, this cryptocurrency it's one of the top 10 cryptocurrency with best reputation to invest, and also, based in their fundamental analysis, this cryptocurrency could be distinguished in the next wealth transfer around the world into this cryptocurrency as this cryptocurrency it's used by banks, part o the wealth transfer could to move in XRP.
But, looking in long term, if you hold XRP, noticed that XRP have a lot way to run. Now, one thing it's that XRP it's one of my tops cryptocurrency very cheap to bought, because the price it's just around o $0.52 cents in the live market at the moment that I writing. Another strategy that I apply it's open XRP contract and hold XRP contract by long term as I do to multiple much more my XRP assets. Part of my XRP hold it's in Bybit to open up XRP contract to hold and multiply my XRP assets.

Ethereum it's prepare for the grow up in the next weeks!!!In this macro-analysis looking in weekly timeframe. Ethereum make the confirmation in the past weeks and we see a good signal that Ethereum it's extremely bullish in the next weeks. I apply the Fibonacci and we see another extra confirmation above of $1,400 USD that was an important support to valid that the Ethereum bull run it's true.
And looking the monthly timeframe, remember that Ethereum it's so bullish in this timeframe and I have my targets at $10,000 USD, $20,000 USD and also $30,000 USD it';s possible huge objective.
Now, if you see in medium term, we have the $3,000 USD, $4,000 USD and $5,000 USD for the Ethereum price. That it's in weekly timeframe and I have these targets that we can to see around o this next bullish movement on Ethereum, but obviously we are approaching to $2,000 USD.
Guys, if you like this idea and you found out good contents in my Ethereum macro-analysis. I invite you to share this analysis with others traders, Ethereum enthusiastic and people who want to know the Ethereum trend, and the rest o crytpo-community.