Weeklyanalysis

Wedge Breakout Will Determine DirectionGold broke a range it held a few days, but needs to fill a wedge to determine its true direction. If bullish, I'm going to ride her as far as the daily level area to 1910.90. If it breaks for the bear, I'm going to swing it all the way down to the monthly area around 1769.11. This is the time of year where gold prepares for a swing trade. So I'm anxious to see where we'll go this week.
BULL TPs:
• 1877.19
• 1899.79
• 1910.90
BEAR TPs:
• 1843.04
• 1829.20
• 1819.96
• 1801.80
• Stretch TPs:
• 1779.78
• 1769.11

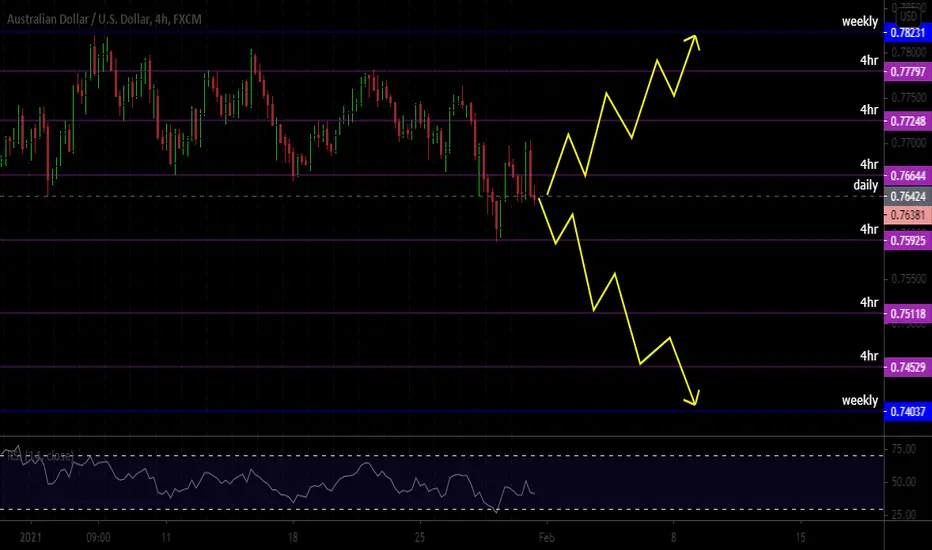
We Are Either Range Trading or Breakout Trading This WeekThis pair looks to be getting ready for a major breakout. The question is where? Consolidation is trapped between the weekly 078231 area and the daily 0.76424 area. It looks like it will continue down, but with it sitting on the daily, it can easily bounce back up and stay in the range until a breakout happens.
I've marked the chart in case to trade the range to the weekly and to enjoy a bearish move if it breaks the daily levels. For now, this is a wait and see.
BEAR TPs:
• 0.75925
• 0.75118
• 0.74529
• 0.74037
BULL TPs:
• 0.76644
• 0.77548
• 0.77797
• 0.78231
Are These Engulfing Candles Telling Us The Bulls Are Back?It is the week of retesting bullish engulfing candles. There is a bullish engulfing retest that happened last week which could signal the return of the bulls.
Another confirmation is the bullish engulfing that formed on the daily chart Friday, March 5th.
Could see a retest of the engulfing before going up since a higher low is due on the 4hr. If the retest fails, price could send us back down to the 3785.9 daily area before trying again.
The test will be if it can pass the monthly 3867.3 area this week to continue the bull rally or not. Let's find out.
BULL TPS:
• 3867.3
• 3894.2
• 3930.8
BEAR TPS:
• 3823.5
• 3790.0.
• 3755.6
• 3730.6

Ethereum Dominance (Overview): It's strenghten!!!It's the first time that I analyze the Ethereum dominance. But I consider that this indicator it's hide information very important that people don't know as data analytics. I'm enfocous more in weekly timeframe and we see that Ethereum Dominance it's bullish. That mean that the Ethereum trend it's bullish in the price. For that, as Ethereum strenghten, we can to see in the next months a grow up of the Bitcoin ratio too. For that, the importance to know this hide information it's very relevant to understand what Ethereum do and maybe others crytpocurrency.
Now, the dominance historic was around of 30%, the Ethereum dominance it's around of 12.40%, and it's grow up!!! And that it's my prediction for the Ethereum dominance throughout of the time.
Guys, if you find up that this idea it's sound interesting, you can to share this analysis with others crytpocurrency traders to have a perspective in Ethereum!!!

BTTUSDT Bull Flag ~ Weekly ChartBTT Bull flag pennant & cup and handle in play. Do not have to tell you how bullish this is!
Amazing returns ahead for mid term hold


EURUSD trade idea for Next WeekEURUSD now testing previous resistance as support on the weekly chart. As you know, the Weekly direction is very strong and this pair will likely start its long-term uptrend from this area. So it is a good idea to buy for long-term trades.

POTENTIAL SELL ON GBPUSD - HEAD AND SHOULDER PATTERN Similar to my previous analysis on EURUSD which has nearly reached its profit target, this analysis too is based on multiple time frames. On the weekly chart there is a rejection off a strong yearly price area, and on the daily a hammer candle seems to be forming. On the 4 hour time frame there is a clear H&S pattern. The reason why the potential profit is very large compared to the risk, is because usually H&S patterns go the distance of the head of the pattern. If one was to enter this trade, I would recommend only entering after a retest and rejection of the H&S pattern to definitely confirm this is a valid H&S pattern. I have also shown how I think this trade could look.
*NOT FINANCIAL ADVISE, MERELY AN OPINION*


RSI Bearish divergence + Bearish Engulfing on weekly TFBearish divergence
As we can see here there is a RSI bearish divergence (also in Daily TF) but as we know 1H and 4H TF have bullish divergence , in weekly BTC is not promising
Bearish Engulfing
We had such a this engulfing candle in Late 2017 20K which leaded BTC to 3K , now we can see a massive bearish engulfing candle that will close in 11 hours and its absolutely not a good sign for bitcoin.
In case of closing this weekly candle as an engulfing one we can expect BTC to reach 12K or 8K (in very low case )
What you think about this situation ?
leave your opinion on comment it can help me and many others to take more profit from this monster

SPX's weekly update. Last week of February 20211/ No auto-candle found, still MW in control
2/P/E 38.42 and rising, rare seen with our a crash
3/ Dividend Yield 1.54 VS. US10Y 1.36 !!!
4/ Daily Deviation 14% = 64 Single Pullback
5/ Weekly Deviation 33.5% = 76 Single Pullback
6/PC, we've had lower # 2009/2010/2007 .
7/ Vix still in our study's Green zone.
8/VWAP ,no man's land.
9/ Stock above MAs, nothing noticeable.
10/GEX's reading +1.000.000 No man's land
11/ DIX 41 %, No man's land

Ethereum it's make the pull back!!! Bullish!!!In this weekly chart, I update the panoramic and we see that Ethereum it's in the key zone of confirmation for the next bull rally 2021. I have a plan to reach my target to $3,000 USD.

Overview: Does 30% correction it's enought to stop and bought?At the moment, as we see in Daily and Hourly timeframe, this it's very important for Bitcoin in long term looking to weekly timeframe.
I have these 2 perspective so possible for the Bitcoin price. My first perspective it's that Bitcoin its right now in the possible correction of 30% to stop this correction in the level of $42,000 USD and well, in this zone it's a key point to bought in this level to make trading.
In case that Bitcoin break out the $42,000 USD, we can to see a strong correctio toward the $29,000 USD approximately and that it's a correction of 50%.
For that, this it's my bearish setup plan in case that Bitcoin break down the $42,000 USD key support.
And finally, I want to share you an interesting data that in the past on the previously bull run of Bitcoin on 2017 we have the similar event that was occur in the same months in February 2017, now we are in February 2021 and we see that this it's repeat the same movement what Bitcoin do in the past. For that, I share you this screenshoot what I analyze it for you.
Guys, if you found out that this idea it's sound interesting, I invite you to share this analysis with others people, traders and investor who analyze BItcoin or have a simiar plan, and also to sum my followes who follow me in my trading view, in the past 2 days I overpass the 1,000 followers, and overpass the 4,000 points ot my trading view reputation. That's excellent for me to work my talent.

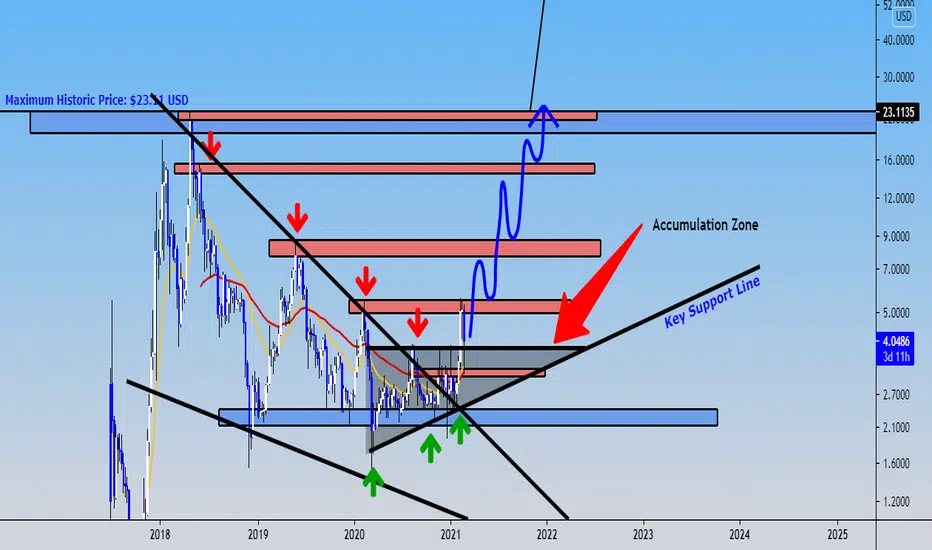
I bought EOS contract for this bullish panoramic!!!I want to make an overview of macrotrend to know what it's the next movement on EOS.
There's an intersting movement what EOS can to make in the future following this model and market structure in the weekly chart that I draw with blue brush. As we look, this it's so bullish for this crytpocurrency in the next weeks to months. And we break out this ascendent triangle of accumulation. For that, I decide to bought 400 EOS contract in my Ethereum account and 150 EOS contract in my Chainlink account, both in my broker what I choose Simple FX . Remember, you can to trade Forex, cryptocurrencies, stocks, commodities and others financial markets. But just, I use this broker to trade crytpocurrencies.
Now, I change my Cardano contract for EOS because EOS it's in the lower zone of accumulation than Cardano, that it's very soon to break out the maximum historic. For that, EOS it's a great opportunity to accumulate or bought. I'd reccomen to trying to bought EOS contract, and this it's all, you don't need to make nothing.
But, I see in my opinio that EOS it's not bearish, it's extremely bullish toward the long term, and for that I decide to chagne my Cardano contract for EOS contract based in what EOS it's in the good and excellent point to accumulate, and also, the fundamental analysis are very good.
And finally, this it's the monthly chart, I want to show you this forecast price what EOS it's so prepared for the next bull run that it's begining in the next weeks to months. I have these targets: $100 USD, $300 USD, $500 USD and $1,000 USD
Guys, if you like this overview, I invite to share this analysis with your friends, tradrs or people who hold EOS!!! And soon, I will going to take time to create a new topic of EOS about what it's this crytpocurrency.
XAUUSD Long-term Uptrend ChannelIf XAUUSD doesn't lose the uptrend channel (stimulus, inflation, etc...), after touching the lower part of the channel, it could search the upper part at the fib-extension level 0.618 ~ 0.786, prices 2343 ~ 2495.
NO EXPERT. I'm very newbie.

GBP/USDsoon i'm looking for GBP to test 2018 high/resistance before a nice short and break of its weekly-daily bullish trend.
Now the market may not play out in this way or order but i nice look here on the weekly and daily.
i will most likely scale into smaller time frames to capitalize on long & short movements.

EURUSD Multi time-frame AnalysisHey traders, here is the analysis for the EURUSD. NOTE - Please do your own analysis before taking the trade. Let me know if you guys have any questions in the comment section. If you guys like my analysis please hit like. Thanks.

Long continuation for BitcoinAccording to weekly chart analysis of BTCUSD, we can see a well worked rising channel in long term run.
I marked how this trend lines react to price every time!
Now it seems price is going to touch upper trend line again which is around 120.000$.
Weekly candles are strong bull and market are heating up more and more with news and people attentions...
So according to past price volatility of Bitcoin and what I said above, price target would be accessible in few month.
* This is an analysis and is not a signal to trade

#CHAINLINK #LINK #WEEKLYHi guys..its the latest analyze chart of LINKUSDT in weekly time frame .if you are interested any crypto that you want analyze with me and any questions please do not hesitate and comment below the chart!
if u like it press like-comment and folow me.thx

#FETUSDT #weekly #FETCHHi guys..its the latest analyze chart of FETUSDT in weekly time frame .if you are interested any crypto that you want analyze with me and any questions please do not hesitate and comment below the chart!
if u like it press like-comment and folow me.thx

USDJPY Short Multiple time-frame analysisHey traders, here is the analysis for the USDJPY. NOTE - Please do your own analysis before taking the trade. Let me know if you guys have any questions in the comment section. If you guys like my analysis please hit like. Thanks.
