Weeklyanalysis

Are you prepared for the next movement!!! Bitcoin to the moonIn this analysis, I want to enfocous more in macrotrend analysis and we see with clear perspective that Bitcoin it's follow the trend. At the moment, as my target it's around of $41,600 USD, I will going to large my target toward the $60,000 USD. As we break out this bearish channel, the trend it's so bullish.
Also, looking this date and time range, that I use to measure the percent of any correction and increment, we see that Bitcoin was a under correction of 30% in the past days, now I have a forecast of 75% of increment of the price toward the $60,000 USD soon
Also, noticed that in this timeframe I use a Fibonacci level and we touch the 0.382% of Fibonacci, so that was a good support to bought Bitcoin at near of $33,000 USD. My entry was around of $34,500 USD when Bitcoin in the past days was manipulated in hte same news and I believe in the past that Bitcoin it's going down toward to find below level at $27,000 USD at least, in the 0.618% of Fibonacci as second point to bought Bitcoin. But nope, we touch the 0.382% of Fibonacci and we're going to the moon!!!
Also, I show you my Fibonacci trend that I mark these 5 targets, but my specific target it's the $60,000 USD. that it's could become a high impulse to bulls in the next days. So, also, another indicator it's to check out the Bitcoin dominance if have be the control to the dominance.
And in wekly chart, this it's one of the important chart to take noticed in it.
Guys, if you found out that this idea it's so interesting for other traders, please comment below what do you expect in Bitcoin and some altcoins if you're interestng to comment. Remember, I'm in profit in these altcoins right now: Bitcoin, Litecoin and Cardano. I keep this position for now. I know that Ethereum it's explode, but I don't going to make another 4th entry, the maximum that I can to trade based my trading plan it's 2 to 3 trades, not more.

Cardano it's exploding!!! Forecast of 57% up!!!At the moment, ADA it's break out this ascendent triangle and we're ging toward a bullish scenario of $0.61 cents!!! I follow more the Daily chart, it's the best!!!
For Cardano holders, enthusiastic and investor, we going to soon to reach up the mark of $1.40 USD in the next weeks to months!!!
This it's so bullish for Cardano!!!
This it's my altcoin #1 that I'd reccomend for you to invest to long term!!!

2021 Looks Bullish For ADA/Cardano - Weekly OutlookBITTREX:ADAUSDT - 1W
I traded ADA during the first week it was on Bittrex and its had my attention since. Sometimes its good to take a step back and look at the big picture. After closing a nice IH&S trade I thought Cardano deserved a review of its long term prospects. If it can clear this $.40 hurdle, it's looking incredibly bullish.
A potential cup & handle, forming since April 2018, is nearing completion. Looking at the volume now, it's nearly half of what it was ranging at during 17/18. Taking a step away from the chart, since April 2018 we've seen:
ADA staking at ~5.x%
Mary & Goguen nearing launch, which will spawn DApps/low fee DEX.
Bull markets for stocks & metals.
Central banks wojacking their money printers
Regardless of what happens to ADA's price in the next week or two, it is going to start to see usage that will initially be a fraction of Ethereum's. Yet as more projects launch or port, you'll see incredible organic ADA demand for fees, token creation, DApps, etc. This is going to be a massive driver of volume, and you would expect price. DEX/yield farming was huge throughout 2020, and the worst part of it all has been gas fees. Gen 3 blockchains are solving this issue, and ADA is in that category. It will continue to chip away at ETH's usage volume as it penetrates new markets in Africa while maintaining a first world audience. There's exactly zero reason to think ADA's demand will drop over the next 18 months, and that is only compounded by the craziness of the world.
Back to the chart, once $.40 is sustained, the coin won't see any resistance until just under $.52. Once that hurdle is cleared, it's smooth sailing until the choppy waters of $.65-$.70. The lines notated on this weekly chart were drawn from daily candlesticks. The chop area is full of various wicks and closes. Unless ADA just blows right past it, it's going to cool out in that zone for a week or two...or three. Should it blow past $.70, which is entirely possible if timing coincides with the US rolling out trillion dollar projects, $.90 is the last stop before ATH. ADA launched at the right time in 2017 to catch all the bull fervor. It shot up and shot down very quick, leaving little in the way of firm supports/resistance. If you take anything from this idea, know that $.90 is the one place ADA can lose steam for a period of time.
ATH was a long, single wick. It presents little in the way of real resistance and will likely get obliterated when the time comes. 5x'ing the prior ATH would put it at $6.90. Link just 5x'd its prior ATH set in June '19.
At the time of writing ADA is at $.385.
This is not investment advice and trading cryptocurrency is high risk.

LINKBTC is ready for 0.001 🦐$LINK.X bounced on weekly dynamic support. The price now it testing daily support. IF the price will have a breakout upward, According to Plancton's strategy (check our Academy), we can set a nice order
–––––
Follow the Shrimp 🦐
Keep in mind.
🟣 Purple structure -> Monthly structure.
🔴 Red structure -> Weekly structure.
🔵 Blue structure -> Daily structure.
🟡 Yellow structure -> 4h structure.
⚫️ Black structure -> <4h structure.
Here is the Plancton0618 technical analysis, please comment below if you have any question.
The ENTRY in the market will be taken only if the condition of the Plancton0618 strategy will trigger.

CHF/JPY Analysis Jan. 24, 2021Welcome back! Please support this idea with a LIKE if you find it useful.
** If price breaks key weekly resistance, it may rise to the 1860 resistance level.
We recommend that you keep this pair on your watchlist and enter when the entry criteria of your strategy is met.
Click "Follow" on our profile if you'd like these trade ideas delivered straight to your email in the future.
Thanks for your continued support!
Brian Kenya Horton, BK Forex Academy

Bitcoin oversold .. will it correct? Lets see..Just an idea but you can see how heavily over bought BTC is on the weekly .. currently over the 90 RSI. You can see that I circled other RSI periods where Bitcoin was over a value of 90 and how it soon corrected afterwards.. the longest period Bitcoin hovered over 90 RSI was in the 1st 'bubble' which lasted for seven weeks before taking a dive. Same thing with the 2nd 'bubble' which also lasted 7 weeks. 3rd bubble lasted 2 weeks. In our current state of being over bought, labelled 4, we are 2 weeks in an over bought RSI over 90. If Bitcoin is nearing a correction then $19k support would be a good area to add buy orders, also the golden ratio fibs. A correction might not come for a few more weeks as per the first and second RSI bubbles show but that was when Bitcoin was a hell of a lot cheaper than it is now, so it makes sense that people would begin taking profits a lot sooner today. After a 920% gain since March, I don't think a 50% correction is out of the question but we will see!

Will Price Make A New High or A New Low?Gold on the daily looks like it made a lower high and is getting ready to make another lower low. It also has the potential to make a higher low instead. The overall move is bearish. I wonder if gold will respect it or let the bulls take over?
BEAR TPs:
• 1857.71
• 1847.68
• 1819.96
• 1801.80
BULL TPs:
• 1905.14
• 1931.16
• 1965.93

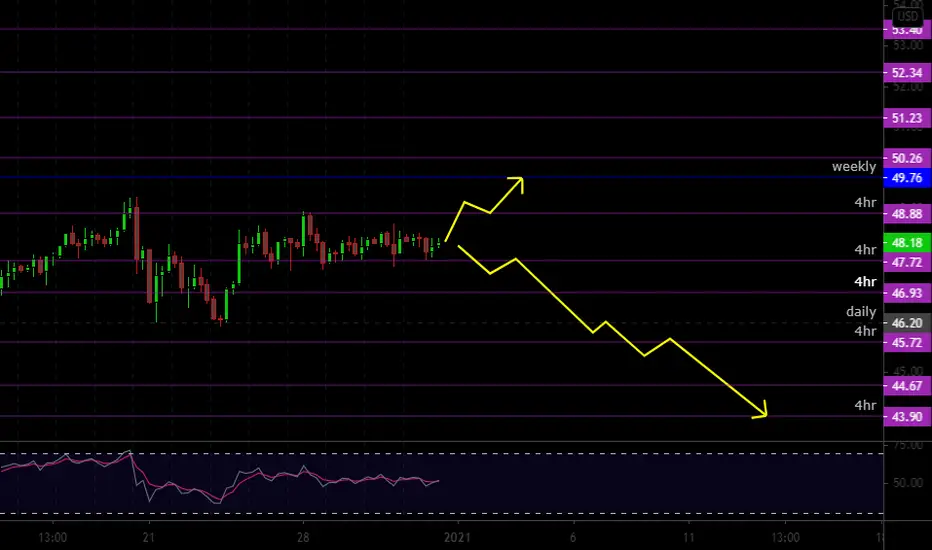
Is Consolidation Showing Signs of a Drop Coming?Price looks like it's showing fatigue on the daily and is consolidating for a potentially nice drop this week.
This will most likely move as a giant pullback before continuing up, but it'll be a few hundred pips before it continues.
Otherwise, I have to see is it going to do a fakeout to the weekly or actually bust through it. We're about to find out.
BEAR TPs:
• 46.93
• 46.20
• 45.72
• 44.67
• 43.90
BULL TPs:
• 49.76
• 50.26
• 51.23
• 52.34
• 53.40
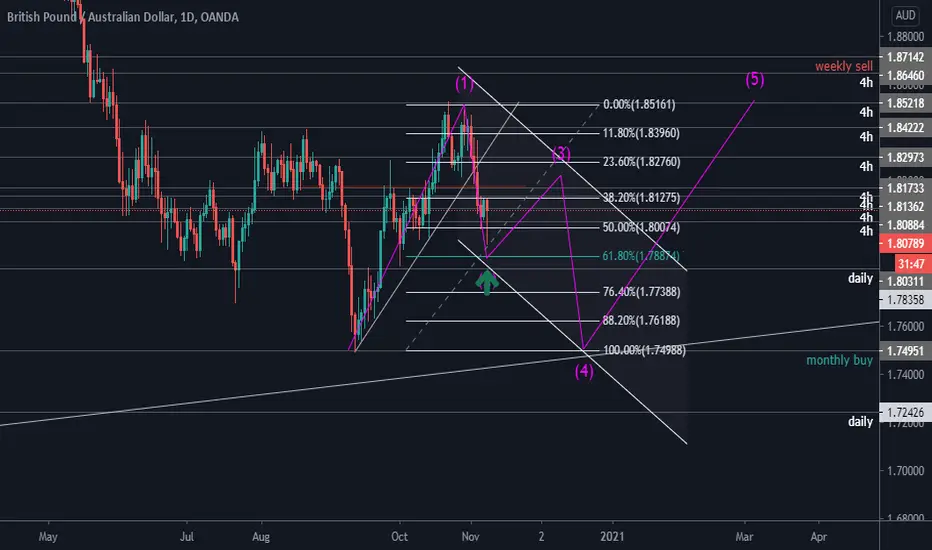
GBPAUD- Weekly AnalysisHappy Sunday to you all,
Definitely was a weird week last week for GBP. What I think will happen when the market opens is price will gap back down to where it gapped from last week, which it never retraced back to. Even if it doesn't price will rise then eventually retrace to that area for sure! I personally have never seen anything happen like this, where price doesn't retrace to where it gapped from within the same week. So what i'm expecting this week is price will retrace and rise just like it has previously at this area a few other times. If price was to take on the bulls price is definitely headed to 1.80000+. I will be updating/posting this pair all week so stay tuned, I feel a good week is ahead of us!

GJ Weekly Analysis! *Big week ahead!*Happy Sunday to you all!
*READ ENTIRE ANALYSIS*
Price is creating more higher highs, higher lows, and looks to be about to reach the resistance line just above the 78% on the Fibonacci Retracement (Blue Line) which is around the price of 142.825. What I see CAN POSSIBLY happen is price creating a bearish 3 drive strike pattern *Red cirlces* once it reaches the resistance line which is why I have the long dark red path line from resistance all the way to the 0% on the Fibonacci Retracement. I've put my predictions on the chart for if price was to go up or down from where it is now, and right now i'm leaning more towards the bulls, based off what i'm seeing at the moment, and also what price has done in the past. The green circles indicate where I personally will be looking to execute on GJ if obviously the market plays out how I see it playing out. Goodluck with this pair if you are trading it this week!
Leave a comment below if your trading GJ this week, and leave a like if you agree with my weekly analysis

GBPJPY KEY LEVEL + WAITING ZONESGBPJPY key levels. This week definitely looking for mostly buys as the current trend is bullish looking from the 4h chart.

GBPUSD Resisted at 3-Year Supply ZoneGBPUSD has been resisted at a 3-year supply zone after attempting to break out. We could expect GBPUSD to pullback first, before continuing it's uptrend, first point of resistance being previous resistance turned supply. Should GBPUSD be able to break this support level, we could look to buy GBPUSD again at current 7-month rising trendline

BAT- Long-term weekly S/R flip aheadAfter more than 70% retracement, BAT is poised for another run once the derivative data turns bullish.
Long-term weekly S/R flip is the last hurdle to clear.

Triangle Breakout This WeekUJ seems to be slowing down in momentum when looking from the higher timeframes. I wanna say we are going to remain bearish overall, but I want to see how this is gonna play out. As you can see from the trendlines, this could be just a giant flag for the bull. So let's find out what happens this week:
BULL TPS:
• 107.260
• 107.528
• 108.072
BEAR TPS:
• 106.808
• 106.437
• 105.844

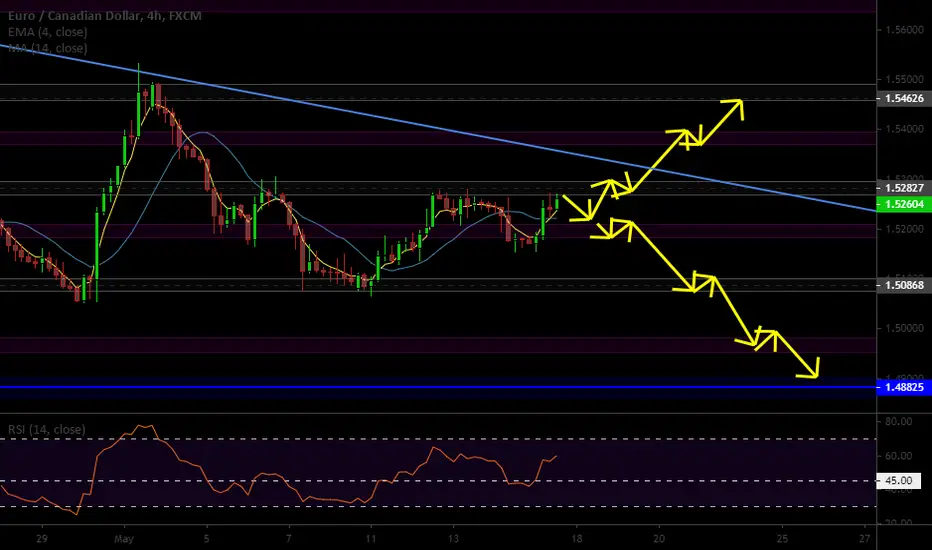
Will Previous Market Structure on Weekly Be Respected?On the 4 hour, it looks like a baby head, neck, and shoulders is forming to signal the bull. The right shoulder is missing. BUT, it's the weekly charts that got my full attention. It shows price is bearish, but a bit jagged.
We're sitting on top of where a previous market structure took place. If we break the range at 1.50748, we're gonna be in for a nice nosedive. This is my favorite pair. I can't wait to see what it does.
BULL TPS:
• 1.52947
• 1.53709
• 1.54582
BEAR TPS:
• 1.51824
• 1.50998
• 1.49809
• 1.49015
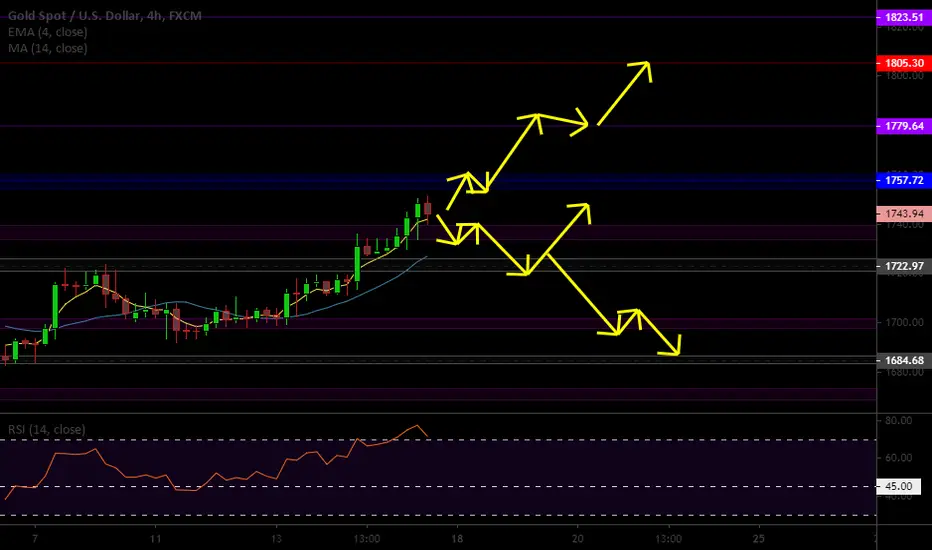
Possible Pullback Before ContinuationGold hasn't been this high since the last recession. Had to put in new levels to pace the move. New zones will be created as the market continually moves up.
I don't think it's gonna stop any time soon with the economy devastated by the Coronavirus. This is ongoing. So this is may give god the opportunity to keep rising over time.
The most I'm looking for is a pullback before continuing up. I marked up targets for the short if it comes into play longer than expected. Here ya go:
BULL TPS:
• 1754.14
• 1769.64
• 1795.30
BEAR TPS:
• 1733.84
• 1725.92
• 1701.70
• 1686.70
Can We Stay Bearish?What I'm looking for this week is to see if the bearish momentum will continue longer or will we begin an uptick for a little while. The overall move is bearish, but I'm looking for that to change if it can come back to 1.22093, or make it to the monthly zone around 1.18937.
Otherwise, go bears!
BULL TPS:
• 1.21933
• 1.22889
• 1.24148
BEAR TPS:
• 1.20485
• 1.20022
• 1.19224
• 1.16804 (this is a stretch TP pass the monthly)

Retracement May Continue This Week For Now...This may still be a giant retracement for the time being. Waiting for it to get to the monthly zone 1924.42 area to determine the bear continuation or keep going up where price did its big dip.
BULL TPS:
• 1913.44
• 1919.12
• 1924.42
• 1941.64
BEAR TPS:
• 1888.42
• 1886.14
• 1846.39

INTEL now is a big opportunity!NASDAQ:INTC
* Declines stopped at a long-term weekly support line
* After a 37% drop, a huge company - so in my eyes this is a great opportunity to buy the dip.
* Breaking a small triangle descending
* A stock breaks up SMA20

ETHUSD weekly timeframe Elliot wave analysis. Long!!The new trend to the upside seems to have started for ETH against USD. Market structure has broken. The targets are represented as rectangles. Also a weekly double bottom at play. A break and close below 300 invalidates this. Also with ETH 2.0 it can see a substantial pump up soon. A good 6 RR swing trade. Not a financial advice. Hope it helps.

GBPUSD Approaching Major TrendlineGBPUSD is soon approaching a long-term trendline, which coincides with a 3 year supply zone. As price approaches this level, it would definitely be strongly resisted.
In addition, the current price is the top of a 3 year range, thus we could start looking to sell GBPUSD. Await a retest on the previous high, or wait for a rebound when price breaks the current bullish structure.