Weeklyanalysis

Baby Inverse Head and Shoulders FormedThat's looking like an inverse head and shoulders on the monthly 136.218 level, so this pair may go bullish for the week. If it cannot break the monthly level or move above 137.497, we'll be shooting for the bear TPS until the move is complete.
BULL TPS:
• 136.730
• 137.239
• 138.092
• 139.019
BEAR TPS:
• 135.464
• 134.048
• 133.071
• 131.941

Bullish Slant May Be Just A Large FlagThis move is a large slant, which is hinting this can possibly flag. So the bullish continuation may only move just to the monthly zone then continue to take a dip. If not, we'll keep ticking on up to the target BULL TP.
For the bearish, looking for the break of the trendline to play out for those TPS and keep going all the way down to the daily 1841.89 level.
BULL TPS:
• 1911.36
• 1924.42
(if TP2 is passed and retested as support)
• 1931.37
• 1945.68
BEAR TPS:
• 1888.42
• 1867.66
• 1848.82

GOLD - WEEKLY ANALYSISGOLD - On daily candles it is expected to go down at the moment, based on triangular pattern and price action it's in a SELL ON RISE condition.
My approach will be a short sell here at current price 1888, If it's moving up 1895 around I will sell more
Maintain Stop loss around 1907
Potential downside target 1865 - 1845
Follow the levels as mentioned.
Traders, if you liked this idea hit the like button & write in the comment section.
Why you should follow this tradingview account ?
Managed by top most renowned trader - Pulak Priyesh
10 + years of trading experience
Professional Day trader
Excellence award winning mentor
Professional chart, clear chart without junks.
Major S/R levels with inner insights
Frequent Day & Swing trade levels
All major and minor FX/INDICES covered
Thanks !!


Possible Retracement Before ContinuationThis pair looks like it has a huge retracement due this week before continuing for the short. Retracement may end in the 1.79129 zone before the short continues. If not, we'll keep going up to the next zone above for a fresh to test the last lower high.
BULL TPs:
• 1.78192
• 1.79129
• 1.80512
BEAR TPS:
• 1.75881
• 1.75308
• 1.73815
• 1.72856

Is there a head and shoulders forming on the NZD/USD?? I am hoping for a break towards the downside on the weekly. So will the rate decision take it in that direction? Eventually I would like to see a complete head and shoulders on this pair.

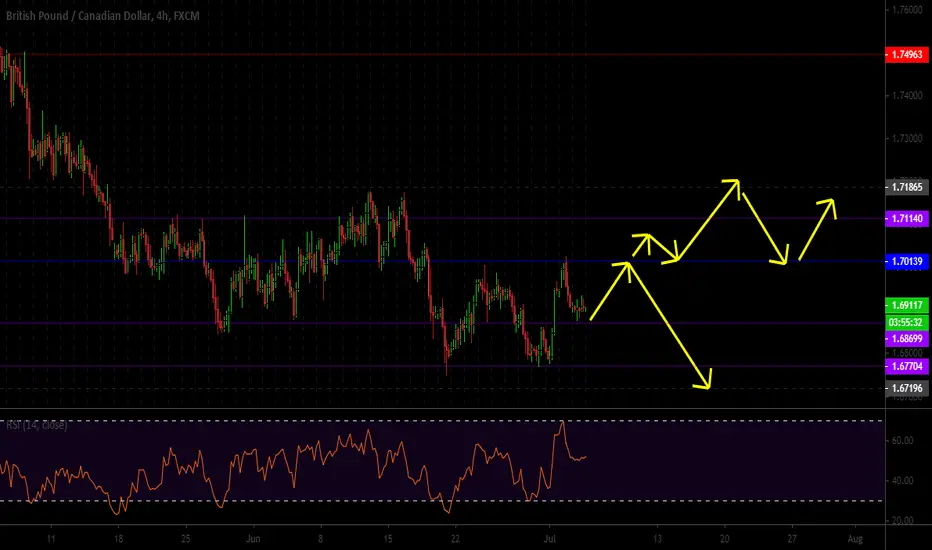
Weekly Key Level SetupThis pair is currently in a multi-day 4hr range and sitting on top of a weekly zone around 1.70366. A weekly zone means a large push whichever way the market chooses (I hope it continues up). So let's enjoy this week's move. Hopefully this is the week it performs a breakout.
BULL TPS:
• 1.70968
• 1.71684
If it breaks the daily zone….
• 1.72830
• 1.73672
BEAR TPS:
• 1.68864
• 1.68433
• 1.67685
• 1.66399

Key Level Trade Setup -- Major Resistance Level May Be RespectedFirst, this is nice that it's sitting on a weekly key level. Second, where price stopped also looks to respecting a major level of structure according to the daily.
I'm looking for another short overall. But, as we know, price does what it wants. So if it does decide to perform a pullback into a continuation, those TPs are in place too.
BEAR TPS:
• 139.698
• 139.164
• 138.236
• 137.708
• 136.542
BULL TPS:
• 141.621
• 142.320
• 142.768
• 143.718

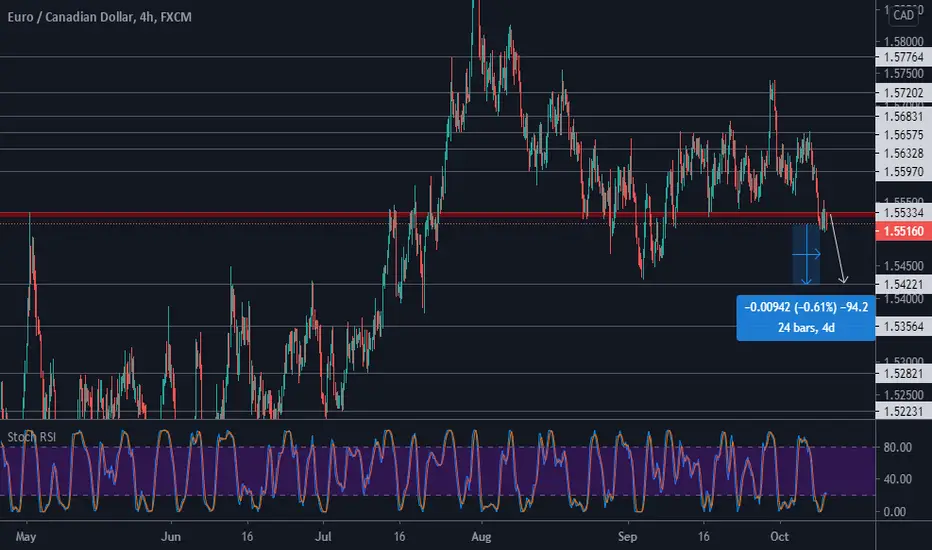
Depends If The Bearish Trend Can Be Broken This WeekThis pair actually has been fun. It's spent multiple weeks in consolidation just to do it up massive uptick that made me so proud. Then it pulled off this beautiful short, that actually looks like a giant pullback at first glance on the higher timeframes (daily, weekly).
When it hit the daily key level zone at 1.54626 and bounced off as support, it actually respected the several-week major consolidation area and looks to be positioning itself to break the bearish trendline, or to respect it and keep tumbling on down.
This is my favorite pair so I am just going to rock wherever it goes. Lots of pips either way.
BEAR TPS:
• 1.54812
• 1.54058
• 1.52947
BULL TPS:
• 1.56837
• 1.58161
• 1.59955
• 1.61280

Consolidating Getting Ready For A Bull Run?This pair looks like it's setting up for a bull rally further up this week. We were in a lengthy consolidation period. This may be the week after seeing this juke move that we do the climb up. Gonna play this out and see how it want to make the most of this false breakout.
BULL TPS:
• 1.82712
• 1.83971
• 1.85170
BEAR TPS:
• 1.81321
• 1.80812
• 1.79466
Trades that are still active until all bull/bears TPS hit…
EURCAD
XAUUSD
GBPJPY

Bearish Harmonic May Resume to Complete A Bigger Formation....I actually took this trade last week when I saw a harmonic setup while cruising the charts. This harmonic may still be respected this week.
Scaled up to the daily and saw what looks like a giant inverse head, neck, and shoulders forming. So TPS are based on both the harmonic and when the move may be complete.
BEAR TPS:
• 1.72928
• 1.71914
• 1.70498
BULL TPS:
• 1.73973
• 1.74797
• 1.76834
Trades that are still active until all bull/bears TPS hit…
EURCAD
XAUUSD
GBPJPY

Weekly Analysis Resumes This WeekHey all!
Been a bit under the weather recovering from injury.
I'm resuming weekly trade analysis each Sunday on what swing trades I'm paying attention to throughout the week.
Here's how I view the charts:
I'm looking to see if I can find the price's overall move for the week with each pair.
TPs will be posted based on how far I think price will move before it does a pullback or continuation.
I don't pick one direction since market and world news can be unpredictable.
The sole focus as a trader is to get in front of the move by using the zones I mark for entry and exits.
Need more help?
Leave a comment or direct message and I'll respond to messages each day.
Let's Make Some Money Traders!
Much Heart

BTCUSD Overvalued Measured In Gold + Retracement To Fill GapBTCUSD looks overvalued when measured against Gold XAUUSD. Divergence can be seen on the weekly chart from two different points in the past. There is also a gap that has formed in the BTC futures market that also needs to be filled. So i'm hoping these two factors combined will offer a pullback in BTC to at least fill the gap somewhere between $9,500 - $10,000.
Note we need the weekly candle to close bearish to confirm this divergence.

EUR USD - Weekly viewWe are in a point of major resistance on EUR USD. Price has reached the confluence between major trendline and resistance level.
I'll wait and see what's the next move of the price before taking action.
What is your opinion about EUR USD?
Please LIKE this post if you agree with my idea.
THANK YOU!


Swiss Performance IndexDaily Chart on the left side
After the drop it had nice recovery, followed by a sideward movement which the index left in the last days
Passed through the resistance at 12’556.21 (horizontal line) and at 12’572.12 (76.4% Fibonacci Retracement)
Golden Cross a few days ago
Weekly Chart on the right side
Uptrend since a few weeks
50 MA turned back upward
It looks as if it will soon reach its high of 17 February.

WEEKLY ANALYSIS EURJPY SHORT SETUP!! BREAK OF A CHANNEL!!Good day trader, I hope you have a great day ahead and start off your day with a good trade!
Start off with EURJPY, as shown on the chart above, you can see a break of an upward channel. Therefore, bear is most likely to take place and before a strong bearish movement, a correction is expected to take place.
We will be looking for sell opportunity at 50% and 61.8% fibonacci retracement zone. A push to -27.2% is most likely to happen if price reject EMA 55.
Sell limit: 121.118
SL: 121.500
TP 1: 120.30
TP 2: 119.826
Always go for a clear analysis and make sure to have a proper risk management for yourself. Happy trading traders!

Are We In Process of Forming Inverse Head and Shoulders?This looks to be in the process of forming an inverse head and shoulders pattern. So will trade with the move over time. I actually want it to go bullish, but we need a strong confirm for that to happen. So let's what happens. I also have to update my map. That's why you don't see the zones just yet.
BULL TPS:
• 1.69934
• 1.71040
• 1.71708
BEAR TPS:
These are based on where the arrows are.
• 1.71234
• 1.70286
These are below the weekly level
• 1.68816
• 1.67831
• 1.67196
WEEKLY ANALYSIS! XAUUSD OUTLOOKGood day traders! Wish you all have a pleasant weekend and do enjoy yourself and happy trading!
XAUUSD H4 timeframe, on last Friday, price has strongly rejected the trendline and EMA 55 (as expected) and break above 1765. Coming week, we believe that gold would continue its bullish rally to 1800 (ideally) due to fundamental news and technical analysis.
Therefore, as long as price remain within the trendline (as shown), we will be looking for long opportunity at 1765 and expose to 1800.
Entry Price: 1765
SL: 1750
TP: 1800

Can We Continue Up Or Return To The Trendline?Wow! What a nice trendline bounce we had last week! Looking for some more action this week by seeing if we can keep the bullish pace up to the monthly level or make a return to the weekly zone, but this time to break through the trendline and let the bears take over. Now I am seeing a potential double top trade for the short when we reach the first bull tp. But let's see how things play out.
BULL TPS:
• 1779.64
• 1789.82
• 1805.30
BEAR TPS:
• 1760.44
• 1754.14
• 1739.48
• 1725.92

Is This a Giant Pullback?From the daily timeframe, it looks like a giant pullback for the bull. But I need to wait for it to hit my zone to get a confirm if that's what I'm looking at. Until then, move with the trend.
BULL TPS:
• 1.24148
• 1.25035
• 1.26343
BEAR TPS:
• 1.23018
• 1.22306
• 1.21150
