What Actually Happened To Bitcoin Price Action EditionSo I decided to see why this big ol' drop is happening with Bitcoin.
The answer?
We're filling a very old order block that was never
completed in July 2021. So it makes sense price has dropped ALL the
way to where we are now. Time to analyze where we may be going from
here.
According to this current situation, once the years-old order block is
retested, we should make a long push back up to the 38810.05 weekly
zone since it was never retested on the 4hr. It just dropped like a brick.
If we are not ready for the giant uptick back up yet, and we
breakthrough the monthly 28990.63 zone, the next pivot area will be
24337.80 daily zone. We're about to find out what happens.
BULL TPS:
• 32788.17
• 34337.72
• 35504.62
• 36622.43
• 38810.05
BEAR TPS:
• 29315.72
• 27774.40
• 26233.07
• 24475.42
Weeklyanalysis

HDFCBANK LONGNSE:HDFCBANK can be good choice for swing trade for a couple of weeks as it made an inverted hammer on last week on weekly chart, and closed above the inverted hammer's low point.
A good support zone for this stock is at around 1300.
Trade Details:
Entry: below 1310
Stop Loss: 1280-1285
Target: 1405-1410
Holding Period: 2-3 weeks
Happy Investing :)

LINK in weekly TimeFrameLINKUSDT have a curve bearish line for a several weeks, its on a weekly support of fibo 2.618.
as you can see, if RSI can breakout above of Bearish trendline, price can grow up
in MACDs Histogramwe have positive divergence, if macd line can cross signal line it is a good point.
BUT if we still on bearish market LINK can move down to the weekly fibo level 2.0 at 3.35$ price !!!

Short Idea for AUDUSDThis is an analysis from a weekly perspective, expecting pair to fake out/ break out above the resistance zone, then to come down for a week to POI, 2 entries set, the lower entry will be executed if the chart does a fake out (OTE) while the higher entry will be executed if the chart doesn't break the current resistance.

Comparison of BTC bear markets (2015,2018,2022) Part 2You can see the second, third and present fourth bear markets on the chart.
The second and third had the same pattern of three movements (waves) down:
1. 0 - A
2. B - C
3. D - E
I depicted the same movement in the present situation based on 200 days of EMA and MA.
And here are such exciting historical circumstances. Look closely at the previous bottoms of 2015 and 2018. They were formed between 200 EMA and MA.
We can make our biases based on history and predict that price will build something similar this time.
I also drew arrows showing where strong wicks were in the past and the range of these movements and compared them with potential wicks that we can expect shortly.
May the profit be with you!
P.S. I will write the third part with my conclusions.

Facebook: weekly analysis overviewFacebook it's look bearish from this point that we could to short right now, but this will be my perspective following the technical analysis. And very important combine it with fundamental analysis.
As I see, the U.S. Dollar found out a tightening of the hike interest rates and stock market and cryptocurrencies it's suffering right now!!!
For that, I analyze Facebook in my idea to take a perspective to know. For what I see, this movement will be bearish toward $130 USD per share.
That it's my own opinion to trade stock market.
Also, this will be the first time that I trade and work with stocks to trade. I come more from Forex market, and also my 2nd favorite market it's cryptocurrencies. As I know very well Fore and cryptocurrencies. i want to trade stock market, but very enfocous and combining with fundamental analysis always because it's my way to trade stocks as another financial market. But I'm interesting to trade stocks for first time now!!! But also, I want to take course more deep about stock market to learn more. I know very well Forex and cryptocurrencies very well and how they move it.
I hope that this idea support you!!!

Position & Swing Trading: Weekly ChartsIf you're position or swing trading, it is a MUST to study weekly charts to confirm:
1. IF a bottom is developing
2. WHERE the bottom will complete
...to plan trades with strong reward/risk ratios.
For example, let's take a look at EGLX, which had a gap up at open on its earnings release:
1. Note that today's gap up is from a lower low in the downtrend. This particular bottom is not confirmed just yet. When it makes a higher low is when there will be lower risk for an entry.
2. The first resistance is at 3.27, but there's stronger resistance at 4.44--once the stock's price sustains that level, then the bottom will be complete, which is the best time to consider position trade entries.
Both resistance levels should be considered for swing trading potential...
First ask: "Are there enough points to gain from your entry point to warrant the risk of the trade?" If no, then move on to the next opportunity; maybe put an alert at the next resistance level to revisit. If yes, then which resistance levels are likely to cause profit-taking?
A step-by-step checklist that looks further than the entry is important for not giving back profits just as soon as you make them. Learn more at my website.

Ethereum: weekly analysis overviewWhat I found out in Ethereum price it's crashing too their price and it's below of $1,900 USD.
I hope a crash to $1,100 USD approximately in their price, that will be the first support, And to take note, we could to see a chance to see Ethereum price round to $785 USD if the key and first support breaking down the zone of $1,100 USD.
And then, this it's the monthly analysis timeframe and I see a bearish perspective in the price showing this model of chart that I draw.
Also, Ethereum price it's very key to look their rally in the next year and starting to accumulate Ethereum to make compound interest by year to accumulate enough Ethereum by long term and use them Ethereum to create another portfolio in cryptocurrencies.
One of my favortie altcoin that I want to accumulate it's Cardano by long term.

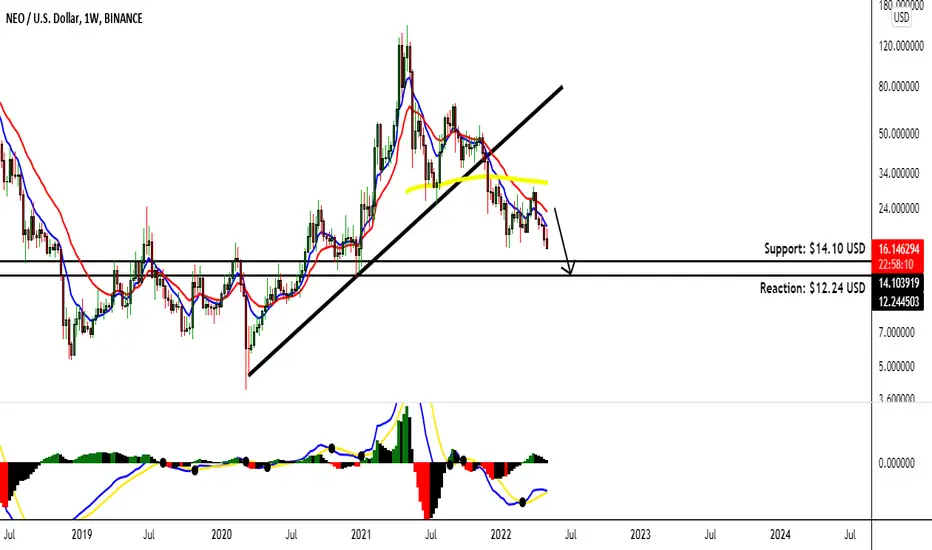
NEO/USD: weekly analysis overviewNEO it's in the bearish movement and this cryptocurrency it's leading to the $12 USD approximately and we could to look a bearish movement in the weekly timeframe.
I hope that this idea support you!!!
RCF very bullish breakoutRCF has been consolidating in a tight range from last 1 year and it has finally managed to breakout of it with very heavy volumes.
If todays closing is above 92.5, RCF is a good positional trade for minimum targets of 100, 110.

Nifty Weekly AnalysisThis Analysis is not a trade recommendation, this study is purely for education purpose only, Do your own Study and Research before getting into any trades.
NSE:NIFTY Weekly Analysis.
Currently Nifty is showing weakness on chart:-
1. Did not touch the upper Bollinger Band.
2. Continuously decreasing RSI.
If it fails to get support at the 20 SMA line, then there is a chance that nifty may touch the lower Bollinger Band at S3

GBPUSD important support area ...Hello Traders , if you see GBPUSD in weekly tf , you'll understand that it is in an uptrend and the last higher low is where exactly the price is now !
If a breaking of the structure happens in this support area , the weekly tf uptrend will be invalidate.
I see the major momentum says the sellers are stronger than buyers and in the very last candle there is a full bear candle which means breaking the structure is more possible here ...
What's your Ideas ?

SOXL - Long Shares Play - Quadruple Bottom on Weekly TimeframeSOXL has reached a major bullish level here, with great possibilities for calls/shares.
Chart Event: Quadruple Bottom on Weekly, Double Bottom on Daily
Confluence:
Rising volume each time price action nears this level
Bouncing neatly at weekly 200EMA
Strong weekly bullish divergence
Strong daily bullish divergence
Chip shortage continues to benefit chipmakers
Falling Wedge on 65m
Trade Idea: Calls/Share Swings
Price Targets:
PT1 - $30.50
PT2 - $32.00
PT3 - $33.00
PT4+ - $35.00

Lichsg finance looking bullishLichsgfin has given trendline breakout.
Looks like a good swing pick if it closes above 406 tomorrow for targets of 450-455.

DOT/USD: Weekly outlookPolkadot it's showing us a strengthen in this bull trend that we could to find up during next weeks a upside trend. This it's a quickly shortly analysis of my weekly outlook and I have that DOT it's look bullish from the previously candlestick in this timeframe.

A sign of trend reversal in AMC? The Elephant in the room...NYSE:AMC
I'll keep the write up short and let the chart speak to you, but a few observations here that a lot of people just won't talk about:
1. Since the runup to $72 AMC has continuously set lower highs.
2. From the peak of $72 in June to the end of November, AMC was successful in countering the lower highs with higher lows.
3. End of Nov AMC broke its major structure created during the run up in June. This pushed AMC to a ascending parallel channel created by the Feb runup, retracement, and the initial kick of the June run.
4. Price discovery During June-Nov respected the entire range of the first June weekly candle.
5. Again, Nov we see a break down out of the Alpha structure to its predominate structure. This was a a warning sign - IN RESEPCT TO TECHNICAL ANALYSIS ONLY.
6. This is when Lower Lows start taking place, working with the lower highs to push the price discovery back down to the range of the last May weekly candle.
7. Dec-Jan we see a case of larger price range as compared to the candle bodies, showing indecision and buyer exhaustion. The first candle body to close outside this range pushed the price down to a new (most current) range. Lower lows and Lower highs have continued through this period.
8. It is also important to recognize the level of support that was broken (created during the Jan - May run. This support and the broken support during June-Nov resistance creates a channel - keep this in mind going forward.
9. Overall, since the run up, AMC has found that is it trading at lower and lower consolidation levels.
and lastly....
10. Not one weekly candle body has closed over its active consolidation levels since June 21'. UNTILL NOW. This in mind, outside of EVERYTHING ELSE besides this chart, its a very positive indication for AMC. This has NOT happened since BEFORE the June run up.
Continued...
I thought I could stop. I can't.
What I am looking for as CONFIRMATION of my bullish feeling (not letting my emotion get to me this time) is a weekly candle that does 1 of 2 things:
A. Closes above the swing high created in Dec - this would be >$30 - This is honestly a very hard feat in 5 trading days. This though would not only break the LLLH trend but also push through the descending resistance created at the top of the Jun run AND push through the ascending level of resistance (once support but broken in Jan 22') that creates the lower part of the ascending parallel channel. This is BEST case. This is also NOT as probable as scenario B...
B. A weekly close slightly above the 2 mentioned levels of resistance. This is more achievable in my mind from a PURE TA perspective. It won't be easy. Keep in mind the REALITY of the chart. LL, LH - multiple structure breaks to the downside. These are facts.
We must talk about the elephant in the room...
I will keep this short. Look at the chart, find the next (lower) structure). Until the trend is officially broken, it is telling us that the next structure sellers are targeting is $8.93-14.05. Yes I said it. I will also say this: it is more probable than scenario A. The fact that we got a weekly close out of the current range is a GREAT SIGN that buyers are stepping in again. I suspect major resistance at $22-24 (in regards to this week only). Lets recognize the dilution factor. 5x since the Jan 21' runup. Even at current prices (when compared to the $72 high) the company is MUCH more valuable. It is simple math. The amount of buying pressure needed to get back to this price discovery would need to be MUCH greater than the prior buying pressure. THINK ABOUT MARKET CAP - especially when creating a personal PT. This is a cold hard question that NEEDS to be asked: can a company that runs from dollars to the low 70's sustain that price discovery under the conditions of dilution. This was AMC's biggest "hiccup". Yes this is a fundamental argument, but it DOES factor into TA. In TA you need a PT and SL to create a trading plan - market cap MUST be considered. Keep this in mind going forward with AMC.
Disclosure - I am LONG on AMC and have been since Jan 21 <$5 and I have been selling covered calls since NOV when I first noticed the major trend changes - this has served me VERY well and has put me in a position that I was able to accumulate more AMC at $20. Although I will not participate in calls this time, I will slow my selling of them. I LIKE what I see STARTING to develop but I will be PATIENT as to NOT get too excited...yet..until I see what the EOW brings. Please consider the fact I am not taking into consideration ANYTHING outside the chart..
I did not keep this short. No pun intended.

ETH/USD: Bull rally 2022Etheeum forming this accumulation zone in the past days and this was a good news because we break up this price action to the bull reversal. We're leading to the next bull rally.
So guys, from that previoulsy candlestick, we forming htis bullish signal that Ethereum it's ready to take over to hit their historical price maximum almost $4,900 USD. And we're ready to use it to apply now!!!
Invest widely in cryptocurrencies. If you like trading in cryptocurrencies. I suggest to prove day trader and swing trader in cryptocurrencies to hold posiiton toward long term. They're good strategy to find up profitable in the time.

GBPUSDAiming to following the bearish trend and short.
I will move my SL to BE once my TP2 has been hit.
I will also watch how price reacts against the weekly support zones just incase price goes against me this is why I aim to take 25% at each RL1 so even if the trade goes against me I make some money.

2 Possible long scenarios for NZDUSD this weekH4 SZ >> Red
H1 SZ >> Purple
m15 SZ >> Pink
H4 DZ >> Blue
H1 DZ >> Dark Green
m15 DZ >> Light Green
*Always remember to manage your risk.

Euraud Buy idea from 14-02-2022. trade already activeHere We share with you a trade idea on euraud.
There is no much information fundamentally.
Technically, after a massive impulsive fall on Euraud, we saw a bullish weekly candle at a key demand zone, looking further to the daily charts we saw a bullish pin bar (Hammer) giving us reasons that the Euro may be looking interesting for a buy.
Because, we over here had already taken a buy position on this trade, we added in the analysis our entry, stop loss and expected target profit.
Let's go take some risk, let's go make some money.

Weekly Strategic Support and Resistance - 3-13-2022Join me for my Weekly look at key Support and Resistance Levels on Bitcoin, Ethereum, Solana for cryptocurrencies... S&P 500 and Nasdaq for stock market indexes... Gold, Silver, Oil, Wheat, and Corn for commodities... Apple, Google, Facebook, Tesla, and Amazon for stocks.

GBPUSD weekly forex analysis and education for 14-03-2022The idea shared is an analysis of GbpUsd for a mid term swing.
Fundamentally, The Usd is still showing strength owing to the recently released
NFP reports. Next week will shall be keeping an eye on interest rates desions.
Sentimentally, As the UK enforces hard economic sanctions as a result of Russia's
involvement in Ukraine, sanctions placed on one of the biggest economic contributors
in Europe (Russia), Investors are likely to be skeptical backing the British pounds. For this pair, the Usd is favoured.
Technically, the pair just broke a structural level on the Weekly charts
with the recent demand zone broken (refer to our previous analysis on GbpUsd), a supply zone also
created on the 4hr chat time frame. It is expected for price to fill in the supply zone and then continue downwards.
On the Daily charts as seen too, a support structural level has been broken, price may have to retest that level and face
resistance there for a drop in price.
Our sentimental bias hence is to watch and plan for a sell trade on GbpUsd .
Let's go take some risk, let's go make some money, Millionaire Logistics.

💵EURGBP: A Higher OverviewHi Everyone!
Here is a higher timeframe overview of the EURGBP. As you can see we are at a Key level of support at the 2019/2020 lows, and the bottom of a ranging market since October 2016. You would also notice the Strong RSI Divergence as well, this does not mean it would definitely start going up. When there is momentum in the market it could take time to swing into a uptrend, we need valid setups to confirm a reversal. Its best not to try and catch a faling knife.
At the moment we will have to wait and see what the market will do at this level, if it finds support as before we can expect a nice rally to 0.87 zone over the next couple of months, if the support zone fails we could expect a further correction to the 0.81400 - 0.81300 area.
We would be happy to hear your thoughts on the pair.
Happy Trading!
