EURUSD About to End ConsolidationLast week, EURUSD has undergone a ranging market as it continued to trade within a symmetrical triangle.
It is also noted that the consolidation came after a bearish trend where we saw the price coming off from a 33-month high.
We also noted that the price has been constantly resisted below the 200 and 60 MAs, and a harmonic pattern was formed at the end of the month in the H4 chart.
And since we expect the dollar to turn bullish in the coming month, we also expect the EURUSD to start forming a bearish trend after a full month of ranging market.
We can start to sell EURUSD at the start of the week, betting on a strong resistance at the top of the symmetrical triangle and a bearish harmonic, expecting the price to reach and retest the demand zone at 1.2060.
If EURUSD manages to reach 1.2060 and continue to trade lower from then on, we are expecting a stronger bearish trend towards 1.19 by the end of Febraury.
Weeklyforecast

Dollar Continues to Find SupportThe dollar has ended January with a relatively small bullish candle, showing signs of support and an end to a 2-month falling trend.
In the month of January, the dollar started the month with a slightly bearish tone, bringing the currency to a 33-month low.
It then started to reverse and rebounded strongly until it faced strong resistance at strong supply 90.8.
However, the reversal was short-lived and it quickly found support and gain traction upwards, making another attempt to break above the supply zone at 90.8.
That didn't work out as the price was resisted again but somehow manage to close somewhere just below the resistance.
In the end, January left us with an inverse head and shoulder in the daily timeframe, and a sign of reversal, or rather a pause, in the monthly timeframe.
Since that's the case, and since last week's Fed did not show any sign of easing monetary policies any further in spite of a dovish ECB in the same week, we think the dollar is ready for a bullish February.
We will look for buying opportunity if the price stays above 90 and until it reaches 91.8.

XAUUSD - Price Forecast Hello everyone,
A quick update on XAUUSD.
A weekly close below the 1880 level last week meant the bearish sentiment has continued.
There is a possibility that we see a bullish move up towards that level today before market close. However, I think that will be less likely if price moves down lower and manages to break the 1820 price level first. This level if/when broken will likely flip support into resistance and provide the platform for a sustained move downwards with price going onto test the 1765 swing low.
On a slightly longer term, a lower low within the 1670-1720 zone is still a level to be aware of. This is also where I think we could see the Wave 4 correction completing.
Who's Elliot?
The primary wave count is still the same, no changes on that front. Please see the linked ideas below for the wave count.
Once again, staying aware of some of the possibilities. Let’s see how it plays out today and into the forthcoming week.
Follow for further updates. Your 'likes' are much appreciated and your comments are most welcomed.
Thank you for taking the time. Trade Safe!
Beyond Edge
Disclaimer
This is not trading advice. All content/ information shared in this idea is purely educational in nature and is expected to be used for informational purposes only and should not in any way come across as a recommendation to buy or sell in these assets.
You should do your own research and analysis before making any investment decisions. Do not trade or speculate based on the information provided in this idea.
Trust your own analysis.
Beyond Edge

GBP/AUD Analysis Jan. 24, 2021Welcome back! Please support this idea with a LIKE if you find it useful.
** GBP/AUD will continue to rise to 1800 zone.
We recommend that you keep this pair on your watchlist and enter when the entry criteria of your strategy is met.
Click "Follow" on our profile if you'd like these trade ideas delivered straight to your email in the future.
Thanks for your continued support!
Brian Kenya Horton, BK Forex Academy

Gold Inverse HnS after Strong PullbackAt the beginning of January, we saw that the gold price has broken above a 4-month falling channel.
After which, the price pulled back strongly and continued to find support at 1820 which has lasted for the past 2 months.
In the midst of it, an inverse HnS was formed last week and the market closed with a bullish weekly candle.
If the price were to fulfil this pattern and climbs, it will be the second breakout of the 4-month falling channel and could possibly signify the end of consolidation and the beginning of a new trend.
While nothing is certain, the current market condition does favour a gold long with a very rewardable risk-reward ratio.
This week, we shall look for buying opportunity as long as the price stays supported above 1830, until it reaches the supply zone at 1900, and hopefully it will retest the key resistance once again at 1956.
Otherwise, we could see the gold falling all the way back to the previous support at 1770.

EURUSD Rejection from Range TopJust like the dollar, EURUSD was rejected from an extreme high near the top of a 4-year range, also after completing the 5th Elliott wave.
Last week, EURUSD found support and rebounded off from the current range bottom at 1.2050 which also caused a break above of a falling trendline.
And again, just like early 2018, we expect the price to range further and thus a rejection from the range bottom signals us to look for buying opportunity.
We shall look for buying opportunity until it either breaks below the current rising trendline (around 1.2120) or climbs and reaches 1.2285.

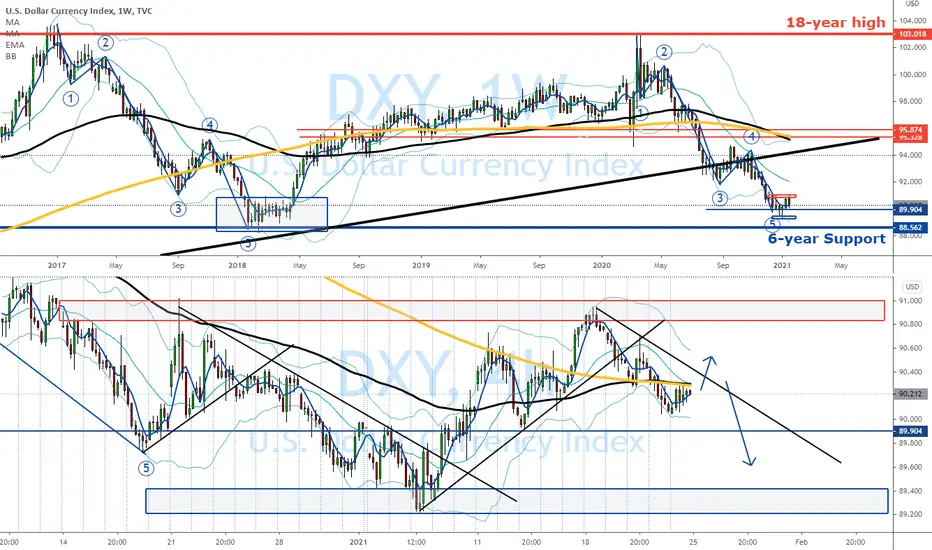
Dollar Rejection from Range TopSince the dollar has reached the bottom of a 4-year range while completing a full Elliott wave, the price has begun a sideways market.
As seen in early 2018, it took about 3 months for the ranging market to be completed and broke out into a trend.
As of now, the dollar seems to have confirmed its range top and bottom at 91 and 89 respectively.
Last week, we saw that the dollar was rejected at the range top and started forming a downward trend.
Therefore, we will continue to sell the dollar this week if the price continues to stay resisted under 90.5 and until it reaches near enough to the range bottom around 89.7.
HBAR FIRST WEEKLY CLOSE ABOVE RESISTANCE!I'll cut straight to the point as this is a super exciting development for Hbar. You will notice the debut week in September 2019 it plummeted down to just 3.8 cents. Since then it has tried multiple times to go higher only to find rejection at the $0.054 level. Wicks have gotten above it but no body candle.
Well, for the first time ever the weekly close that just happened minutes ago managed to close ABOVE (purple line) resistance! This is super bullish and I expect fireworks for upwards movement in price the next 2 weeks. The train is ready to leave the station to higher price levels.
Remember this is only my formed analysis outlook. This is not an endorsement or recommendation to buy or sell.


GBPUSD is still in the Uptrend.GBPUSD is still in the Uptrend.
With the rebound of the US dollar index and the recent decline of non-US currencies, the British pound remains strong relative to other currencies, maintaining an upward trend. Currently, it faces the 1.37 integer mark and waits for a breakthrough.
In Jan.18 idea on the US Dollar Index and the EURUSD: US Dollar Index is estimated to have a chance to fall again after the inauguration of the new President Biden on January 20. At this time, the EURUSD will be rise.
Therefore, the same reason: It is estimated that after January 20, when the Dollar Index turns down, the upward trend of the Pound will be more effective. There is a chance to break above the 1.37 integer resistance. The current upper target is 1.3800-1.3860.
Jan.19. 2021
Reliability: 3-10 Markets Days

EURUSD will Go Long in Mid-Term.EURUSD will Go Long in Mid-Term.
EURUSD in downtrend begin Jan.06, because U.S.capitol riots let be global markets money entry U.S.Dollar (Index).
EURUSD will Go Long in Mid-Term after Jan.20 U.S. presidential inauguration, and U.S.Dollar index will downtrend.
Jan.18.2021
Reliability: 3-10 Markets Days

The U.S. Dollar Index rise in the short-termThe U.S. Dollar Index (DXY) rise in the short-term, but will downtrend in the long term.
Jan.06 2021, U.S.Capitol riots
U.S.Dollar index rebounded, because capitol riots that be global markets money entry U.S.Dollar.
U.S.Dollar index rebounded until Jan.20 presidential inauguration, and U.S.Dollar index will downtrend.
Reliability: 3-10 Markets Days.

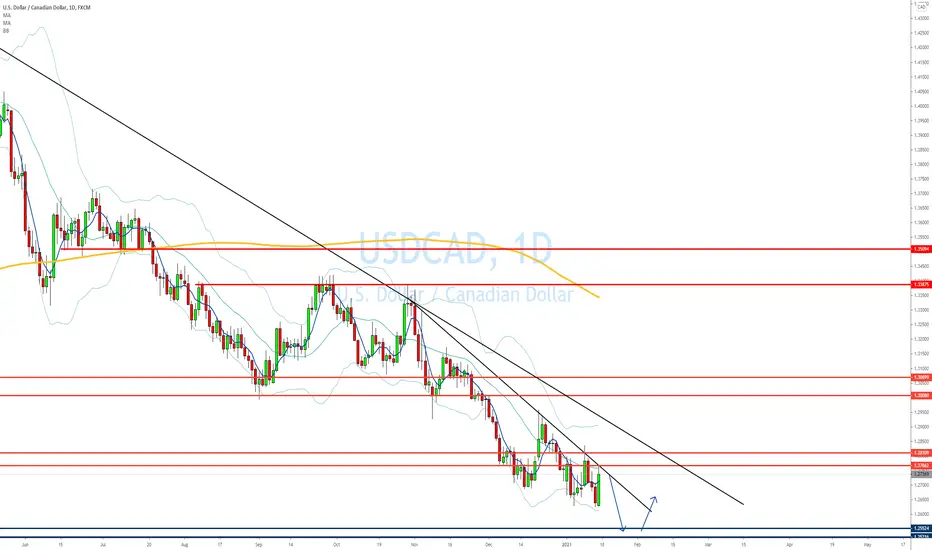
USDCAD Approaching Demand ZoneUSDCAD has been on a steep descend recently breaking a long-term demand zone. However, price can be observed to be slowing down, while approaching the next demand zone. Should price be supported at this level, we could expect a larger pullback. Price is currently still being resisted by falling trendline, thus we could still sell USDCAD to the next demand zone.
EURUSD Short WeeklyMonthly is in clear downtrend and rejecting a clear key level.
Weekly candles reject monthly resistance, followed by a a bearish confirmation.

XAUUSD - Price ForecastHello everyone,
XAUUSD doesn't appear to be out of the woods just yet. The bearish outlook is taken from the daily price action since last week, with the impulsive moves down adding further weight to the bearish sentiment.
I don’t think the correction is over as the price action upwards is still playing out in a corrective nature. 1880 is the key price level for me and I am looking to see where the weekly closes are from this price level. Last week presented a gap on market opening and saw price rally from the 1898 up to challenge the swing high at 1965. The challenge failed and price fell back beyond that gap and more importantly below the 1880 level for a weekly close at 1849.
It’s possible that we’ll get a challenge towards the 1880 level this week but a further move down to test 1765 swing low and possibly lower looks a stronger possibility now than it did last week.
Simply staying aware of the possibilities. Let’s see how it plays out for the rest of the week.
Follow for further updates. Your 'likes' are much appreciated and your comments are most welcomed.
Thank you for taking the time. Trade safe!
Beyond Edge
Disclaimer
This is not trading advice. All content/ information shared in this idea is purely educational in nature and is expected to be used for informational purposes only and should not in any way come across as a recommendation to buy or sell in these assets.
You should do your own research and analysis before making any investment decisions. Do not trade or speculate based on the information provided in this idea.
Trust your own analysis.
Beyond Edge

SPX'S Weekly Japanese candlestick signals since inception 1957 Hey Traders ,
what's up. From me to Humanity . I know that there is allot of data, i hate that as every one else does. But,
if you want to keep it simple just study, analyze and write down the Red & Green boxes they should sum up most of the study. I have included all the
data here . So feel free to redo, redistribute, reuse or shar it here or outside of tradingview with anyone even with out mentioning the source. from me
to humanity whom are trading SPX : - ). Moreover, If anything that this data is telling us in a very short English terms "Do not chase tops on weekly candles !!! " .
Also, some weekly candles could be treated as extinct data suggesting that !!! what's up with that!!! no Golden rule for these candles.
--------------------------------------------------------------------------------------------------------------------------------------------------------------------------------------
1/ Bullish weekly candles :-
Weekly Bullish Happened success rate Max profit Max cost Risk/reward starting date.
--------------------------------------------------------------------------------------------------------------------------------------------------------------------------------+
***Engulfing 28 60% 50% 43% D 1953
***Hammer 21 77% 102% 4.55% C+ 1952
***Inverted Hammer 11 45% 8% 4% F 1953
***Marubozu White 65 84% 40% 33% B - 1982
***Long Lower Shadow 78 70% 68% 40% C- 1963
***Rising Window 26 85% 165% 5% B 1971
***Spining Top White 59 61% 40 % 31% F 1979
***Dragonfly Doji 8 37% 4% 9 F 1951
***Upside Tasuki Gap 6 40% comes and goes !!!
***Tweezer Bottom 11 43% Disappeared since 2007
***Doji Star 3 33% Disappeared since 1982 !!!!
***Dragon Doji 2 50%
--------------------------------------------------------
Spining Top White 59 times : since 1979
---------------------------------------------------
Profit Lost
z 4
11
z 2
4
z 13
3
z 3
31
4
17
7
z 31
3
5
21
2
2
4
z 4
2
1
z 2
2
z 1
z 5
7
14
7
11
z 10
18
21
1
z 2
3
z 7
7
3
z 4
z 3
1
z 2
z 5
2
34
9
5
z 4
25
z 2
13
z 3
15
z 7
z 4
z 18
40
z 4
12
--------------------------------------
Dragonfly Doji 8 times : since 1951
--------------------------------------------
profit lost
z 2.55
4.85
z 2.42
z 9.09
z 1.60
4.89
3.50
z 3.37
------------------------------
37% success rate
-------------------------------------------
Hammer 21 times : since 1952
---------------------------------------------------------
Profit lost
8.46
4.39
8
z 6.46
8
6
66
70
4
4
4
z 1.86
z 4.55
3.27
z 9.02
4.83
3.04
102
2.59
z .91
10.99
------------------------------------
success rate 77%
--------------------------------------------
Inverted Hammer 11 times : since 1953
------------------------------------------------------------
Profit lost
4.56
z 7.95
z 2.97
z 4.43
z 4.72
z 2.54
z 6
8.14
3.27
1.69
1.90
-----------------------------------------------------------
success rate 45%
--------------------------------------------------------------
Marubozu White 65 times : since 195
----------------------------------------------------
Profit Lost
zero 33.98
zero 14.86
zer 11.91
4.56
9.75
2.16
6.25
2.06
z 14.92
8.55
4.76
1.81
19.11
5.60
1
2.55
7
z 8.88
1.61
2.84
12.43
2.64
5.44
4.77
12.32
1.81
1.25
1.93
31.87
z 30.37
3.87
12.84
4.49
z 7.68
2.13
5.79
26.66
4.31
17.15
z 6.44
2.39
33.20
9.71
11.63
7.47
15.27
3
4.75
4.66
17.26
z 6.63
z 4
1.59
3.58
8.66
3.56
5.71
5
30.40
1
2.76
8.27
7.64
8.84
40.67
50s million signal
--------------------------------------------------
84 % success rate
----------------------------------------------------------
Long Lower shadow 78 times : Since 1966
---------------------------------------------------
profit lost
32
8
18
10
11
13
z 3.99
16.11
z 16
z 4
z 3
2.79
z 1.85
15
3
6
2
3
z 10
z 5
14
4
z 5
10
6
z 40
6
2
24
z 1
z 1
2
z 6
z 7
6
13
z 21
z 34
5
z 4
z 9
12
5
15
33
13
4
2
2
4
6
16
z 12
z 34
18
2
13
3
3
z 5
6
65
27
4
26
z 26
9
7
13
4
20
z 11
z 4
2
z 3
25
22
21
----------------------------
success rate 70%
------------------------------------------------------------
Rising Window 26 times; since 1971
---------------------------------------------------------
Profit Lost
5
2
7
5
2
1
3
z 3
12
2
4
1
1
10
1
z 3
1
19
4
165
z 5
z 1
80
3
21
4
---------------------------------
success rate 85%
-------------------------------------
Engulfing 28 times : since 1953
-----------------------------------------------------
profit lost
33
z 6.76
z 19.4
z 23.69
12.18 z
z 43.96
5.29
6.12
50.13
4
z 7
21.47
1
1
z 5.44
z 3.29
4.94
z 34.05
6.15
5.15
z 23.41
7.19
21.27
19.57
z 17.18
3.82
2.12
z 9.66
----------------------
60 % success rate
--------------------------------------------------------------
2/ Bearish weekly candles : -
weekly Bearish Happened success rate Max Profit Max opportunity cost Risk/Reward starting date
------------------------------------------------------------------------------------------------------------------------------------------------------------------------------------------
***Engulfing 67 68 % 55% 28% D+ 1956
*** Hanging Man 30 50% 7% 28% F 1957
***Shooting Star 23 47% 19% 63% F 1950s
***Long Upper Shadow 58 36% 46 % 95% F 1957
*** Doji Star 11 37% 13% 27% F 1952
***Dark Cloud Cover 13 77% 55% 11% C + 1955
****Tweezer Top 34 44% 18% 31% F 1954
*** Marubozu Blace 46 58 % 39% 48% F 1956
***Spining Top 77 35% 48% 35% F 1963
***Falling Window 23 47% 25% 78 % F 1953
***Harami 4 times 75 success rate.
***Downside Tasuki Gap Extinct 1957.
****Evening star once in 70 Years.
***Gravestone Doji once in 60 years.
***********************************************************************************************************
Long Upper Shadow 58 times : 1957
-----------------------------------------------------------
Profit lost
z 32.84
z 10.14
z 3.79
4.40
z 14.79
2.4211
33.02
5.88
z 25.74
8.74
z 7.02
z 8.71
z 5.13
z 2.36
z 14.33
z 9.58
1.76
z 6.25
z 12.99
11.97 z
z 8.74
z 1.78
z 14.58
3.74
3.74
z 5.72
z 95.94
3.98
3.80
z 3.52
1.92
4.54
z 4.29
9.49
z 4.23
z 22.70
z 4.51
z 12.29
7.95 z
z 10.31
z 32.59
z 53.98
3.48 z
z 10.72
z 3.88
z 6.80
46.87 z
3.28
z 8.86
5.28 z
4.45
z 2.60
z 26.37
4.7
z 3.22
19.47 z
z 7.87
---------------------------------------------
37 % success rate
Marubozu Black 46 times : since 1956.
----------------------------------------------
Profit lost
10.81 z
z 13.69
8.23
5.82
z 3.44
z 3.59
z 6.52
z 48
z 22.48
5.66
22.20
39.28
5.51
z 33
11.31
28.61
z 14.55
z 24.54
z 7.86
5.37
z 10.48
z 4.04
z 28.83
2.65
3.95
3.58
1.43
1.55
z 3.03
z 11.45
1.30
3.83
z 6.12
2.33
2.02
1.11
2.00
8
1.95
3.19
.077
z 8.58
z 15.88
4.37
8.36
z 4.20
--------------------------------------------------
58 % success rate.
------------------------------------------------------
Doji Star Bearish 11 times : since 1952
-----------------------------------------------
profite lost
zero 4.99
z 4.79
z 4.98
3.17
z 14.94
5.12
13.33
z 3.20
z 27.14
14.33
z 4.72
--------------------------------------
success rate 37 %
----------------------------
Spinning Top Black 77 times : since 1963.
-----------------------------------------
profit lost
7.17
z 4.46
z 1.69
z 8.07
z 7.06
z 30.32
z 13.68
z 3.32
9.79
z 4.66
19.39
z 15.47
z 14.17
z 3.94
z 2.65
z 3.7
z 2.82
z
z 4.14
1.75
6.49
z 10.14
2.78
3.27
7.81
2.45
z 3.29
22.29
z 26
z 30.35
z 34.07
z 2.86
z 17.74
z 30.71
z 19.36
z 35.35
z 2.33
11.65
z 4.74
3.34
z 15.59
2.79
z 4
z 5.17
z 24.81
z 2.27
7.74
z 4.34
6.97
z 9.32
z 20.40
z 2.59
z 5.50
z 14.24
9.92
11.17
13.33
z 8.9
13.55
48.82 z
3.07
4.91
9.70
z 27.97
36.37
z 5
2.90
z 2.54
z 20.69
z 9.08
z 7.76
z 2.07
z 5.37
z 2.34
4.08
3.81
------------------------------------
35 % success rate
-----------------------------------------------------------------------------------------------------------------
Dark Cloud Cover 13 times: since 1955?
******************************************************
profit lost
6.10
19.62
7.60
55.83
4.7
2.22
5.63
zero 9.24
zero 8.19
3.19
zero 11.98
2.12
13.54
------------
77% success
------------------------------------------------------------------------------------------------------------
Tweezer Top 34 times : since 1954
--------------------------------------------
profit lost
z 25.15
z 31.33
z 3.10
z 3.58
z 14.29
z 10.19
10.66
1.56
z 3.38
z 10.31
5.57
1.70
z 4.57
z 5.54
z 37.93
3.61
z 77.84
z 2.12
5.37
3.60
2.22
2.69
2.85
18.56
z 25.53
z 9.25
z 4.82
3.78
3.30
z 2.39
5.23
5.81
z 11.94
z 27.41
---------------------------
44% success rate
********************************************************************************************
Engulfing 67 times : since 1956
Big problem is that small dips then big
bull markets, need re examination.
-------------------------------------
profit lost
4.94 z
z 4.11
.84 z
z 11
2
.41
z 30.21
2.65 z
4.31
55.15 z
z 6.43
2.30
1.89
1.84
8.08
6.54
z 9.15
9.38
4.31
3.10
z 17.16
7.84
z 6.21
z 14.37
z 3.06
z 2.02
2.94
3.34
z 4.07
2.09
2.17
1.97
2.45
z 9.94
z 19.18
1.89
1.09
4.45
2.97
6.61
z 4.18
1.93
3.18
z 5.45
5.57
1.90
z 4.09
11.97
z 6.69
z 15.62
46.26
3.52
4.65
8.64
6.36
34.58
8.94
6.16
20.64
9.04
z 4.23
2.64
28.67
2.81
7.90
z 28.15
19.76
---------------------------------------------
success rate 68 %
-------------------------------------------------------------------------------------------------
Shooting Star 23 times : Since 195!
---------------------------------------
profit lost
zero 7.02
2.25
9.92
z 2.36
z 4.14
z 9.18
z 6.99
2.68 z
7.77
z 63.24
z 3.52
4.45 z
z 4.81
7.36
z 4.48
z 1.61
z 7.06
3.11
z 2.56
z 26.56
19.68
11.34
2.40
----------------------------
47 success rate
-------------------------------------------------------------------------
Falling Window 23 times : since 1953
come together, or during falling markets.
---------------------------------------------------
Profit Lost
18.97
5.65
z 78
25.85 z
z 60
17.63
6.92
2.83
z 3.39
z 6.12
z 6.66
z 4.63
z 1.66
z 46
1.74
z 7.55
4.80
12.43
5.01
1.62
z 116
z 2.81
z 4.47
-------------------
47 % success rate
-------------------------------------------------------------
Hanging Man 30 times : since 1957
1/ 50s was the play ground for this candle !!!
2/ sam old sam small dip then boom !!!
1996 it is a a hammer !!!not a Hang.Man
---------------------------------------------------
Profit lost
z 2.64
4.11 z
1.71
z 6.84
2.23
z 8.80
4.21
7.63
3.02
z 7.84
z 28.59
z 4.46
z 5.15
z 6.84
z 16.68
6.28
z 1.87
2.28
z .87 !!!!crash
z 5.63
3.29
2.30
6.91
z 6.38
z 2.27
3.74
z 7.60
2.02
1.50
1.12
---------------------------------------------------
50 % success rate

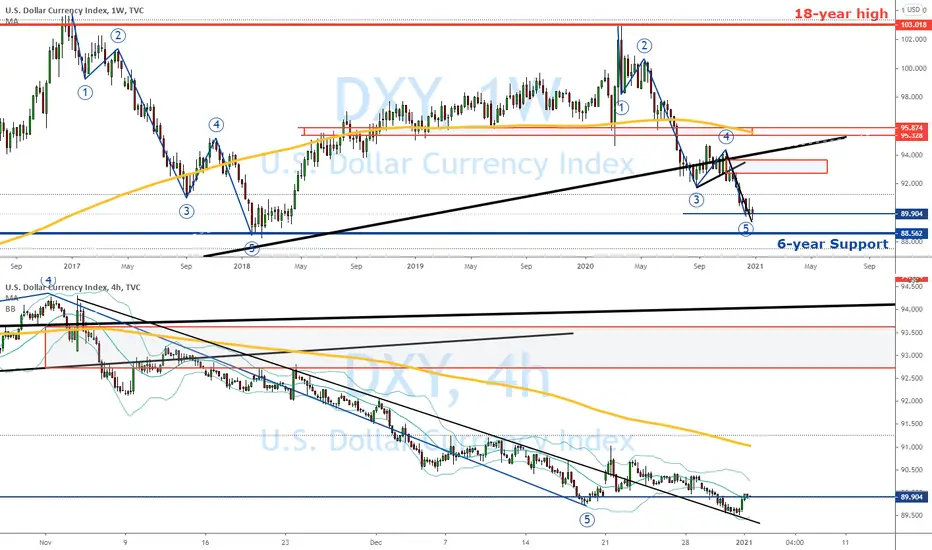
DXY Embarks on a Ranging MarketThe dollar has ended 2020 with a yearly loss of more than 7%, and more than 12% from last year March the highest near 103.
Last week, the dollar continued to fall and break new low but managed to recover and close just next to the week's opening price.
One fact for sure is that the dollar is too weak to perform another bearish trend that's significant enough.
In fact, the rebound came after it found support at a broken falling trendline as seen in the H4 chart.
While we do not expect the dollar to be strong, a rebound is almost inevitable.
We can start to buy the dollar and aim for a range high, probably somewhere nearer to 92 first.
EURUSD - Price ForecastHi all,
An update to the weekly forecast I shared last month (Nov 22, the idea is linked below). There was a pull back from around the 1.21800 level last week before moving back up and into 1.22000 yesterday.
My next target is at the 1.240000 level.
Expecting a pullback to retest the 1.21800 level before moving upwards.
Follow for further updates, your 'likes' are much appreciated and your comments most welcomed.
Trade safe and always remember to plan your trade and trade your plan!
Beyond Edge
Disclaimer
This is not trading advice. All content/ information shared in this idea is purely educational in nature and is expected to be used for analysis and illustration purposes only.
Do not trade or speculate based solely on the information provided. Trust your own analysis.
Beyond Edge

USDCAD in the downtrend.USDCAD in the downtrend.
The recent increase in oil prices has driven the Canadian dollar to appreciate.
With the continuous news about the development of the new coronavirus vaccine, the global market has obvious risk on, so oil prices have the opportunity to continue to rise.
So the Canadian dollar has the opportunity to continue to appreciate in the future.
By technical analysis , it is recommended to go short in batches when the USDCAD price bounces to the resistance.

NZDUSD is still in the ascending channel.By technical analysis , NZDUSD is still in the ascending channel . It is recommended that when the price falls back to support, buy NZDUSD. FX:NZDUSD

AUDUSD is still in the ascending channel.Recently, the global market has obvious risk sentiment. The rise in securities indexes and commodity prices, especially the rapid rise in copper prices, has led to the appreciation of commodity currencies. Therefore, fundamentals have helped the Australian dollar to appreciate.
By technical analysis , AUDUSD is still in the ascending channel . It is recommended that when the price falls back to support, buy AUDUSD . FX:AUDUSD

If U.S. Dollar Index still weak next week, USDJPY will downtrendIf U.S. Dollar Index still weak next week, USDJPY will downtrend.
The U.S. dollar weakened last week, and the Japanese Yen also appreciated with other non-US currencies.
If the US dollar continues to weaken this week, USDJPY will continue its downward trend.
FX:USDJPY

USDCHF still downtrend.USDCHF still downtrend.
FX:USDCHF
The Swiss franc , which is highly linked to the euro , will continue to appreciate if the euro continues to rise.
Therefore, USDCHF will also continue its downtrend, and it is recommended when price to rebound below the under resistance, sell USDCHF in batches.
