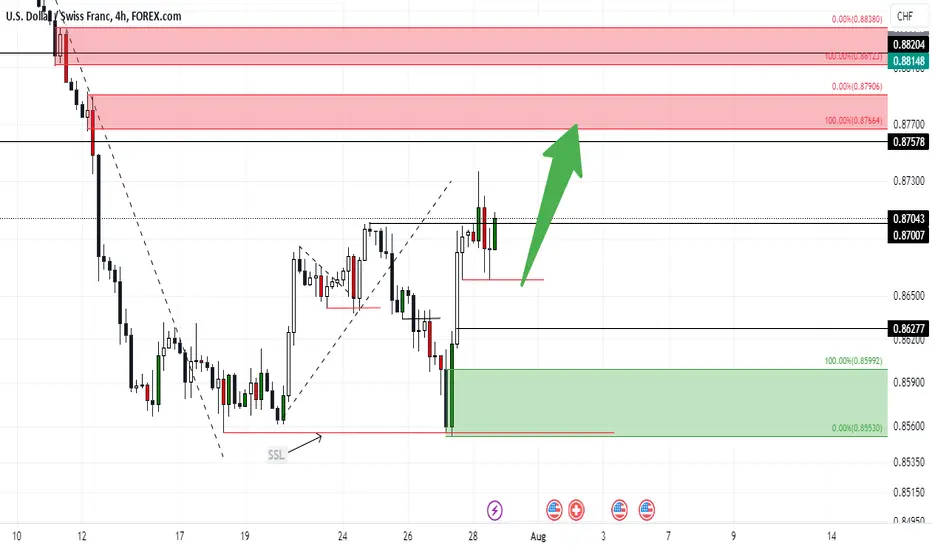
USDCHF potential BUYUSDCHF indicate a possible potential buy by indicating a bullish momentum candle, USDCHF will riseto 0.87578
Weeklymarketsanalysis
GBPUSD short-term sellafter taking the Buy side liquidity as in 1.28740 GBPUSD hence a short-term sell to 1.28067


BluetonaFX - Forex Weekly RecapHi Traders!
Forex Weekly Recap for 17–21 July, 2023:
Fundamentals
The Reserve Bank of Australia (RBA) released its meeting minutes, and the key notes were:
Considered holding rates steady or hiking by 25 basis points.
Noted the squeeze on household finances and the risk that unemployment could rise more than needed.
Inverted yield curve pointed to tighter conditions, slowing growth.
The labour market is very tight, with weak productivity adding to labour costs.
Annual wage growth is seen rising to 4% in Q3.
Consumer spending is currently weak in Q2. A rebound in the housing market will support consumption.
European Central Bank member Knot noted that rate hikes past July are possible; however, it is not certain as it looks like core inflation has steadied. Knot noted that he is optimistic to see inflation reaching their 2% target in 2024 but added that there is still a lot of key economic data due to be released between now and September.
Bank of Japan (BoJ) Governor Ueda noted that there is still some way to go for the economy to sustainably achieve the 2% inflation target and that unless their assumption on the need to sustainably achieve the target changes, their narrative on monetary policy will not change.
Bank of England (BoE) member Ramsden noted that the CPI at 7.9% is still too high despite falling significantly. He also confirmed that he "cannot rule out that the next interest rate cycle will get back to the lower bound and need to have room for new quantitative easing."
Rumours coming out of Japan noted that the BoJ is leaning towards keeping yield curve control (YCC) steady next week, citing five sources familiar with the central bank’s thinking as policymakers prefer to scrutinise more data to ensure wages and inflation keep rising. This resulted in Yen weakness, and the currency sold off against its counterparts following the news.
Key Data
US Retail Sales came in worse at 0.2% vs. 0.5% expected and 0.5% prior (revised from 0.3%).
Canadian CPI Y/Y came in at 2.8% vs. 3.0% expected and 3.4% prior, while the M/M number also came in at 0.1% vs. 0.3% expected and 0.4% prior.
New Zealand's Q2 CPI Q/Q came in at 1.1% vs. 1.0% expected and 1.2% prior. The Y/Y number came in at 6.0%, vs. 5.9% expected and 6.7% prior.
The UK June CPI Y/Y came in at 7.9% vs. 8.2% expected and 8.7% prior, while the M/M number came in at 0.1% vs. 0.4% expected and 0.7% prior.
US Housing Starts came in worse at 1434 million vs. 1480 million expected and 1559 million prior (revised from 1631 million). Building Permits also came in worse at 1440 million vs. 1490 million expected and 1491 million prior.
The Australian Jobs Report came in better at 32.6K jobs added vs. 15K expected and 75.9K prior. The unemployment rate also came in better at 3.5% vs. 3.6% expected and 3.6% prior.
Japan’s Government increased their inflation forecasts for the Fiscal year 2023–2024 to 2.6% vs. 1.7% prior.
The US Philly Fed Manufacturing Index came in at -13.5 vs. -10.0 expected and -13.7 prior.
US Initial Jobless Claims came in better at 228K vs. 242K expected and 237K prior.
Japan's CPI Y/Y came in at 3.3% vs. 3.5% expected and 3.2% prior. Core inflation in Japan is at a 40-year high.
UK June Retail Sales M/M came in better at 0.7% vs. 0.2% expected and 0.1% prior (revised from 0.3%).
Canada's May Retail Sales came in worse at 0.2% vs. 0.5% expected and 1.0% prior (revised from 1.1%).
Technicals
The US dollar rebounded strongly this week against its major counterparts.
AUDUSD 1W Chart
AUDUSD is now ranging and looking for a direction to continue in. We are still in the symmetrical triangle and have now formed a range zone within the triangle, looking for a breakout to either side.
USDJPY 1W Chart
USDJPY is on a retracement wave from the recent bearish momentum; the market is back above the 140 level. The market bounced off our support at 137.915, which is the area we had the previous bullish breakout from. Next week is very important; if the Yen's weakness continues, the 145.073 resistance level will be the next target.
EURUSD 1W Chart
EURUSD is now retracing the impulsive wave we have had over the past month and a half. There was price rejection at 1.12757, and it is looking to retest the 1.10956 level as support.
GBPUSD 1W Chart
GBPUSD is back under the 1.30000 level and is currently trading around 1.28500. The market is still in an ascending price channel, with the price action showing consistent higher highs and higher lows. If we get a break and close below the price channel, there is support at 1.24486.
The key focus for the upcoming trading week will be:
Monday: US Services PMI and Global PMIs
Tuesday: US CB Consumer Confidence
Wednesday: Federal Reserve Rate Decision
Thursday: ECB Rate Decision, US Jobless Claims, US GDP
Friday: BoJ Press Conference
We will be back with another Forex Weekly Recap report next week.
Best of luck for the trading week ahead. Trade safely and responsibly.
BluetonaFX
USDJPY I Time for a shift🧐Welcome back! Let me know your thoughts in the comments!
** USDJPY Analysis - Listen to video!
We recommend that you keep this pair on your watchlist and enter when the entry criteria of your strategy is met.
Please support this idea with a LIKE and COMMENT if you find it useful and Click "Follow" on our profile if you'd like these trade ideas delivered straight to your email in the future.
Thanks for your continued support!

RELIANCE in TROUBLE ??Well, like always, the chart is pretty self-explanatory. Do check out our view on nifty50 of which reliance is a major chunk.
If it was worth your time, do give us a like. Anything on your mind? Feel free to leave us a comment :)
DISCLAIMER: WE ARE NOT ADVISORS. WE ARE NOT REGISTERED. THE IDEAS ARE MERELY PERSONAL OPINIONS. PLEASE CONSULT YOUR FINANCIAL ADVISORS BEFORE INVESTING. WE LIKE EVERYBODY ELSE HAVE THE RIGHT TO BE WRONG :)

GOLD speculation, what to expect!Making a top down analysis from higher TF, starting from weekly, looking at the ascending trend line, gold is in uptrend, after weeks of correction that broke the trend line into the strong demand zone, moving to daily TF and seeing a reversal candle stick star pattern on the strong demand zone it could be the end of the corrective move.
on 4H TF price is in range between two opposing zone , if the supply is out as in 1937.63 loll there will be a possible rise to next supply zone as in 1967.72 level.

USDJPY I Weekly outlook and trade opportunity!Welcome back! Let me know your thoughts in the comments!
** USDJPY Analysis - Listen to video!
We recommend that you keep this pair on your watchlist and enter when the entry criteria of your strategy is met.
Please support this idea with a LIKE and COMMENT if you find it useful and Click "Follow" on our profile if you'd like these trade ideas delivered straight to your email in the future.
Thanks for your continued support!

GBPUSD TRADE IDEAThese are the types of setups I really like to see. several blocks of confirmation stacking up on each other. Buyside was taken as we can see on the 4H chart, we then see a break of structure to the downside after that with an imbalance formed. This imbalance, FVG, as highlighted on the chart falls in the OTE zone of the Fib. I didn't add that because I don't like cluttered charts, so bear with me.
On the daily timeframe you can see a clean break of structure with price returning to the orderblock and rejecting off it,
Going into this week, I would like to see price head lower to the fair value gap below and possibly the lows. Just my opinion though, Don't take my word for it.
#GBPUSD #dollar #tradeidea

COLPAL- Weekly/Monthly Timeframe-Channel BreakoutNSE:COLPAL
COLPAL is looking bullish in weekly/monthly time frame. Last month there was a rejection from the top. However, it did not receive follow up for bearish momentum. Instead, stock has took support on last month’s closing levels 1590-1600.
This is the good opportunity to go long if monthly/weekly candle closes near 1700-1710.
We may see a big upside momentum in upcoming months.
SL: 1580-1585.
This idea is only for educational purpose, please manage your risk accordingly.

Gold long idea Based on the weekly market structure the following statements can be made:
- Following the previous 3 week's trend, we are looking at a classic market maker dump&pump scheme.
1) price is dropping on Monday and thuesday.
2) On Wednesday price normally makes a fakeout to the downside, trapping breakout traders
3) Market makers pump prices to the opposite direction on thuesday, collecting the liquidity from the trend.
We have 5 confluences for bullish price action:
1) Price touched a 4h orderblock
2) Price broke below a previous low, creating a discounted price on Wednesday.
3) price created a triple wick rejection with bullish engulfing candle on the 1h chart
4) We have trapped volume from wednesday's New York session
5) selloffs are bought back instantly (seen on the 5m chart)
Trade wisely,
Peter

EURGBP I Trading plan and forecast Welcome back! Let me know your thoughts in the comments!
** EURAUD Analysis - Listen to video!
We recommend that you keep this pair on your watchlist and enter when the entry criteria of your strategy is met.
Please support this idea with a LIKE and COMMENT if you find it useful and Click "Follow" on our profile if you'd like these trade ideas delivered straight to your email in the future.
Thanks for your continued support!

EURUSD weekly outlook: Bearish bias for June weeks 3-4Weekly Outlook (W)
Bear bias until price action establishes an uptrend above 1.1092
6/15/23
Still making higher highs and lower highs
Last week of May just made the last higher low @ Weekly fib 78.6 level
Expectation:
IF
Continues uptrend: reach last HH level or 1.1100 and eventually 1.1250 (27 ext)
If not:
Price reactions from levels below:
1) 0.0865
H&S Weekly line and does a downtrend from there
2) Weekly IMB and OB with BOS down.
INVALIDATION POINT: 1.1092

EURAUD 4H Chart Analysis for coming EURAUD CHART ANALYSIS POSTED ON SUNDAY 11 JUNE 2023!!!
Make sure you do your research and based on your confluence please look for the entry.
Don't rush your trades without any confirmation.
Thanks in advance for checking my trade idea.

Gold weekly analysisPrice is at discount , i will be looking for long setup in the OTE or below 0.705 level on the Fib

EURAUD I 100 pip swing coming soon I Watch and prepare 🎯Welcome back! Let me know your thoughts in the comments!
** EURAUD Analysis - Listen to video!
We recommend that you keep this pair on your watchlist and enter when the entry criteria of your strategy is met.
Please support this idea with a LIKE and COMMENT if you find it useful and Click "Follow" on our profile if you'd like these trade ideas delivered straight to your email in the future.
Thanks for your continued support!

NZDCHF ShortNzdchf from approaching Daily Resistance level.
expecting a sell down to continue the bearish Trend

Weekly Breakdown And My Watchlist For This Week What To Wait my watchlist for this week
EURJPY
NZDCAD
USDCHF
GBPJPY
USDCHF
GBPCAD

Aud/usd sell setup weekly forecast Hello traders aus/usd is in rally up to get the liquidity then we probably will have a nice sell setup on our order block to get to those bisi fvg and thin liquidity area it is 1 to 2.5 RR very good setup it can take a little bit longer can be short term swing trade let me know what think

Gbpusd weekly forecast Hello traders Gbpusd is in a key zone to break it to reverse from it so i tried to look what dxy is doing and it has high probable we might see higher prices that will result in lower prices on the pound as long as we wait the breakout it will show us the direction make sure to mark up your false zone when you are trading breakouts to identify eerily reversals

SasanSeifi 💁♂️SOLUSDT /1W Hello everyone ✌
In the weekly time frame, as you can see, the long-term price trend from the 8$ range faced buying pressure and was able to grow to the 27$ range.
Currently, after a slight correction of the price from the lv range of 16 dollars, it has a positive reaction and is in the range of 23 dollars.
the price is fluctuating in the long-term range of the specified box.
The scenario that we can consider in the long term is that if the price penetrates and stabilizes above the range of 27$, the possibility of price growth up to the range of 33/31 and the OB range of 38$ can be considered.
We have to see how the price will react.Note that it is important to maintain the 16$ range in the long term If the price breaks below the 16$ range, we may see further corrections.❗❗❗❗
❎ (DYOR)...⚠⚜
What do you think about this analysis? I will be glad to know your idea 🙂✌
IF you like my analysis please LIKE and comment 🙏✌

Weekly FOREX Forecast: April 24 - 28th (Part 2)Welcome to another Forex Daily Forecast!
We will be preparing for the trading week ahead:
- Analysis of the individual currency Futures, to identify the strong and the weak
- Analysis of the FX pairs (EURCAD, EURAUD, EURNZD, GBPUSD, GBPAUD, NZDCHF, NZDUSD, AUDCHF, GBPCAD, CADCHF,...)
- Analysis of Gold, Silver, and OIl too!
- Plot and plan for the best setups.
I'm taking my time with this analysis with the viewer in mind. I want you to see the markets through my eyes, so the analysis is fresh, done live, for you to learn how to do this yourself. I want to raise independent traders, capable of reading the markets and planning their own trades. I'm hoping we can end up raising each other's level, in an "iron sharpens iron" kind of way, coming together and sharing trade ideas in our community of traders.
Always remember, just because they aren't setting up now, doesn't mean it won't set up later! So stay tuned for updates!
We are going to look in depth at the forex market, using top down analysis. If you have a question on any of the content, please leave a message in the comments section. For beginners, this is how you analyze forex markets, identify supply and demand zones, key levels of support and resistance, and look for swing trade setups.
Smash a LIKE and tell me what you think in the comments section! These things help to grow this channel! I appreciate your support and feedback, my people! It encourages me to continue to provide free content to the public, in hopes to grow a community of sharp traders.
