EURUSD WEEKLY ANALYSISFX:EURUSD
So as far as I see this pair for the week I am mainly bearish as we can see price broke below resistance and now has retested that same resistance so we could be seeing this pair selloff this week but due to recent events happening to the economy I will ask you all to please trade with proper risk management to avoid you loosing your account
Weeklymarketsanalysis

after result us 30 pre breakout hello tradres i have done a pre breakout strategy if you want to learn follow me it is possible to make money click that follow that free signal

BTC Weekly SellIf you are using a price efficiency trading model and are seeing weekly sell-offs entering the market, it may be a good time to consider selling some of your Bitcoin holdings to take advantage of the current market conditions and potentially maximize your profits.
Also ooking at the weekly RSI for confluence.

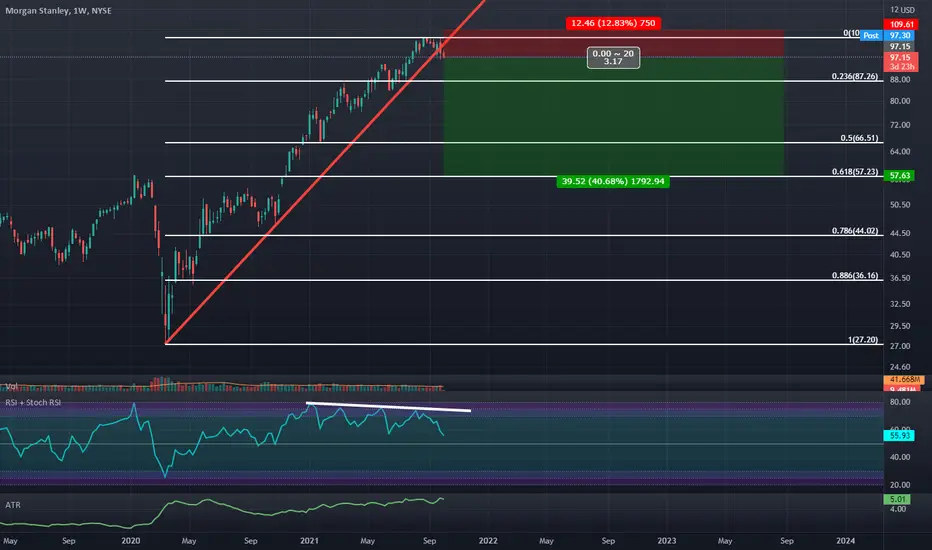
Dark Cloud Cover Visible on Weekly in Morgan StanleyWe have a confirmed Weekly Dark Cloud Cover with 4 instances of Weekly Bearish Divergence and we are breaking down an up trending line I think it wouldn't be so crazy to bearishly target a 50-61.8% retracement from here.
USDCAD I Short-term swing from resistance
Welcome back! Let me know your thoughts in the comments!
**USDCAD Analysis - Listen to video!
We recommend that you keep this pair on your watchlist and enter when the entry criteria of your strategy is met.
Please support this idea with a LIKE and COMMENT if you find it useful and Click "Follow" on our profile if you'd like these trade ideas delivered straight to your email in the future.
Thanks for your continued support!

TRADE IDEA FOR NZDJPY FOR NEXT WEEK FX:NZDJPY
As seen on the chart on the 4hr time frame we can see former support turn to new resistance as price is retesting that area again and we could anticipate that price could continue to push back up and we could find our entries and continue to trade with the trend.
but if price breaks below 84.083 then we can say that price is now bearish
What do you think?

EURAUD I Weekly Forecast & How to Trade ItWelcome back! Let me know your thoughts in the comments!
**EURAUD Analysis - Listen to video!
We recommend that you keep this pair on your watchlist and enter when the entry criteria of your strategy is met.
Please support this idea with a LIKE and COMMENT if you find it useful and Click "Follow" on our profile if you'd like these trade ideas delivered straight to your email in the future.
Thanks for your continued support!

NIFTY OPTION SELLING STRATEGY - WEEK 1 Hi Friends,
Here is option selling strangle strategy with weekly expiry.
Let see how the markets responds and we will adjust the options only when they hit 80 or above otherwise keep eating premiums.
See you next week.

Shakib--GBPJPY AnalysisHello Traders Here is The Analysis for this pair,The entry will be taken when LTF market structure change.
I suggest you keep this pair on your watchlist.

possible move weekly time framePossible Move / for BTC if we break 26k then we can the decide if we go for 30k

GBPCHF: pretty interesting patternHi guys, yesterday while looking at my charts I noticed quite an interesting GBPCHF model. In the chart above, you can see the pattern that I have drawn, how after every big and sharp drop, there is a consolidation for about 3 touches and then the price makes an ascent to the existing trendline made by the recent highs.
I am not saying here that you should go long now and wait 1-2 months for it to reach TP, but you may consider entering multiple long positions with shorter TPs.
You can take this as the general trend direction for the near future of GBPCHF.
I personally will do just that and if this pattern repeats I will milk quite a lot out of GBPCHF for the next 1-2 months.

Weekly analysis for the second week fo February This is my view on some few selected pairs to be trade for the week ahead , also are some recap of trades we took last week

weekly forex outlooksHere i share my view in the new week trades ahead , and also giving some recap, on the previous week trades

USOUSD (Crude Oil): 06/02/2023: Key levels of weekly chart
Well here is our long-term view of crude oil.
As you can see, the price is in the downtrend and we expect a continuation of a bear market.
Bear scenario: In this scenario, we have 66.13- 69.544 as a key zone. The price should break down this zone and stay below. For this goal, the price can move upward till around 75 and then start the main decrease.
Bull scenario: Although I see the market in a downtrend, I believe we should be ready for both sides of the market. In this scenario, there is a liquidity pool below 70.22 and exactly after that, we have an important demand zone of 66.13- 69.544. If this zone work, the price can rise to 78.18 as the first target after that goes higher than 82.37, and 87.83 is our last target.
💡Wait for the update!
🗓️06/02/2023
🔎 DYOR
💌It is my honor to share your comments with me💌

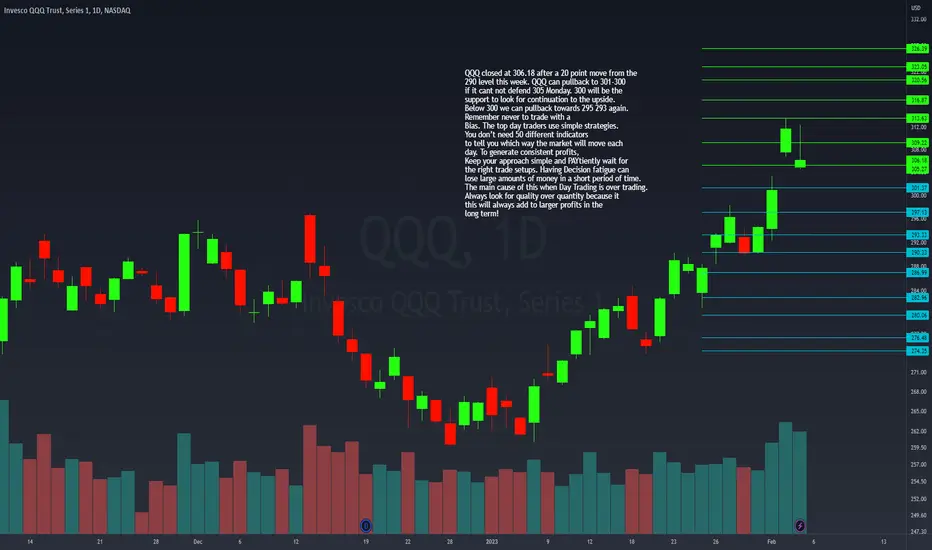
$QQQ Weekly Outlook 2/6/23$QQQ
QQQ closed at 306.18 after a 20 point move from the
290 level this week. QQQ can pullback to 301-300
if it cant not defend 305 Monday. 300 will be the
support to look for continuation to the upside.
Below 300 we can pullback towards 295 293 again.
Remember never to trade with a
Bias. The top day traders use simple strategies.
You don’t need 50 different indicators
to tell you which way the market will move each
day. To generate consistent profits,
Keep your approach simple and PAYtiently wait for
the right trade setups. Having Decision fatigue can
lose large amounts of money in a short period of time.
The main cause of this when Day Trading is over trading.
Always look for quality over quantity because it
this will always add to larger profits in the
long term!
$SPX Weekly Outlook 2/6/23$SPX
SPX closed at 4136.49 after a big week with
multiple Earnings reports, Feds, and Data. We can
see some consolidation early this week between
4100 and 4150. As long as SPX can defend 4100 we
can continue up through 4200 in the next 1 to 2
weeks. Below 4100 we can see a 60-70 point
pullback. 4100 can present a good opportunity in
both directions. Remember never to trade with a
Bias. The top day traders use simple strategies.
You don’t need 50 different indicators
to tell you which way the market will move each
day. To generate consistent profits,
Keep your approach simple and PAYtiently wait for
the right trade setups. Having Decision fatigue can
lose large amounts of money in a short period of time.
The main cause of this when Day Trading is over trading.
Always look for quality over quantity because it
this will always add to larger profits in the
long term!

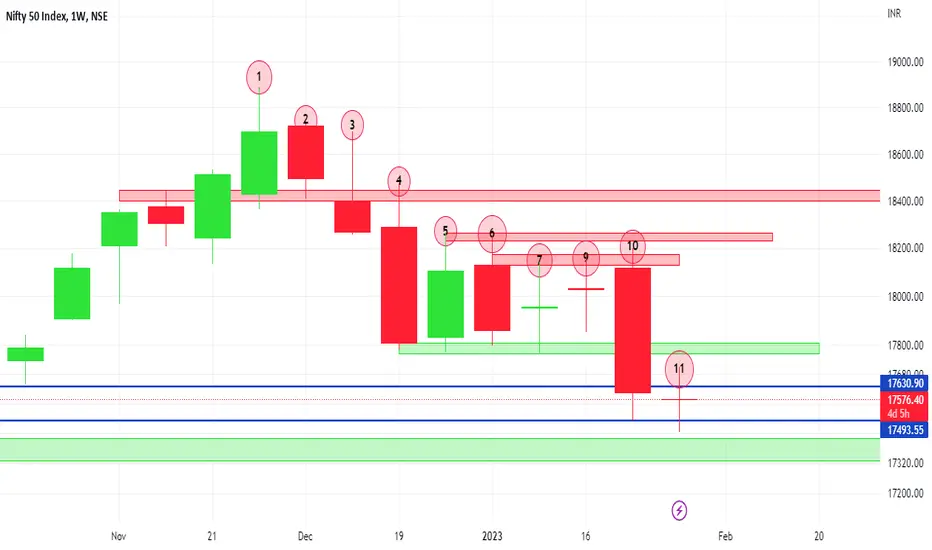
#Nifty weekly analysis.✅✅ Refer the weekly charts nifty down trending for last 10 weeks making lower highs ( Dow theory says down trend) breakdown came below 17800 - towards 17200.
BTC Weekly IDEABTC Weekly idea, I think Bear market Finished or We are at end part of it, it doesn't mean you use my idea for future trade but you can have as a long term idea for supports and resistances.
Next Bull run take us to 100K, it takes time but it worth.

Nonfarm Payrolls Effect on Gold PriceOANDA:XAUUSD
Key Economics Highlight in the first week of 2023 - Nonfarm Payrolls and Unemployment Rate for December 2022 were reported on 6th January 2023.
- Nonfarm payrolls increased by 223,000 which is higher than what the market was expecting by 200,000.
- The unemployment rate fell to 3.5%, which was lower than the consensus of 3.7%.
On the night of January 6, 2023, this report had a significant positive impact on various financial assets especially Gold. Gold prices rose from 1,836 USD to 1,850 USD within 10 minutes of the reporting and it made a higher high on the weekly candle at 1,869.9 USD before closing the week at 1,866.1 USD
Technically, Gold price almost reach its significant supply zone at around 1876.5 USD. Therefore, it would not be surprising to see the gold price drops to the first support level or trade in the range of 1825 - 1876 for a while.
Fundamentally, the current US workforce participation rate still has not reached the Pre-Covid19 level and the contribution of workforce participation in US consists more aging population which could be problematic for future economy growth as there could be more labor demand but less supply since more people are going into being retired.
Therefore, it seems like the market has overreacted to this report in short term. But, speculators and investors must still continue to manage their risks based on the inflation rates and potential recession of US economy
Let us know what you guys think!~

BTCUSD weekly (04/01/2023)Happy New Year to all traders!
I have been waiting for a while and accumulating for these purchase points in Bitcoin, here I leave you a new comparative analysis of the weekly BLX on a logarithmic scale together with the Bitcoin Logarithmic Curves and the Rainbow Price Chart.
On this occasion, the purchase points with the highest historical profitability in BTC have been analyzed with various indicators:
- 200MA hold or brief break
- PA on a macro scale with very high pressure points
-RSI touching the lower bands
(all of them as minimums of the previous cycles)
-BLGC the logarithmic curves in minima
-
BRPC maximum sales accumulation points
In my opinion, I think we are facing the best buying opportunities, perhaps with the best point at 15k or around a few days ago. I am sure that the true BTC and Blockchain maximalists are taking action in these areas.
A strong greeting and I wish you a wonderful year!
----------------------------
¡Feliz año nuevo a todos los traders!
Llevo tiempo esperando y acumulando para estos puntos de compra en Bitcoin, aquí les dejo un nuevo análisis comparativo del BLX semanal en escala logarítmica junto con las Curvas Logarítmicas de Bitcoin y el Rainbow Price Chart.
En esta ocasión,
Se han analizado los puntos de compra con mayor rentabilidad histórica en BTC con diversos indicadores:
- 200MA espera o breve descanso
- PA en escala macro con puntos de presión muy altos
-RSI tocando las bandas inferiores
(todos ellos como mínimos de los ciclos anteriores)
-BLGC las curvas logarítmicas en mínimos
-Puntos máximos de acumulación de ventas BRPC
En mi opinión, creo que estamos ante las mejores oportunidades de compra, quizás con el mejor punto en 15k o hace unos días. Estoy seguro de que los verdaderos maximalistas de BTC y Blockchain están tomando medidas en estas áreas.
Un fuerte saludo y les deseo un maravilloso año!

BTC: WILL MANAGE TO HOLD THIS LEGENDARY SUPPORT LINE??Hello everyone, if you like the idea, do not forget to support it with a like and follow.
Welcome to this important weekly BTC update.
As 2022 is about to end, If you still manage to survive in this bear market and read this update then congrats you almost make it, and soon this bear market pain will be over.
We have been in a bear market for more than one year. And the biggest question of this year is "WHERE IS THE BOTTOM OF THIS BEAR MARKET?" So in this analysis, I'm trying to give you some hints and my thoughts regarding this.
As you see in the chart, we have a very crucial support line at around the $15k level. BTC manage to hold this trend line for the last 5 years. Every time price touched this trendline, we got a very good bounce. So there is a very high chance that history repeats this time also.
In the worst case, if we got any weekly close below $15k then be ready for a $10k-12k level but as long as we hold this legendary trendline support bottom is here.
What do you guys think about this?
Share your thoughts in the comment section.
If you like this idea then do support it with like and follow.
Thank You!

XAUUSD Plan for CPI and Interest Rate Decision Week**Repost from Dec 11th 2022 since the original post disappeared**
Regardless of the results from announcement of economic numbers, it would not be surprising to see gold price drop since the current price is standing near significant resistance area around 1810 USD.
However, it would not be wise to open a short position until the break of uptrend structure is broken either from smaller time frame such as 15 min is making lower lows or the price closes below the uptrend regression channel in 1H time frame. There are two support levels to stop the bearish momentum at 1781 USD and 1765 USD. If the price does not break below 1781 USD, it has a chance of testing at 1823

USDJPY - Trade Setup that Matters !Hello dear fellows, thanks for your Love and Appreciation that i am receiving since i actively publish trade ideas again.
It has been long time since i posted the Weekly Trade setup. SO , here is my coming week's Trade Setup which i will be actively watching and might
share with you when i will be in this trade .
( PS : i am not an artist so you guys never see my charts full of colors or lines or indicators or Artwork. i always like to publish simple charts
so everyone can understand easily ! )
Trade with Strict Risk Management and this will be not your Last Trade so do not attach to it emotionally!
