Bajaj consumer, Breakout weekly chartAs we can see that Bajaj consumer broke out from its resistance zone in weekly chart,
it may come for a retest, we can expect good return in nearly future
Weeklymarketsanalysis

CADJPY I 200+ pip Swing Opportunity Welcome back! Let me know your thoughts in the comments!
**CADJPY Analysis - Listen to video!
We recommend that you keep this pair on your watchlist and enter when the entry criteria of your strategy is met.
Please support this idea with a LIKE and COMMENT if you find it useful and Click "Follow" on our profile if you'd like these trade ideas delivered straight to your email in the future.
Thanks for your continued support!

EURCAD I How to trade it this week!Welcome back! Let me know your thoughts in the comments!
**EURCAD Analysis - Listen to video!
We recommend that you keep this pair on your watchlist and enter when the entry criteria of your strategy is met.
Please support this idea with a LIKE and COMMENT if you find it useful and Click "Follow" on our profile if you'd like these trade ideas delivered straight to your email in the future.
Thanks for your continued support!

AUDJPY Swing long from support 100 pipsWelcome back! Let me know your thoughts in the comments!
**AUDJPY Analysis - Listen to video!
We recommend that you keep this pair on your watchlist and enter when the entry criteria of your strategy is met.
Please support this idea with a LIKE and COMMENT if you find it useful and Click "Follow" on our profile if you'd like these trade ideas delivered straight to your email in the future.
Thanks for your continued support!

BITCOIN- (BTC-USDT)Bitcoin is current trade at 16350 and the resistance is at 17500. If the price reverse from resistance and break the support that is at 15400 then btc price go to down further at the 11500-12500 range. And the buy and sell setup mention in the chart.

Next Bearish Leg For USDJPY Hello to the TradingView friends, please, if you like ideas, support them with likes and comments. Thanks for being here and being awesome.❤️
Did you see the reversal on USDJPY last week? After waiting weeks for price to retrace, USDJPY reversed passing the weekly higher lows at 140.343. You may be wondering what happens next.
The only thing you can from here is pinpoint where you'll enter the next trade and where you'll take profit.
Doing these two things are called strategy. You're fighting for the best price to enter and using your analysis to assume where price will move to after you enter the trade.
My dear trading friend I'm here to tell you that if you use the same steps over and over again, this won't be a hard step.
What I'm looking for?
First, I'm looking for a pullback in price or a rise in price. A rise in price gives me a better risk to reward of 1.87.
So, if price can pullback to 146.151, I believe this will be my best entry price. My stops will go around the high of 151.958 giving price room to breath in case it moves in the range between my entry and stop loss price.
Where do I believe price can go next?
I believe price can move back down to 135.425. USDJPY is still in a bullish trend according to the weekly timeframe.
This is a potential $1.00 or 1000 pip decline.
What type of trade is this?
I believe this is a weekly retracement, daily reversal trend trade. It's a bit higher risk because it fits into a counter trend category if I were to follow the cycle trend of it going against the weekly bullish uptrend.
Risk Management
I'll be risking 0.5% of my account due to this being a countertrend trade. This will also be a swing trade so I'm prepared to hold this trade for a few weeks, maybe even a month or so. Time on this trade will be out of my control.
What will stop me from entering this trade?
If price continues down, I will not enter. I need a pullback to enter the trade and without a pullback, I have no trade.
My entry is a bit away so I will set a Sell limit. A sell limit is when you put an automated order at your entry price to sell. Your broker will trigger you into the sell automatically once price is pushed through and price begins to fall past your entry price. I could also set a sell stop, but the sell limit provides a better confirmation for me.
So, my trading friend, do you believe price can pullback and drop? What do your eyes see?
I also thank you for taking your time out to read my thoughts on USDJPY.😍

USDJPY short There are two possibilities
The first
to make down move to TP1 area and then break the last top
The second
a bearish wave without breaking the top and make correction within TP1 and TP2
In both cases, we are making down move to TP1
I always advise those who have experience and were not able to sell from the top to wait for the retracement wave and can enter the 50%-60% areas as happened in the SP500 chart
TP and SL positions have been identified on the chart
good luck

XAUUSD Next Week's AnalysisPrice facing support at 1639.47 & has a possible resistance at 1659.13. now we can look for long trades if the resistance is broken & we can look for short trades if the support is broken.

Cardano could to carry down the price to $0.22 centsIn this weekly analysis, we see another and possible crash of -42% in the price. And now, Cardano break down this descending triangle and we can to expect a pull back and then, entry in the short position following the projection.
Also, for your recommendation don't buy Cardano in this end of tis bear market, starting to buy Bitcoin and hold Bitcoin or use part of them to make trading in the financial market. A good strategy it's using Cardano dominance and check out Cardano/Bitcoin correlation, for you, Cardano still bearish in this correlation in front of Bitcoin value.
So guys, that it's all information that I can to bring you and be prepared for this crash!!!

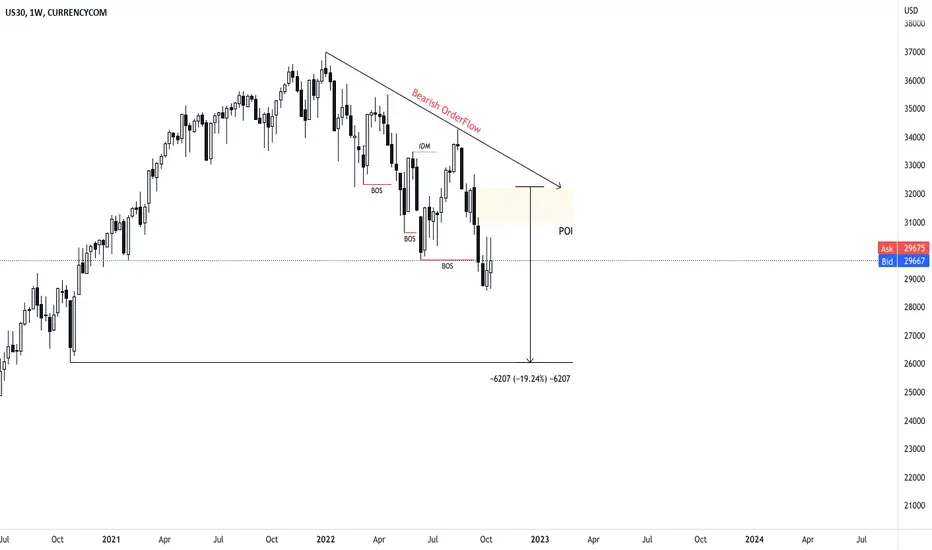
US30 WeeklyUS30 has been bearish for quite some time now and with inflation playing a part we will be bearish for a little while longer !
Recently we broke structure to the downside again and price may visit our POI before departing further downward.
As the bearish trend continues, 26000 is our target !
JP ASSOCIATES WEEKLY TIME FRAME#JP ASSOCIATES....
The Structure looks good to us, waiting for this instrument to correct and then give us these opportunities as shown on this instrument (Price Chart).
Note: Its my view only and its for educational purpose only. Only who has got knowledge about this strategy, will understand what to be done on this setup. its purely based on my technical analysis only (strategies). we don't focus on the short term moves, we look for only for Bullish or Bearish Impulsive moves on the setups after a good price action is formed as per the strategy. we never get into corrective moves. because it will test our patience and also it will be a bullish or a bearish trap. and try trade the big moves.
we do not get into bullish or bearish traps. We anticipate and get into only big bullish or bearish moves (Impulsive Moves). Just ride the Bullish or Bearish Impulsive Move. Learn & Know the Complete Market Cycle.
Buy Low and Sell High Concept. Buy at Cheaper Price and Sell at Expensive Price.
Keep it simple, keep it Unique.
please keep your comments useful & respectful.
Thanks for your support....
Tradelikemee Academy

DOT on weekly TF is ready to move as Rocket!at the end of 2020 we had the same consolidation moves with 16 weekly candles, then price broke out with a master candle in 17 weekly candle.
now price is in 16th week of consolidation, so if history repeat this move, we can expect a new rally at next week.

SPX BEARISH DOWNTREND $$$As you know, the SPX tracks the 500 largest companies, and since it has been in a consistent downtrend since its peak, it is advisable not to open any long positions for the future until the bottom is reached. I have marked the important support and resistance being used to maintain this channel in order for you to use this chart as a bigger picture to correctly analyze the market and place long and short trades.

NIFTY WEEKLY CHARTNifty on weekly timeframe bullish flag breakout and retest wait for break current candle high.....

(W) Chrt Anlyss/Current Opportunity & Longterm View with 4$rule(W) Chrt Anlyss/Current Opportunity & Longterm View with 4$rule for New Comer's.
Aug 3rd week Price Rejection at 1808 from weekly low of 1681, where Bullish run was from 1681 to 1808 = 127$
Opportunity arise after bullish rejection with Bearish Trend For :-
1st Tp at 1729
2nd Tp at 1711
3rd Tp at 1690
With Hedge point at 1752
( Strong Major Support is maintained from 20April2020 to till date 19th Aug2022 .. Tp can continue but, its not recommended )
if Major support is broken then SELL entry will be taken from 1658 and Tp will be 1635, 1602 with ext 1589.
And if the price bounce back from Major Support area.. then BUY side will be strong from 1721 to 1762 resistance if these resistances
break it will be the first sign of Bullish continuation for 1812,1821 ext 1855 and Key level figures till 2063 which is expected.
Take note that My 1lot Hedge is at 1801 and it release will be mentioned ( As per my mood ) on the TV Gold forum Chat 😃😃😃
Till then stay tuned. Good Luck
These Analysis is done Based on Trends, Wave, Technical Fundamental & Beyond Technical analysis.

BAJAJ FINANCE LTD Cup and Handle Formation on Weekly Time Frame.*BAJAJ FINANCE LTD*
Time Frame : Weekly
Observation:
* Cup and Handle formation on Weekly Time Frame.
* Breakout level at Life Time High.
Resistance/Target: 8050 8615 9160 9495
Support: 7190 6861 6350

XAU/USD AT MAJOR SUPPORTWe are currently seeing gold on a major weekly support, I'm keeping an eye on the major key levels for price reaction to determine price direction.

ACC LTD Life Time High Breakout with Round Bottom Formation.*ACC LTD*
Time Frame: Weekly
Observation:
* Parallel Channel Breakout on Daily Time Frame.
*Rounding Bottom formation.
*Life Time High Breakout on Weekly Time Frame.
Resistance/Target: 2987 3352 3717 3943
Support: 2394 2087 1900

BTC LONG TERM POSSIBILITYEVERYTHING LOOKS CLEAR ON THE CHART, if you have any questions, write down in comments below.

GOLD CHART AND MARKET ANALYSIS w/ ORDER FLOW and UPCOMING NEWSWelcome back to another video, today's video is about the analysis of GOLD using the monthly, weekly and daily timeframe to understand and see price movements for possible next direction (either downwards or upwards trend).
P.S NOT A FINANCIAL ADVISOR... JUST EDUCATIONAL AND LEARNING PURPOSE ONLY...

FOREX ANALYSIS: USDCAD CHART ANALYSIS w/ ORDER FLOW AND NEWSWelcome back to another video, today's video is about analysing the NASDAQ (NAS100) using the monthly, weekly and daily timeframe to understand and see price movements for possible next direction (either downwards or upwards trend).
P.S NOT A FINANCIAL ADVISOR... JUST EDUCATIONAL AND LEARNING PURPOSE ONLY...

NASDAQ PRICE ACTION AND CHART ANALYSIS w/ ORDER FLOW AND NEWSWelcome back to another video, today's video is about analysing the NASDAQ (NAS100) using the monthly, weekly and daily timeframe to understand and see price movements for possible next direction (either downwards or upwards trend).
P.S NOT A FINANCIAL ADVISOR... JUST EDUCATIONAL AND LEARNING PURPOSE ONLY...

Welcorp good chart to buy welcorp is cup and handle chart pattern which ready to cross his 52 week high and set a new high for in next few days volume is good and given breakout on weekly chart
