Weekly NIFTY Outlook From 06th June to 10th June 2022After struggling to cross 50 EMA resistance Nifty on Friday crossed it finally and the momentum helped it to cross 200 days EMA too. But the joy was short lived and 200 days pushed NIFTY downwards so hard that end of Friday the indices where reeling under both 200 and 50 EMA as you can see in the chart. Now NIFTY will look to find a support again. Only after finding a proper support, Nifty will rise again and try to conquer both 50 and 200 EMA Resistances which are close to one another and a formidable resistance to conquer.
The Support Zones: 16531, 16442, 16228, 16086, 15904 (Very strong support) and finally 15756. Below 15756 bears will have full control of the market.
The Resistance Zones: 16674, 16746 (Very strong resistance), 16793 and finally 16951. Above 167953 we can see the rally consolidate towards 17300 levels.
Weeklymarketsanalysis

XRP it's moving to this crash to $0.24 centsIn this quickly analysis. I'm shorting XRP right now and I see that the price it's make a descending the price in these days that we have it.
So, I use the Astroforex, similar that I use in Forex Daily analysis and work better to identify entries in the trend.
Also to share, in weekly timeframe we keep bearish in this trend and I'm bearish in XRP
I'm shorting XRP until $0.24 cents. And I keep the SL to 40.46 cents.
Good luck if you're going to short XRP!!!

Nasdaq100 Weekly ForecastExpecting price to trade from discount area to 50% Equilibrium or above after completing swing lowon W1 TF.


SPY Channels in your Weekly Game Plan$SPY bottomed on FOMC week and established the immediate trend's lower channel. The bounce off the lows moved SPY to the upper channel & a continuation wedge formation (stair-stepping downward). Friday's bottom wick attacked the intermediate trend that was established near the Jan lows. We have an "impingement" upcoming in the SPY Wedge Formation this week...does the larger, intermediate channel dominate the April/May channel? If so, expect a move back over 395 and possibly a run at the 405 level which is the 20DMA & the weekly low set on May 1st. If the move up towards 395 fails, expect the intermediate channel to be re-tested (should be under 380 by then) and then continue the Wedge Formation down towards the 374 area which might spark high volume selling and take SPY under 370.
Dotted horizontal lines are key weekly lows since February and placed for your visual reference of potential Profit Taker areas.
Key SPY levels for the upcoming 2 weeks: 360/ 368 / 374 / 377 / 380 / 385.15 / 405 / 411 / 420

EURUSD chart analysis 23 May 2022EU retesting downtrenline & strong resistance at 1.06077 while it has strong support at 1.04813.
waiting for a breakout of that ranging phase from eu

XRP could to hit $0.24 cents in shortly periodIn this Daily analysis, I will share my thoughts about my perspective in this cryptocurrency. I see a bearish movement that XRP could to hit $0.24 cents soon.
And also, analyzing the 3 Daily chart, still bearish in this way
And to share in this weekly timeframe, have 2 possible perspective to watch.
1) XRP could to reach $0.22 cents. In that point, I thinking to buy amount of XRP to make trading in my broker and get 200% yearly to accumulate XRP by long term. For that, I'm interested in XRP.
2) XRP could to go to low like $0.14 cents. In that point, it's a good opportunity to accumulate it.
Also, I will share you more later a good plan to setup if you want to accumulate XRP as I want to do it just find up 200% yearly ROI in the compound interest year to year.
I hope that this idea support you!!!

BTCweekly I guess in new weekly candle, the price could go up to the target area and return to the gap between 20,000 and 25,000 after the FOMC meeting, where we will have consolidation there.

BTC Weekly Update$BTC (Update)
BTC Reached It's Major Support i.e., $27300 - $29800
Along With A Wick Till $25401
Now,
It's Need To Close And Hold Above The Major Support In Weekly Time Frame For Upward Continuation📈....
Otherwise,
We Can See A Flash Crash Around $17569 - $19430📉
Few Hours Left For Weekly Closing
Keep Eyes 👀 On It

Btcusd forecasts falling to 20,000Weekly market idea that Btcusd falling to 20,000
It’s just idea and all risk is yours
Thanks and good luck for everyone

Litecoin it's in the bear marketIn this overview, Litecoin it's in the bear market and we see that this cryptocurrency it's leading to the previosuly minimum historical price on 2020 and part of them see on 2018 and 2019.
So, in this weekly timeframe, Litecoin forming a bearish descending triangle and retest of this chartist pattern indicating a bearish trend.
And now, in the monthly timeframe it's extremely bearish in Litecoin and the trend it's very clearly that this cryptocurrency it's dominate by bears in this market.

NEO/USD: Overview!!!As I'm in this trade, NEO continue to the downside and I see a more sell-off that the price could to reach $6.50 USD
This it's the weekly timeframe and we see a sell-off and I thinking that NEO could to reach their minimum historical maximum around of $6 dollar approx.
That it's what I think!!!
I hope that this analysis support you!!!

ADA/USD: UpdateAs Cardano price crash during these days. I get over 178% in profit. A huge earns just shorting Cardano in my broker.
Now to update, I keep in short position with the same target profit at $0.40 cents as my broker doesn't take my profit for just 2 cents of difference.
So, in H4 it's look bearish and to update here, I put a break even to cut loss in my entry price that was around $0.66 cents.
To remain, Cardano it's almost to get this target profit of $0.40 cents as we see a good perspective that my analysis was correct in what I have this perspective to shorting ADA
Good luck!!!

BTC where is the bottom Part 3Hi Birdies,
So many week passes since we did the bottom analysis so here it is.
Analysis
The Blue block is the order block which has higher chances of hitting because its getting support from 200 Weekly-MA
The Gray block which is untested and as per Smart Money concept everything should be mitigated. Also it is getting support from 300 Weekly-MA
This Gray block also has higher chances why? Because in covid-2020 BTC bottomed on 300 Weekly-MA the Red Dot
Actions
BTC will retest 50 Weekly-MA before coming down so 43,000 - 46,500 is the point of short
Meanwhile do swing trades and stay safe and blessed

Bitcoin overview marketDuring these days, Bitcoin made a crash during days as U.S. Federal Reserve made a hike interest rates a signal of tightening the U.S. Dollar in Forex market.
So, I was worrying in the Daily timeframe because broke down the EMA 200. And I suppose a possible bearish movement in Bitcoin price below $30,000 USD. But notice one thing that we're in the demand zone on weekly timeframe and it's important to know how the price action will make reaction in that key zone to watch out.
For example: in weekly timeframe it's look bullish, until doesn't broke down this market structure, we couldn't to confirm a change of trend. But fundamental analysis speak us that U.S. Dollar it's taking strengthening as global currency and more power
But it's important to watch out this key level of supply demand right now
I hope that this idea support you.
So, as I'm bearish in altcoins like Cardano and NEO, that expectative could to point that Bitcoin could to crash more than we expect. I have a clear mind that Bitcoin and cryptocurrencies it's in the bear market.

BTCUSDT weekly overview update part IIBTCUSDT will reached the key level of 28.7K soon. This is a special point of interest and institutional support. The price action reacting to these area can project a pullback at least 35k. This don't significate the final of this bearmarket. This level coincides with 23.6% of the Fibonacci Retracement from All-Time-High, also called 'peak of Head'. We have a imponent Head and Shoulders to respect. That's a special point to expect a profitable retrace to complete a prior swing of a greater collapse. Let's see.

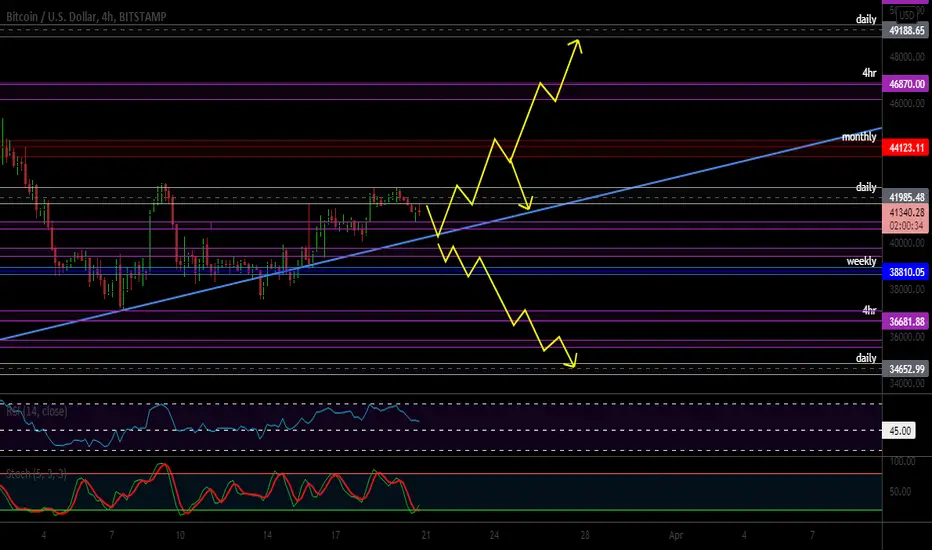
Waiting on Trendline Support or Fail For MoveThis currency is technically is a very large range, and the war isn't making it get any more steady. Even though my bullish trendline has been very respected, I'm starting to think it may have run out of steam this week.
If my trendline is broken, we'll probably make it back to 38810 zone and even further down to the 34652 zone.
If the trendline is supported, we should make it to 49188 zone for a solid higher high.
Here are the TPs:
BULL:
• 41620.37
• 43660.12
• 46090.47
• 48781.20
BEAR
• 41056.18
• 39797.61
• 38929.63
• 37150.27
• 35804.90
• 34936.92
BTCUSDT Weekly TF, Deep and Simple Analysis* If the drawn support can't be hold by BTC, then for sure it's gonna touch the 10K-19K region on the basis of Head and Shoulder Chart Pattern.
* The dump will be a quick one, and most of the future traders will be liquidated in no time.
* Stay safe and trade safely, BTC is gonna remain bearish for long time, next bull cycle will be in 2024 approximately.
News can ruin the published idea. News have huge effect on the market.

Strategy, Support, Resistance - 5/1/2022 - Weekly Stocks/Crypto Last week was a rough one for all risk classes whether you are in stocks or cryptocurrencies. The market continues to grind to critical levels to break lower. Could this be max despair and therefor a buying opportunity? In this video I look at the patterns and levels I see forming and where opportunity may be.

Audjpy weekly forex analysis with trading strategy for 02-05-22Audjpy weekly forex analysis with trading strategy for 02-05-22
In the recent times, i have been trading more of aussie pairs. from 2 weeks ago, a 100+ pips sell on audusd shared here video
analysis on YT. Last week, audusd and audcad sell analysis which is still doing massively fine. For this coming week, My selected pair from my watchlist is the audjpy for a SHORT.
Fundamentally, in the past week, interest rates from the Bank of Japan (BoJ) was unchanged, on tuesday the 3rd of may, the Reserve bank of Australia will announce interests rate which may affect the Aud as the interest rates is forecasted to be increased. Nonetheless, if the interest rate from the RBA is increased to my forecasted rate of 0.25%, i would still consider a short trade.
Technically, explained in the video analysis, Audjpy was initially in an uptrend printing higher highs and higher lows then followed by a massive rally to the upside signaling the presence of massive institutional 'Buys' pushing audjpy to an overbought level. After the move and watching closely, audjpy, started changing direction on the 4hr timeframe breaking structure to the downside and created unfilled supply zones as shown in the screenshot above. this was after price failed to break a major supply zone above.
Audjpy further printed a SHOOTING STAR candlestick pattern on the weekly chart followed by a bearish week.
After all these, I am considering a high probability sell scenario for the audjpy with an entry strategy shared in the video analysis of this content.
Let's go take some risks, let's go make some money. regards.
Preshus, Millionaire logistics

Strategy, Support, Resistance - 4/24/2022This week we watch for a potential reversal of the selloff in stocks based on VIX reaching a key Resistance. The lows of the year may be tested still. Cryptocurrency still fails to gain bullish momentum as Bitcoin and Ethereum give up supports from the recent rally. Oil may get a bid this week back up to the top of the recent range. Gold and Silver continue to disappoint. BIG EARNINGS coming up this week in Google and Amazon and they have the eyes of the whole market upon them!

pure price action.. rest all depends on sentiments.as we can witness the volatility are again high. uncertainty is again there in the market. all we have to maintain is our risk&reward ratio which is the only holy grail of the stock market. I will remain neutral. tomorrow and will see how the market will perform tommorrow.

AUDUSDAUDUSD
Weeky forcast
break trendline
Future downside follow
Short On 0.7278
Target:0.7110
SL:0.7365
