Forex Forecast: Pairs in FocusWhen starting the trading week, it is a good idea to look at the big picture of what is developing in the market as a whole and how such developments and affected by macro fundamentals and market sentiment. There are a few long-term trends beginning to reassert themselves, so it can be a profitable time to trade the markets.
Big Picture 12th December 2021
Last week’s Forex market was very quiet leading up to Friday’s release of US inflation data, which was expected to be the key driver of market movements for the week. However, the data arrived almost completely in line with the consensus forecast, and the market did not react very strongly to it. This meant the week ended quietly with low price volatility.
Despite the long-term bullish US dollar trend, the greenback fell a little over the course of the week, and it also fell after the US inflation data were released. The inflation data showed that annualized US inflation is now increasing at a rate of 6.8%, the highest seen since 1982. However, the pace of the increase lessened, with the recent month’s increase coming in at only 0.8% compared to 0.9% in the previous month. It might be that the slight reduction in the pace of the increase is seen as significant enough to prevent more panic over inflation.
Risk sentiment improved over the week, with most stock markets higher and the benchmark US S&P 500 Index rising to approach its all-time high price. Most global stock markets rose over the week, as did the Australian and Canadian dollars which are commodity currencies and key risk barometers. The improvement in risk sentiment globally is probably mostly because there is an increasing feeling that the omicron coronavirus variant will not turn out to be as economically destructive as had been initially feared. Safe-haven currencies such as the Japanese yen, the Swiss franc, and the US dollar are all lower.
The precious metal silver fell to a new 50-day low price after falling quite strongly for several days. It bounced back a little on Friday but remains quite close to 1-year lows. Trend traders may be interested in going short on Silver.
I wrote in my previous piece last week that the best trades for the week were likely to be short of AUD/USD and NZD/USD, following daily (New York closes) at new lows. Fortunately, neither of these currency pairs made a new low at the end of any day during the week, so this was sufficient to stay out of what would have been losing trades.
Fundamental Analysis & Market Sentiment
The headline takeaways from last week were:
US CPI (inflation) data came in very slightly higher than had been expected and is now increasing at an annualized rate of 6.8%, the highest seen in 39 years. However, the pace of the monthly increase slowed slightly from 0.9% to 0.8%. Markets reacted little during the rest of Friday’s session.
A coronavirus variant of concern, named the omicron variant, has continued to spread around the world. The variant is heavily mutated, and latest studies suggest that it has a strong capacity to evade current vaccines. However, latest studies suggest that a maximal course of vaccination will still offer strong protection against severe disease.
The Reserve Banks of Australia and Canada held their respective interest rates and monetary policies steady in their monthly policy releases during the week. This probably had little impact on either currency, both of which rose firmly.
The coming week is likely to see a higher amount of volatility due to the busy economic calendar, with direction likely to be determined partly by the upcoming FOMC release and partly by how dangerous the omicron variant is shown to be as more tests are performed on it. The coming week’s major scheduled economic releases will be:
FOMC statement, federal funds rate, and economic projections.
Monthly policy releases from the European Central Bank, the Bank of England, and the Swiss National Bank.
British and Canadian CPI (inflation) data.
New Zealand GDP data.
US retail sales and PPI data.
German manufacturing and services PMI data.
Australian employment data.
Last week saw the global number of confirmed new coronavirus cases fall for the first time in seven weeks. Approximately 56% of the global population has now received at least one vaccination. Pharmaceutical industry analysts now expect a large majority of the world’s population will receive a vaccine by mid-2022.
The omicron variant has been confirmed as present in fifty-seven countries.
The strongest growths in new confirmed coronavirus cases overall right now are happening in Denmark, Finland, France, Italy, Jordan, South Korea, Laos, Luxembourg, Mali, Nigeria, Norway, Poland, Portugal, San Marino, South Africa, Sweden, Switzerland, Trinidad, and the UK.
Technical Analysis
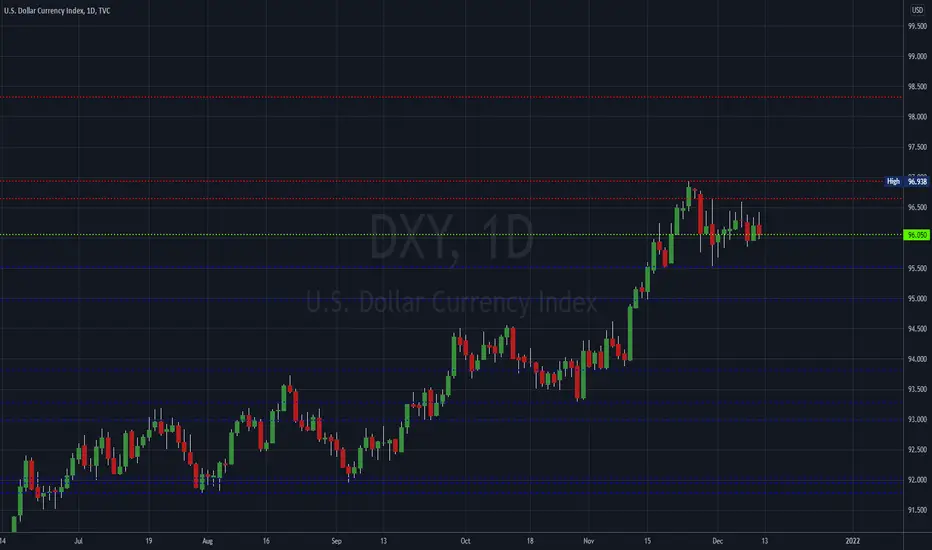
U.S. Dollar Index
The weekly price chart below shows the U.S. Dollar Index printed a bearish inside bar last week, after making its highest weekly closing price in over one year the previous week. While one weekly candlestick of a relatively small size is not enough to invalidate a long-term trend, it is notable that there is clearly strong resistance here, which has had some impact. This suggest that despite the trend, we may be due for a bearish pullback or even a reversal. However, probability suggests this strong long-term bullish trend is likely to continue, so there is no strong reason not to be prepared to a take a long USD trade over the coming week, but do not expect bullish momentum in the USD will necessarily save you.
XAG/USD
Silver priced in US dollars made its lowest weekly close since July 2020. However, there are a few potentially supportive inflection points below the current price down to $21.45. It is also true that the pace of the bearish decline has slowed, and that Friday was an up day. Therefore, it is far from clear that silver is going to decline now with good momentum, but there does seem to be a potential for a sharp breakdown once the price gets established below $21.45.
Traders may wish to short this at the weekly open or at least once the price turns bearish over a few hours, but more cautious traders might want to wait for a daily close below $21.45 or at least $21.53.
USD/TRY
The Turkish lira has been falling very strongly and losing an enormous amount of its value. The pace of the decline slowed last week, but we again saw the lira reach a new record low against the US dollar and close at a record low too. There is a strong trend here against the lira, the problem for traders is that it is very difficult to exploit this as Forex brokers are asking for huge spreads and overnight fees on long positions. However, the odds remain strong in favor of further declines in the Turkish lira.
S&P 500 Index
After trading below its 50-day moving average just last week, the major US stock index has risen strongly. Although the price did not trade yet at a new all-time high, the index made its highest ever daily close on Friday.
The weekly candlestick was solidly bullish and closed extremely close to the top of its price range. This, and the record high close, are bullish signs.
The S&P 500 Index looks likely to remain a good potential buy in the current “risk off” market environment, provided we get no nasty surprises from the omicron coronavirus variant.
Bottom Line
I see the best opportunities in the financial markets this week as likely to be long of the S&P 500 Index and short of Silver in US Dollar terms following a daily (New York) close below $21.45.
Weeklymarketsanalysis
WEEKLY ANALYSIS 13th to 17th DECEMBER 2021Whatsup guys its a new week with new opportunities and we do take a look at a few of them during this breakdown. Will update as time goes on, stay tuned!
Good Luck.
God Bless!

EUR/USD Analysis - It Will Head UpwardWelcome back! Here's an analysis of this pair!
COMMENT BELOW and let us know your thoughts or questions!
** Current technicals point to a bearish bias on the weekly of EU. After a deep push to the downside and minor correction, sellers struggled to break lower than 1240.
A break of above 1352 would signal next target at 1450 zone (previous weekly resistance). Volatility may begin to slow as we approach the holidays so don't expect major movement from this pair.
We recommend that you keep this pair on your watchlist and enter when the entry criteria of your strategy is met.
Please support this idea with a LIKE if you find it useful and Click "Follow" on our profile if you'd like these trade ideas delivered straight to your email in the future.
Thanks for your continued support!
Brian & Kenya Horton, BK Forex Academy

EU Heading Long: 2 to 4 month predicationWe are heading long. I think once December's low volume price movement comes to an end, we will be getting all the January pressure we need to start making the push long. I think we will be making a Double Bottom here for the last two weeks of Dec, then shoot long at the beginning of the new year; just as i've already illustrated.

Weekly outlook for Major Forex Pairs Hi Folks!
This is my outlook on some major forex pairs that i trade for the upcoming week.
Please have a tea and some snacks and enjoy my video and prepare your charts for the upcoming week with me.
This video is just for educational purpose, not financial advice, please DYOR before taking any trades.
If u like please hit the Like and Subscribe.

Rune Road to 25$ & Beyond Welcome to AHJ Chart Analysis
Today we are looking RUNE on weekly timeframe last week we saw a 30% dump in RUNE but it held the previous low quite beautifully & also retested downwards trendline which is quite bullish
For those who want to trade this.
Entry: 7.7 (40%)
DCA: 6.9 (40%) , 6.3 (20%)
SL 5.7
TP: 15 (15%) , 21 (25%) , 30 (35%) , 50 (15%) , 70 (10%)
This is not financial advice. Always manage Risks

GRT Road to 2.85 & beyond Welcome to AHJ Chart Analysis
As last week we saw GRT-USDT drop over 31% and that is bearish for many but if we just zoom out we can see after breaking out it is very bullish for any coin to comeback and retest it as support.
We can see GRT-USDT held 0.236 fib and trendline beautifully. As market gets stable we might see GRT-USDT making its way to previous ATH.

Forex Today: Crypto Weak After Bitcoin Flash CrashMarkets have opened with typically low-range price movements for a Monday, without showing clear direction yet. The broader trend is risk-off, with safe haven assets such as the Swiss franc and Japanese yen, while riskier assets such as the Australian and New Zealand dollars and the British pound are weak.Almost all major cryptocurrencies traded strongly lower last Friday, and then Bitcoin suffered a flash crash on Saturday, falling by more than 16% within one hour. All major cryptocurrencies have been consolidating for some hours, but look weak and prone to further falls.
Natural gas has continued to fall strongly to new 3-month lows.The Turkish lira traded at an all-time low against the US dollar on Friday and looks set to retest that high today. The price is rising again now over the short term, and it looks likely to rise higher still over the coming days. However, trading the USD/TRY currency pair can be very problematic for retail Forex traders as spreads and overnight fees are extremely high, while its high volatility can also cause problems.The COT (Commitment of Traders) report show the open interest in long US dollar is at its highest level for more than 2 years, suggesting that the long-term bullish trend in the US dollar is likely to continue.The omicron coronavirus variant is still being researched and monitored, with morbidity remaining unclear. Markets remain prone to very strong risk-off movement if forthcoming news about the potency of the omicron variant is negative.The omicron variant is confirmed to be present in 40 countries. There are confirmations of community spread. Several countries (most recently Japan) have either entirely closed their borders to non-citizens, while the US and the EU and other countries have imposed a ban on travel from South Africa and other African nations.Friday’s US Non-Farm Payrolls data showed that the US created a net new 210k jobs, much lower than the 553k which had been the consensus forecast. The unemployment rate fell from 4.5% to 4.2%, a historically relatively low level, showing a tight labor market. The data seemed to have no real effect on the market.Last week saw the seventh consecutive global weekly rise in new confirmed coronavirus cases after two months in which cases fell steadily.It is estimated that 55% of the world’s population has received at least one dose of a coronavirus vaccination.Total confirmed new coronavirus cases worldwide stand at over 266.1 million with an average case fatality rate of 1.98%.The rate of new coronavirus infections appears to now be increasing most quickly in Andorra, Belgium, Cyprus, Czech Republic, Denmark, Finland, France, Germany, Hungary, Italy, Jordan, Lebanon, Luxembourg, Mali, Malta, Netherlands, Norway, Portugal, Poland, San Marino, Slovakia, Sweden, South Africa, Spain, Switzerland, Trinidad, the UK, and the USA.

WEEKLY ANALYSISI take a look at a few pairs in this analysis. Hope the content is of value to you. Will update as time goes on, stay tuned!
Good Luck.
God Bless!

Macro bullish - but a couple weeks of slow grindIt looks like we're about to close this week with a HL, which is macro bullish. But reminds me a lot of the may crash. We put in a HL, then grinded down for the next few weeks, until we finally hit support after wicking to 29k. This is where everyone was screaming bear market. If I had to guess, we grind down to as low as 37k, where everyone will once again be screaming bear market, before pumping up. As long as these are just wicks, and we don't get any weekly closes below 42k, I remain macro bullish. Remember, on the bright side during the May-June weekly grind down, this is when NFTs were popping off. My theory? Find a narrative and play it. Keep in mind you'll have to find undervalued coins with this narrative. Current narrative I'm looking at is L2's and Metaverse (Infrastructure, not P2E games). Probably 2 months of grind down (if I'm correct) and then a pop off late Q1-early Q2 of 2022.

Bitcoin weekly chart seems btc still in bullish in long term!!Technical Analysis: Bitcoin (Weekly chart)
In weekly time frame, btc could not sustain on all time Hight breakout and seems rejection. btc make an ascending tringle and its playout very well, btc now down at lower support and try to rebuild another leg upside and RSI also making bearish Divergence which playout right now as well as retested the pervious trend line !!
if btc weekly closed above the both MA's( 21 and 50 MA) and regain psycho level 50k the it will ready to next upside move around 70 to 80k and it could fail to regain from here then only hope is 28k level to save bull market otherwise we will enter the multiyear bear market, so hope for the best but prepper for the Worst!!
🥰If you find this helpful and want more FREE forecasts in Tradingview😍.
Please show your support back🙏,
Hit the 👍 LIKE button,
Drop some feedback below in the comment✍️!
❤️🤝 Your Support is very much 🙏 appreciated!❤️🤝
💎 Want me to help you become a better Crypto trader?
Now, It's your turn!
Be sure to leave a comment; let me know how you see this opportunity and forecast.
Trade well, 💪
#bitcoin #crypto #nextmove #bearmarket #sideways #btcusdt #weeklyclosed

When there is panic, use the weeklyThe Nasdaq100 has been strong, and its trend is still bullish; however, short term we might see some more selling to test the bottom of the channel.
It's a great exercise on any chart to use maybe 1 or 2 moving averages as use a weekly candlestick chart to see the bigger picture.

Major Pairs Key Levels (Nov.29 - Dec.3)Hi everyone,
Hope you have enjoyed the weekend.
Every week, I mark weekly levels for each currency pair to see how price reacts to them.
As you see in the charts, I have marked the last Week's and Last Month’s Highs and Lows for the 6 major pairs (actually they are 7 but there was no room for NZADUSD, but you can do that one by yourself as a practice)
Why are these levels important to us?
Because they are kind of support and resistance levels and when price approaches to them, any breakout or rejection on these levels is very important:
(Lows act like support and Highs act like resistance)
So, take a note for yourself and apply them on your chart to have an efficient setup for key levels.
Mn : Monthly (Red Lines) , W: Weekly (Yellow Lines)
I have a bearish bias for US Dollar this week and I think we might see a weakness on it against the other currencies.

GBPUSD Analysis - It will head upward Welcome back! Here's an analysis of this pair!
COMMENT BELOW and let us know your thoughts or questions!
**
We recommend that you keep this pair on your watchlist and enter when the entry criteria of your strategy is met.
Please support this idea with a LIKE if you find it useful and Click "Follow" on our profile if you'd like these trade ideas delivered straight to your email in the future.
Thanks for your continued support!
Brian & Kenya Horton, BK Forex Academy

XAUUSD Weekly Analysis Nov 29 - Dec 5So We saw a very strong movement on gold this last week. And once gold reached 1780 price, it has started to pullback since then.
By just looking at the last strong impulsive movement to the down, there is a high probability that we will be seeing some correction movement in this upcoming week, there will be some buyers towards the price of 1840 (very likely to go there) and then we might find a trade opportunity to scale few hundred pips from a single trade.
Potential targets:
First Take profit should be 1780 price levels where market developed a support level this week. And if market crosses that level and go below.
TP 2 will be 1760 price levels
TP 3 will be 1725 price level if we break below 1760

Weekly outlook for Major Forex Pairs Hi there!
This is my own view on for the upcoming week for most of the major pairs.
DXY looks bearish, so im looking to short USD and bullish on other pairs.
---Disclaimer---
I am not a registered financial adviser and hold no formal qualifications to give financial advice. Everything that is provided in this video is purely for educational purposes only. All information here should be independently verified, researched and confirmed.
Trading foreign currencies can be a challenging and potentially profitable opportunity for investors. However, before deciding to participate in the Forex market, you should carefully consider your investment objectives, level of experience, and risk appetite. Most importantly, do not invest money you cannot afford to lose.

Major Pairs Key Levels: Nov.22 - Nov.26Hi everyone,
Hope you have enjoyed the weekend.
Every week, I mark weekly levels for each currency pair to see how price reacts to them.
As you see in the charts, I have marked the last Week's and Last Month’s Highs and Lows for the 6 major pairs (actually they are 7 but there was no room for NZADUSD, but you can do that one by yourself as a practice)
Why are these levels important to us?
Because they are kind of support and resistance levels and when price approaches to them, any breakout or rejection on these levels is very important:
(Lows act like support and Highs act like resistance).
So, take a note for yourself and apply them on your chart to have an efficient setup for key levels.
Mn : Monthly (Red Lines) , W: Weekly (Yellow Lines)

ETH WEEKLY OUTLOOK TREND ANALYSIS🦏Ethereum never broke our weekly lows.
This always means were still in a uptrend, after that we came all the way back and even made a little downtrend but never broke the low.
From that pricepoint buyers have woken up and broke the weekly ATH structure.
From that point we start to make a weak bearish pullback and in the bullish reversal of the pullback.
We then see a doji candle which means that we do not know where to go, after that candle we got a nice bullish candle what was the start of an NEW ATH.
I am know waiting for a pullback to the doji area to go LONG.

Major Pairs Key Levels (Nov.8 - Nov.12)Hi everyone,
Hope you have enjoyed the weekend.
Every week, I mark weekly levels for each currency pair to see how price reacts to them.
As you see in the charts, I have marked the last Week's and Last Month’s Highs and Lows for the 6 major pairs (actually they are 7 but there was no room for NZADUSD, but you can do that one by yourself as a practice)
Why are these levels important to us?
Because they are kind of support and resistance levels and when price approaches to them, any breakout or rejection on these levels is very important:
(Lows act like support and Highs act like resistance).
So, take a note for yourself and apply them on your chart to have an efficient setup for key levels.
Mn : Monthly (Red Lines) , W: Weekly (Yellow Lines)

ETHUSD : POTENTIAL MOVES (WEEKLY)ETHUSD WEEKLY OUTLOOK.
Ethusd to reach 5K this week or possible next week.

Weekly outlook for Minor Forex Pairs Hi there!
Here you can see my own view on some minor forex Pairs such as GBPAUD EURAUD AUDJPY CADJPY GBPJPY.
I use a mix of traditional way of trading with smart money concepts.
Please like the video if u like and comment below any suggestions for improvement and share with your friends. This will give me motivation to continue giving a value to people.
This is just my view not a financial advice or call to actions. Before taking a trades please make your own analysis.

Weekly outlook for Major Forex Pairs Hi there!
This is my outlook on Major forex pairs.
Please give some love, press a like and share it if it gives a value to you. Your response on comments will be motivation for me to keep doing such outlooks.
This is not financial advice, this is just my own view. Please make analysis before taking any actions. Trading might involve a risk of loosing your capital.

Cup and Handle on #ETHCup and Handle Pattern on $ETH and broke out the resistance area and the last thing that price retested the resistance and now its a confirmed support.
Its on weekly chart and invest if you can wait patiently.
Note: #Do your own due diligence exercise
#NFA
Also placed a #pin_note on my first TAs TP.
Seniors please have a look.
