AUDJPY on a weekly resistance 🦐AUDJPY on the weekly chart (left side) is now testing again a weekly strong resistance around the 76.400 area
At the beginning of June price hit and got rejected sharply by the resistance zone, hit the 0.5 fib retracement zone and start again a new impulse to the upside.
IF the market will break and close above the weekly structure we can look for a nice long position.
IF the market on the other hand turn again below the 75.000 area, we can look for a short order according with Plancton's strategy.
–––––
Follow the Shrimp 🦐
Here is the Plancton0618 technical analysis, please comment below if you have any question.
The ENTRY in the market will be taken only if the condition of Plancton0618 strategy will trigger.
Weeklymarketsanalysis

CHFJPY on a weekly resistance 🦐Market is ranging between the 107 and 118 area, on the weekly chart market has been in a discending channel.
After the break of it it started an uptrend in higher high higher low move.
Currently the market has approached a weekly strong resistance that also is at the top of the asceding daily channel.
If the market will break the channel to the upside and consequently break the weekly structure we can set a nice long position according with our strategy.
–––––
Follow the Shrimp 🦐
Here is the Plancton0618 technical analysis, please comment below if you have any question.
The ENTRY in the market will be taken only if the condition of Plancton0618 strategy will trigger.

US OIL will break the monthly resistance? 🦐US OIL on the monthly chart has approached a very important level of a clear resistance zone.
On the weekly chart we can see that the market has been in a consolidation phase for the last few weeks.
What we could expect is to see the price retrace between the resistance zone and ema 21 before a break or possibly a clear break of the structure retest of it and continue the uptrend move.
––––
Follow the Shrimp 🦐
Here is the Plancton0618 technical analysis , please comment below if you have any question.
The ENTRY in the market will be taken only if the condition of Plancton0618 strategy will trigger.

GBPJPY Weekly Market Analysis. Inverted Cup & Handle Pattern.GBPJPY formed a beautiful Inverted Cup & Handle pattern along with a Bearish Flag pattern in 1 day time frame. After that price broke both the patterns with high Bearish momentum and is now on its retrenchment move and almost retesting 0.61 or 0.78 on the fib levels. Thus indicating the price to go short in the long run. Draw an uptrend line in a lower 4hr time frame and wait to enter when price breaks below that trend line on a lower time frame. That would make your entry much more safe. FX:GBPJPY

CADJPY Breakout; Heading to Weekly HighsFollowing an impulsive move upwards, and now we are in a bit of a corrective structure or consolidation, if you will, we might retest the trendline before continuing to the upside where the previous weekly high was.

GBPUSD Next Likely MoveThis is part 2 of the pound/dollar analysis. As we stretch thin towards the upside for days, a pullback is most certainly likely to happen, possibly this week as we have finally reached the weekly trendline guiding the price's journey thus far.

GBPUSD Impulse, Correction, Continuation MethodCould the first sign of a corrective move already have happened? I mean we did end bearish last week, did we not?


EURUSD Possible Inverted Cup and HandleA very likely scenario if we take into consideration that price broke the parallel channel to the downside for the second time now, but this time the probability of the downtrend continuing is very likely.

Price Action- Key to Trading GOLDLots of back-testing to do. But we may get a decent drop in price between prices 2000 and 2100 as with the past price action, price fell soon after the particular pattern was formed. I'm not one to start picking tops and bottoms but just a thought. Great hunting this week everyone, looking forward to another round next week :)

Weekly Analysis on TCSThis is my weekly perspective on TCS.
If the resistance is broken then expecting a good movement.
Only for educational purpose.
Also let me know your view on this post.

Gold(XAU/USD), S&P500, US OIL,Bitcoin Weekly Outllook 27th -31st#XAUUSD #US500 #forex
Gold
S&P500
USOIL
EUR/USD
GBP/USD
BITCOIN
Weekly Outllook 27th -31st July

GBP/JPY Potential BUY 1) Double bottom at 4hrs
2) Price retesting at the neckline
3) Price broken structure a 1hrs with HH and then HL
4) 4hr EMA crossover
5) Divergence

ENGBTC is waiting for a weekly breakout 🦐ENGBTC is waiting for a weekly breakout (red rect).
According to Plancton's strategy, we can set a nice order
–––––
Follow the Shrimp 🦐
Here is the Plancton0618 technical analysis, please comment below if you have any question.
The ENTRY in the market will be taken only if the condition of Plancton0618 strategy will trigger.

Weekly Analysis Major Currency Index@DXY- POSITIVE-NEUTRAL
@EXY- NEUTRAL-NEGATIVE
@SXY- NEGATIVE
@JXY-POSITIVE
@AXY-NEUTRAL-NEGATIVE
OBVIOUS PAIRINGS ARE:
LONG PAIRS: USDCHF, USDCAD
SHORT PAIRS: EURUSD, EURJPY,AUDUSD,AUDJPY

xau/usdhere are my previsions for xau/usd we wish that the market will be stable . Since now the dollar has declined so as we know the gold is linked to dollar , and in this period the united states is preparing for a new wave of corona virus , due to those reasons the dollar has declined ...so stay tuned for today i am observing the market for news and we wish that the market won't pull back to the up side .

WEEKLY ANALYSIS USDCHF SHORT SETUP! (CLEAR TREND)Good day traders! Wish you all have a pleasant weekend and do enjoy yourself and happy trading!
Start off with USDCHF! Price has been moving in downtrend for the past week and it has formed a symmetrical triangle chart pattern and this is an indication of bearish movement.
We strongly believe that symmetrical triangle is one of the most frequently appearance in USDCHF pairing. Head and shoulder has formed, too, which further pushing down the price.
The upcoming week, we will be looking for SHORT opportunity. A close below 0.94541 will expose the price to way below.
Always go for a clear trading strategy and enter trade with good risk management. It's always you versus yourself instead of you versus the market.

Can We Continue Up Or Return To The Trendline?Wow! What a nice trendline bounce we had last week! Looking for some more action this week by seeing if we can keep the bullish pace up to the monthly level or make a return to the weekly zone, but this time to break through the trendline and let the bears take over. Now I am seeing a potential double top trade for the short when we reach the first bull tp. But let's see how things play out.
BULL TPS:
• 1779.64
• 1789.82
• 1805.30
BEAR TPS:
• 1760.44
• 1754.14
• 1739.48
• 1725.92

Is This a Giant Pullback?From the daily timeframe, it looks like a giant pullback for the bull. But I need to wait for it to hit my zone to get a confirm if that's what I'm looking at. Until then, move with the trend.
BULL TPS:
• 1.24148
• 1.25035
• 1.26343
BEAR TPS:
• 1.23018
• 1.22306
• 1.21150

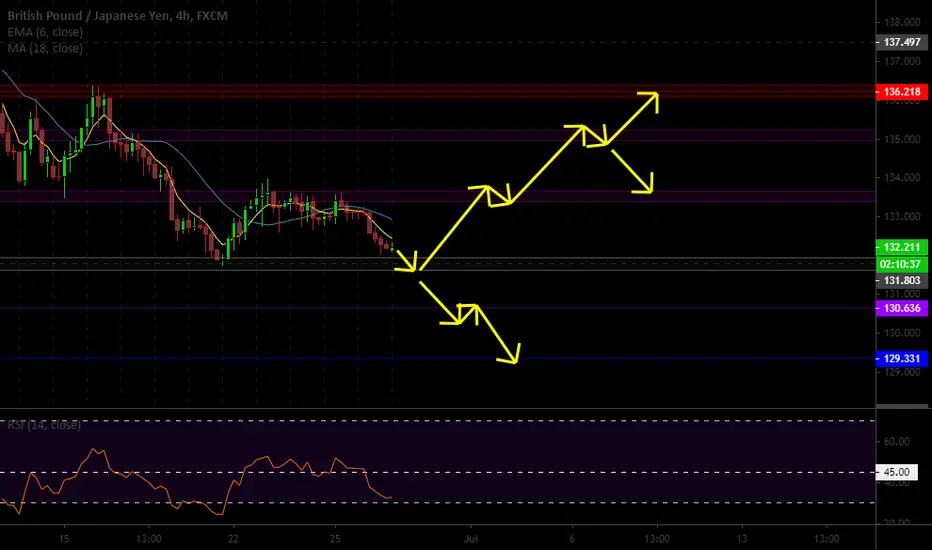
Potential Key Level SetupThis is looking like a potential key level trade setup for the bull. Waiting to see if we can get that magic 2nd touch before take-off, or will we keep on tanking for a continued short.
BULL TPS:
• 133.397
• 134.960
• 136.093
BEAR TPS:
• 131.803
• 130.777
• 129.549
Bitcoin Weekly Bearish Signals. Likely to go lower
Today I will show some weekly Analysis which is showing many Bearish signals.
Firstly the RSI has a weekly bearish Divergence. This is a bearish indicator as we are likely to move lower. (Marked by purple arrows )
Secondly There is a bearish engulfing candle which indicates bearish momentum (Indicated by green arrow), you can find more about the pattern here: www.investopedia.com

Weekly Analysis AXY,JXY,EXY,BXY,CXYThis is the weekly analysis for the week commencing 28.06.2020
======================
NOTE:Truths
-Traders will do the same thing over and over again.
-In trading, no one to blame and no one to question what price did.
-Price can break any low/High because anything can happen.
If you fully allign your thinking in line with the truth about the market then you will win.

EURUSD WEEKEND ANALYSIS! DAILY CHARTGood day traders, hope you all have a pleasant weekend ahead. Weekend has always been the best day to do self reflect in our trades throughout the week, as well as to have weekly analysis to ready for the week ahead!
Start off with EURUSD. From daily chart perspective, price has broke below the strong support. Nevertheless, price has closed in a very bearish environment. Therefore, for the week ahead, we will be looking for short opportunity as well.
Price is expected to retest 1.11788 (strong support) before going all the way down to targeted profit region, 1.10778, which inline with EMA55, too. We will watch closely the formation of candlestick/price when price retrace back to strong support region on Monday.
Entry price: 1.11788 (Sell limit)
SL: 1.12049
TP: 1.10778
Always go for a clear trading strategy and enter trade with good risk management. It's always you versus yourself instead of you versus the market.
