Higher Lows for Bitcoin, Can we Make Higher Highs? Good Evening Traders,
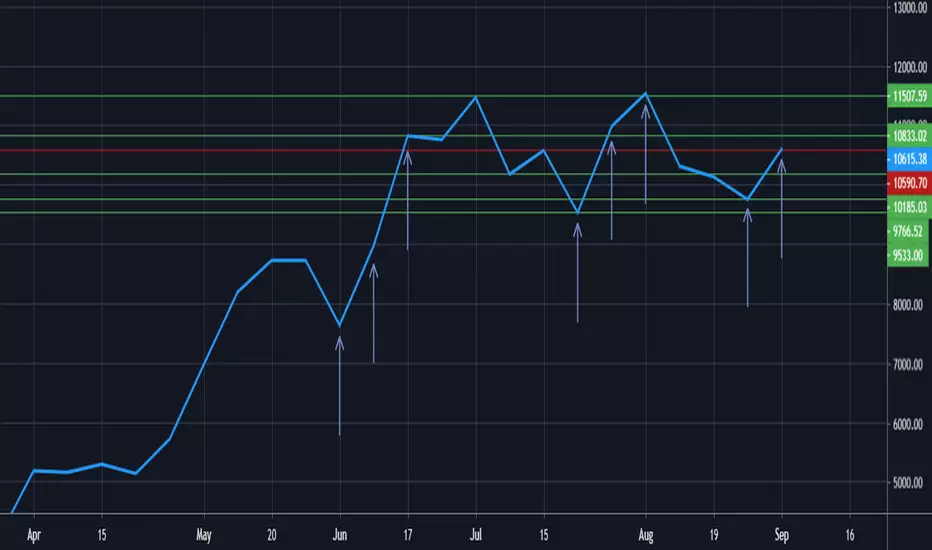
Bitcoin is looking very interesting on the weekly, just over a big resistance mark from July 15 of $10,590 at $10,615.38. Bitcoin has been following an interesting pattern in the last few months. We have seen two weeks of profit follow each low of the cycle, meaning we could see more profit in time to come. We would need to pass $11,507.59 for a higher high to follow the potential higher low at $9,766.52. I would definitely keep a tight eye on this weekly if I were looking to make any moves on Bitcoin. Feel free to compare this to a more zoomed in POV of Bitcoin on the hourly chart, along with some of my technical analysis here .
Disclaimer: This is NOT trading advice! These are merely my opinions that I have posted for you to use as one of hopefully many tools for making YOUR OWN decisions. I hope you all kill it, but I am not responsible for any financial losses. Thanks for reading!
Weeklymarketsanalysis
USD/TRY: Weekly OUTLOOKHey tradomaniacs,
chart speaks for itsself. :-)
Let`s see what will happen.
LEAVE A LIKE AND A COMMENT - I appreciate every support! =)
Peace and good trades
Irasor
Wanna see more? Don`t forget to follow me.
Any questions? PM me. :-)

EURUSD: Weekly Forecast 26th - 30th AugustEURUSD consolidated for the first 4 trading days last week and finally rebounded off strongly near the previous low on its very first retest.
This is pretty much as expected as seen in my last week's forecast as that's just how EURUSD will react based on the previous new lows created.
The price is expected to climb again and forms the second bullish wave.
This week, wait for the price to retrace towards the immediate demand zone at 1.1115.
The retracement should take around 30 pips should the 2nd bullish wave is meant to form.

Gold: Weekly Forecast 26th - 30th AugustCan the gold break new high and evolve into another freakish bullish trend this week?
Patterns sometimes do repeat itself and it could happen again in this case.
The gold fell to the bottom of a range and continued to consolidate throughout the week as it formed lower highs.
Just before Powell's speech last Friday, the gold was seen climbing steadily and jumped all the way to the top of the range, just 45 pips shy from the previous high.
This symptom looks exactly just like the jump in 2nd July and the price was seen resisted and pulled back strongly after an attempt to break new high.
What's really important is that we do not want to chase the gold long at such price and you do not wanna buy high right?
If we do not see the price break and close above the previous high in the first 2 trading days, chances are the price will fall again to the range bottom.
Therefore, I am open to an attempt to sell the high, and even if that failed, I know that I've sold at the highest price.

Gold: Weekly Forecast 19th - 23rd AugustThe gold has undergone a full week of consolidation after 550 pips plunged from the top of a 3-month rising channel.
According to the previous bullish wave, the current wave is very much overbought and the plunge seen on last Monday will most likely cause another bearish wave.
In this week, we will wait for the price to retrace higher and look for selling opportunity at the demand zone at 1522.
However, the long-term trend stays unchanged and the gold price is projected to reach 1620 by the end of 2019.

EURUSD: Weekly Forecast 19th - 23rd AugustEURUSD turned out as expected based on last week forecast.
The price broke out of consolidation and reach an important demand zone which it found support.
Although the rebound last Friday from the demand zone around 1.107 was significant, the price did not break new high and thus may fall deeper into the demand zone.
This week, we will continue to wait for more pullback and aim to buy at 1.05.

USDCAD Weekly outlook 19.08OANDA:USDCAD
USDCAD weekly outlook:
Seen a recent double top formation with a strong uptrend holding. Naturally, we are looking to break this line and rally back to support levels. We still have to consider further bullish control if we break above the highs.
- To be a bull in this pair we are waiting for a break of trend and target previous levels. USD is likely to be having a rate cut in the very near future which further supports a bear break. We need to confirm.
- To be a bull on this pair we can look for bull failures from the moving average. Although we have seen a triple top, there is still scope to head north. USD will be busy so price action will need to follow for opportunities.

US Dollar Currency Index / W / Weekly Forex Analysis / 8.11.2019Hello Traders, welcome to the Weekly Forex technical analysis. Today is August 11th, 2019 and we will be taking a look at the U.S. Dollar Currency Index on the weekly chart just to get into the calendar, and have an outlook into the upcoming week of August 11th. Looking at the Dollar Index here on the weekly time frame, the DXY losing the 97.6 resistance area and taking a serious leg down. Our next level of support is going to be the 96.1 area, if that fails to hold, next we would look at the 95.6 region for our next area of support. Thank you for tuning in please feel free to write a comment or leave some feedback, any advice is greatly appreciated. Have great day and good hunting out there traders!

Gold: Weekly Forecast 12th - 16th AugustGold rush after gold rush, the gold price has reached beyond 1500 for the first time in 6 years.
There's no doubt behind the gold strength and the long-term view shall stay bullish throughout the rest of 2019 as central banks continue to cut rates and ease monetary policies.
However, the recent bullish wave has well exceeded the volume of all previous bullish waves and signs of exhaustion can be seen thus significant retracement is expected to take place
For short-term selling, only choose to sell at a high from 1504 onwards (a minor supply zone can be seen in the m15 chart), targets at 1492, 1487 and 1470.
To buy gold again, the most immediate price is seen at 1487 (just below the current range low), while the best entry is determined at 1470 (key demand zone).

EURUSD: Weekly Forecast 12th - 16th AugustThe EURUSD made one of the strongest bullish runs in more than a month as daily volume surge to a 20-month high from a 27-month low.
The price, however, fell into consolidation for the rest of the week as it got resisted by a 2-week supply zone.
The US economy continues to show a slowdown and Fed members have been dovish enough as they see more rate cuts are needed in the near future.
No doubt that the eurozone is always facing economic slowdown and uncertainties such as Brexit, there' are signs for further technical rebound in the next couple of weeks.
In this week, we are expecting that the price will retrace lower during the consolidation phrase before it embarks on another bullish run.
Look for buying opportunity from 1.1115 to the demand zone at 1.1110.
However, if the price were to retrace too deep and break below 1.1110, the sentiment will turn bearish and EURUSD will once again break new low.

BTC/USD WEEKLY SHORT, LONG-TERM.BTC/USD WEEKLY SHORT, LONG-TERM.
The bearish engulfing is one of the most important candlesticks
patterns.
This candlestick pattern consists of two bodies:
The first body is smaller than the second one, in other words, the
the second body engulfs the previous one.
This is how a bearish engulfing bar pattern looks like on your charts,
this candlestick pattern gives us valuable information about bulls and
bears in the market.
In case of a bearish engulfing bar, this pattern tells us that sellers are
in control of the market.

Gold: Weekly Forecast 29th July - 2nd AugustGold formed a bearish weekly candle for the first time after 9 weeks of bullish candles.
The gold price has been held back from climbing further by a strengthening dollar and also due to a technical overbought.
In the H4 chart, we can see that the gold has just completed the 2nd wave of a bearish trend but came short as compared to the first wave.
There isn't any strong selling pressure seen and the bearish move last week is probably just another consolidation before the gold resumes its major bullish trend.
This week, we will watch closely for the demand zone right below 1410 as the price is expected to retest the current low since the rebound last Friday wasn't strong.
However, traders should watch out closely for FOMC as well as NFP to gauge the dollar strength when trading the gold.
If the gold does drop below 1410 and rebound from the demand zone, it would be a good opportunity to build gold long before FOMC.

Dollar: Weekly Forecast 29th July - 2nd AugustThe dollar climbed as expected as euro continues to weaken amid ECB and dollar continues to climb with some better than expected economic data.
The dollar is about to complete the 2nd bullish wave after breaking out from a consolidation which has completed 2 waves of retracement.
The price is expected to climb a little further and will meet with strong resistance at a 4-month high around 98.4.
The key focus for this week is none other than the FOMC where a rate cut of 25 basis point is widely expected.
The expectation of a rate cut has already priced in and the market is more focused on the tonation of the Fed in regards to the economic health to look for clues for whether the Fed will continue cut rate further later this year.
Another important thing to take note is whether the Fed will unexpectedly cut by 50 basis point instead of just 25 basis point.
In this week, the dollar is expected to consolidating upwards before the FOMC.
If the FOMC is dovish with its economic condition and/or decides to cut by 50 basis point, the dollar will face a strong resistance near 98.4 and fall towards 97.5 and then 96.7.
But if the FOMC shows little clue for another cut in this year and choose to only cut by 25 basis point, the dollar may either break through the 4-month high near 98.4 or maybe it will face some resistance first and pull back towards the demand zone at 97.5 before climbing further,
I will be posting another post on trading the FOMC separately.

Gold: Weekly Forecast 22nd - 26th JulyThe gold, though recently broke new high again, is expected to fall into consolidation again.
The breakthrough this week is unlike what it was in June and the last bearish day candle was the most bearish one since one year ago.
Nevertheless, the gold stays fundamentally strong and holds high demand as a safe haven asset.
This week, if the price were to climb first, sellers can look for sell opportunity at the supply zone around 1437.
For buyers, the key demand zone is seen at 1410 - 1406 where the price began to strengthen and eventually broke out of the previous range.

Dollar: Weekly Forecast 22nd - 26th JulyThe dollar has shown resilience this week as the price was supported twice by the demand zone at 96.7 and has begun to climb again.
The price has previously broken above a falling trendline thus signals for the price to climb further
After this week, the price has completed 2 waves of retracement where the price is now seen rebounding off from key demand zone at 96.7.
The dollar is ready to proceed with another wave of bullish trend this week despite the fact that the Fed is most likely to cut rate this month.
The dollar still holds the highest interest rate after all and it is still a considerably good safe-haven asset to hold.

EURUSD: Weekly Forecast 22nd - 26th JulyThe bullish structure which EURUSD had before this week has turned sour as the price failed to break the supply zone at 1.128 but instead fell back to the range bottom at 1.12 again.
In this week, simply wait for a pullback and look for sell opportunity between 1.124 and 1.126.
Among all the major currencies, the euro is certainly fundamentally weak which is caused by the ECB signalling to introduce QE or cut the rate deeper into negative zone.


EURCHF Likely To Fall Further After Support & Trendline Break!Oh make no mistake, technically most of the EUR related are starting to show a strong bearish pattern . EURUSD could tumble to 1.09000 level in the coming months even on the back of a weaker USD!.
The above link is shows the analysis behind the EURNZD which has a potential to drop . However since many central banks are shifting towards easing, typically in this scenario fundamentally makes the SAFEHAVEN FX currencies perform the best. CHF being one of the SAFEHAVEN alongside the JPY in my view would be best performers against the EUR in the coming months!
Have a look at the main chart weekly TF chart of the EURCHF. The horizontal lines are concrete support and resistance taken from the monthly TF. At the moment i am awaiting the monthly candle to close beneath the orange support located at 1.11000 level for added confluence. Furthermore, we have a long term trendline which has been violated on a weekly TF, for added confirmation that is why its advisable to wait for the monthly candle to close below orange line. This would confirm the broken support turned resistance and channel has been officially broken!
The next support lies at 1.06000 level, where the price could potentially head towards. This seems like a big PIP move but if you look at the fundamental factors, we are seeing the ECB shifting their monetary policy to accommodate the changes which would likely result in EURO depreciation over long term.
I am seeing the monthly would close comfortably beneath the support by the end of this month and then its advisable to execute the trade SHORT with the target of 1.06000 and RR of 1:1.
This just represent my analysis on this pair and i feel this a high probability trade setup in play. shall there be any trade entries i would post them in a new post.

BTCUSD Weekly TF Analysis From FX Trader Point Of View!My interest in cryptocurrencies is second to none, however i thought of executing my technical analysis that i perform on Actively Traded FX pairs to BITCOIN. First of all i am a SWING trader, meaning i analyse my charts from monthly TF down upto daily or 4 hourly. My strategy relies on finding concrete support and resistance levels from the monthly charts to finding supporting technical patterns on lower TF to add to my confluence.
Here on the BTCUSD chart the monthly chart does not give any info what so ever, so i decided to look at the weekly TF. The first thing i did was to plot all the concrete support and resistance levels from the weekly TF (have a look at the main chart). At the moment of writing the price is in between the 10,000 support and 12,000 on weekly TF. Adding to this, the price seems to be capped by a descending trendline which is preventing the bitcoin bulls from pushing higher. currently the market is giving me neutral bias as i feel the cryptos are mostly driven by technical trading rather than fundamental ones with exceptions of breaking news which affects cryptos immediately without any warning.
So below are the two possible scenarios which should potentially take place for the price to make its next move, be it UP/DOWN
1) FOR A BULLISH SCENARIO
The price as explained is capped by a descending trendline. So for the price to push higher not only must the trendline break (weekly candle closes outside the trendline) but also the 12,000 resistance level needs to be broken (weekly candle should close above 12,000 level). If this takes place we have confirmed the trendline and resistance breakout. so finally for the trade entry, its advisable to await slight retracement before executing a LONG trade to target the next resistance that lies at 14,000 level
2) FOR A BEARISH SCENARIO
Have a look at the image above. its a daily chart of BTCUSD which shows the price confined in a well held triangle supported by an ascending trendline. For the bearish scenario to take place, the price needs to breach the ascending trendline (weekly candle must close outside the trendline). Once this has happened we can wait for the price to retrace and enter a SHORT trade to target the next support that lies at 8,000 level
IN ALL TWO POSSIBLE SCENARIO THE RISK TO REWARD RATIO IS SUGGESTED TO BE 1:1 WITH THE POTENTIAL STOP LOSS PLACED JUST ABOVE THE RESISTANCE LEVEL OR BELOW THE SUPPORT LEVEL.
IN FX trading i do a combination of fundamental and technical analysis which gives me an extra added confluence to validate my trade, however in this case, the pure technical price action picture is telling me the above two possible scenarios. if you notice, trading with risk management is about taking out the support or resistance levels one at a time rather than aiming for 20,000 or 40,000 impulsively! With Bitcoin or other crypto market being so volatile, in my view its best to take this approach so as to preserve your capitals.
Hope some of you will find my outlook helpful and i will certainly in the future think about adding cryptos to my trading portfolio. cheers and trade safe

Ascending Channel+H&S Pattern In Favor Of EURNZD Bears! Have a look at the main weekly TF chart of EURNZD pair. From here its clearly visible that the price is confined in an ascending channel which has been held on numerous occasions. However at the moment the price seems to be too aggressive to the downside and has potentially violated the channel pending today's weekly candle close!
The four horizontal red lines represent solid support and resistance levels taken from the monthly TF. Just below the trendline there lies a psychological 1.65000 support level , which in this case is a must to be broken level in order to confirm a bearish outlook. For this level to be broken i would personally prefer the monthly candle to close below 1.65000 level .
Furthermore, there is an almost complete H & S pattern on the chart , which would be complete when the trendline/channel breaks together with the 1.65000 level. In this case the potential 1.65000 turned resistance would also act as the neckline of the H & S . So to put all this together in favor of the bears there 3 concrete confluence factors to take this pair towards the next support that is present at 1.58000!
Fundamentally the Euro is weak at the moment and is predicted to get weak in the coming months, whereas the NZD shows a mixed outlook. So putting all this together the probability of this pair breaking down is HIGH.
Shall there be any updates regarding the trade entries i will post them in a new post. This just represents my outlook on this current pair

Gold: Weekly Forecast 15th - 19th JulyThe gold has been consolidating for the past 3 weeks since it peaked at 1439.
It is still unclear if the price will eventually break above or below the consolidation but the long-term view is most definitely a bullish one as the Fed proceeds with cutting rate.
For buyers, traders can consider buying at the bottom of the consolidation at 1393 if the price falls before breaking above 1420.
For sellers, traders can consider selling starting from 1420 but avoid selling if the price closes above 1427.

Dollar: Weekly Forecast 15th - 19th JulyThe dollar fell as the Fed reaffirms its intention to cut rate end of the month.
The price climbed at first but was rejected by a supply zone near 97.6, wiping out all gains and turning it into a bearish week for the dollar.
In this week, the dollar is expected to fall further but will meet with support at 96.4 due to a probable inverse HnS.
If the price climbs at first, look for resistance near 97 to sell.
Apart from the technical perspective, this week is filled with important U.S. data that is strongly connected to inflation which is an important factor for how aggressive the Fed will proceed with its rate cut.

EURUSD: Weekly Forecast 15th - 19th JulyEURUSD has made a successful rebound off the demand zone as the Fed clearly signalled for a rate cut by the end of July.
However, the gain was somewhat curbed by a dovish ECB as well which also signalled for more QE.
In the H4 chart, the price has technically completed an ABCD formation and has started its 2nd wave of a bullish trend which is most likely to continue in the coming week.
If the price continues to climb, watch out for 1.135 as the 2nd shoulder of an HnS could form.
In conclusion, EURUSD is expected to climb further this week and traders can consider buying again if the price retraces closer to 1.125.
