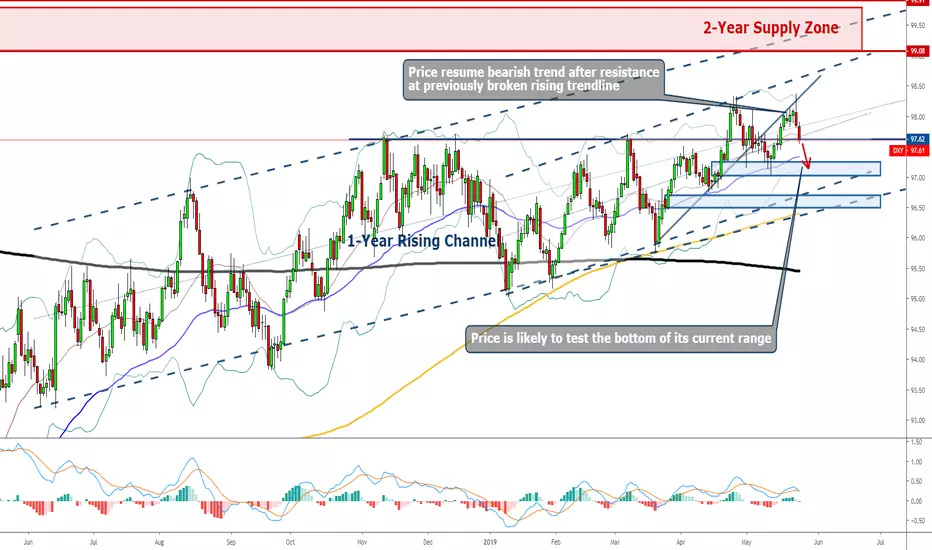
Dollar: Weekly Forecast 27th - 31st MayThe dollar was somewhat consolidating at the beginning and suddenly it attempted to break new high.
The price went slightly above the previous high at 98.3 but immediately got rejected by strong selling pressure.
This is somewhat quite expected of the dollar whenever it attempts to break a new high.
The situation where the U.S. economy is in surely isn't one that favours a stronger dollar, one that is in the midst of a trade war.
In this week, we do expect the dollar to fall further and test the bottom of its current range at 97 where it will probably just continue to trade within the range.
Weeklymarketsanalysis
EOS/ETH Long Entry banking on 20DMA rebound (weekly)On my last post EOS/ETH was in overbot territory on the weekly and I was looking to add more on weakness.
The Bull Case:
Since then the pair experienced a reversion to 20DMA, STO back to the mid-area (no surprise!).
IMO the current setup could be a good entry point risk/reward-wise. Looking for a rebound on 20DMA. With a potential Exit ITM before meeting the upper band of John B!
+ factor in Some major announcements to come on June 1st from Block.one, the firm behind EOSIO and which ICO-ed the EOS token. This could play as a catalyst for an period of speculation/readjustment of expectations around D-day.
Downside Potential:
I would work this config with a tight Stoploss, Risk/reward 1:3 with a QUICK Exit if no spike up after the announcements. There is a potential of being drained by the forming divergence on the MACD.
This is just a statement of opinion and should not be construed as financial advice.

EOS/ETH Long on Potential rebond on 2WMAOn my last post EOS/ETH was in overbot territory on the weekly and I was looking to add more on weakness.
The Bull Case:
Since then the pair experienced a reversion to 20WMA, STO back to the mid-area (no surprise!).
IMO the current setup could be a good entry point risk/reward-wise. Looking for a rebound on 20WMA. With a potential Exit before meeting the upper band of John B!
+ factor in Some major announcements to come on June 1st from Block.one the firm behind EOSIO and which ICO-ed the EOS token. This could play as a catalyst for an period of speculation/readjustment of expectations around D-day.
Downside Potential:
I would work this config with a tight Stoploss, Risk/reward 1:3 with a QUICK Exit if no spike up after the announcements. There is a potential of being drained by the forming divergence on the MACD.
This is just a statement of opinion and should not be construed as financial advice.

US Dollar Currency Index / W / Weekly Forex Analysis / 5.19.2019Hello Traders, welcome to the Weekly Forex technical analysis. Today is May 19th, 2019 and we will be taking a look at the U.S. Dollar Currency Index on the weekly chart just to get into the calendar, and have an outlook into the upcoming week. Looking at the Dollar Index here on a weekly time frame, we can see we got a minor correction and finally it moved back above the 97.465 support and resistance area, with a strong weekly close above this area. Going into this next week of 5/20/2019, we will be looking for the Dollar Index to follow through and continue to strengthen a bit more an target the 98.687 resistance area. On the over hand if we fail to move higher and turn bearish we would be looking to retrace back to the 96.493 support area.

EURUSD: Weekly Forecast 20th - 24th MayJust like the dollar, and since EURUSD has been moving in harmony with the dollar this week, EURUSD has clearly turned bearish after breaking below the key level of 1.1173 after the break below a rising trendline.
And all indicators such as MACD, moving averages and Bollinger band has pointed toward a bearish trend in the week to come.
Therefore in this week, we are setting a bearish tone for the EURUSD and expecting the price to fall further and test the previous low or break new low.
Should the price retrace at first, we will look for sell opportunity at the supply one right above 1.1200.

Gold: Weekly Forecast 20th - 24th MayThe gold price failed to maintain its bullishness even after it had broken above a 2-month falling trendline.
The break came on the first trading day where a strong bullish candle pierced through the top of the range at 1288 together with the falling trendline.
However, the bear came in unexpectedly strong, recover all losses and ended up closing with a bearish candle with a long upper shadow in the weekly chart.
Nevertheless, the price continued to stay supported above 1270.
This week, the gold is still likely to fall further as the bear has proven strong, and the price will eventually retest 1270 again.
Should the price retrace at first, look for sell opportunity at 1288 supply zone.

Dollar: Weekly Forecast 20th - 24th MayThe dollar has shown that the consolidation has completed as it headed north through the whole of last week.
Every indicator is in favour of a bullish dollar such as the 20,55 and 200 moving averages that are pointing upward, the Bollinger band that has opened its mouth, and the MACD has crossed upwards above level zero.
The low and the high keep getting higher as it rises through a 4-month rising channel.
This week, we are expecting the dollar to keep rising and should the price were to retrace in the beginning, the price is likely to rebound off the demand zone below 97.6.

EURUSD- Weekly Forecast 13th - 17th MayEURUSD consolidated at the beginning and finally climb as expected, breaking above a falling trendline too.
The price is now facing strong resistance at 1.1250, preventing it from breaking new high.
If the price continues to climb, it will complete an ABCD pattern as it reaches 1.1300.
The first 3 trading days will be very crucial for whether EURUSD will resume its downtrend or the bull is still strong enough to climb higher.

Dollar - Weekly Forecast 13th - 17th MayThe dollar turned out as expected and broke below the bottom of the rising channel.
The price is most likely to continue falling further and will eventually complete an ABCD pattern within the demand zone around 96.6.
However, it is crucial that the price has to break below 97.2 in the first 2 to 3 trading days or else it may form a strong support for the bulls to come back.

#GBPUSD, impressive bear in Week 19, what about Week 20?GBPUSD moved a different direction as what was expected from our analysis last week. It made a gap at the start of the week and went down all the way without looking back.
It stopped the price movement in bearish consolidation zone 2 and ended the week with a hint of a continuation of the trend.
As the pair is currently residing in the consolidation zone 2, the analysis would expect the pair to go further, reaching a level 3 before a reversal pattern show itself.
I am currently holding open short positions as well and I am planning to exit when it hit level 3 and wait for a reversal pattern to complete itself before going long.
The whole process of hitting bearish consolidation zone 3 and the completion of the reversal pattern can take the whole week of Week 20, we just got to be patient and wait for it.
Thus, the short term outlook remained bearish and would only turn bullish after the reversal pattern at consolidation zone 3 shows itself.
I hope all traders continue to make good profit in Week 20!
Please like and follow me if my analysis helped you in any way! Thanks for the support! =)

#EURUSD, expected consolidation in Week 19, how about Week 20?EURUSD did not make any strong move in Week 19, and it has moved comfortably within its consolidation range.
I personally only took one signal in EURUSD in Week 19 as it seems not to show any good signals.
The price is currently sitting at the top of the consolidation range and it is still unsure if the price would fall back to the consolidation range or would it make an upward break in Week 20.
Thus, the analysis is not suggesting taking any bias outlook at the moment and wait to have a clearer picture before taking a stand.
I hope all traders continue to make good profit in Week 20!
Please like and follow me if my analysis helped you in any way! Thanks for the support! =)

#USDJPY, Strong bear in Week 19, can they continue in Week 20?USDJPY moved way beyond the expectation of the analysis. It opened with a big bearish gap and continued its downward move till Friday. Spectacular week for short traders, congrats to all short traders who made an awesome profit!
In Week 19, USDJPY only showed the Bullish strength a few hours before the close of the market. USDJPY threw a reversal pattern at its bearish level 5 consolidation, and it is easy to miss the entry since it is near the end of the week.
The analysis is pointing a bullish trend in Week 20 as we are now in the middle of the reversal pattern. A double bottom was identified as the reversal pattern and it seems to be able to move the pair upwards in Week 20.
Personally, I will be adding long positions in Week 20, and the price pattern and analysis gave me great confidence that it will reverse itself to a bullish trend in Week 20. I am also currently holding two open long positions in USDJPY.
I hope all traders continue to make good profit in Week 20!
Please like and follow me if my analysis helped you in any way! Thanks for the support! =)

#USDCHF, downward break in Week 19, still bearish in Week 20?USDCHF spent much time in the range of level 1 and finally, it broke down to a new low towards the end of the week, moving into the level 2 consolidation zone.
USDCHF moved much to what was expected of it, consolidation then followed by the trend move. I hope traders have taken advantage of the range and made good profits for yourselves!
The analysis for Week 19 still points toward a continuation of the bearish trend in upcoming Week 20.
The price broke into a new low and I am looking at USDCHF forming a new low in Week 20.
With the analysis in place, I am comfortable going short in USDCHF for Week 20. However, a consolidation might also follows after a strong bearish move in Week 20.
I hope all traders continue to make good profit in Week 20!
Please like and follow me if my analysis helped you in any way! Thanks for the support! =)

ENB.PR.J Long Position: weekly candlestick pattern (01.05.2019)Stock: ENBPRJ
Quantity: 30
Position: Long
Open: 17.50$


Gold- Weekly Forecast 6th - 10th MayGold had a week of consolidation as it failed to break previous low and rebounded off quite strongly, closing higher than its previous day high.
The price is expected to climb further and test the top of the current range of 1287 and 1267.
The major trend will still be unclear until the price has chosen to break out either side of the range.
If the price falls a little but maintains above 1273 for the first 2 trading days, there's a good opportunity to buy from the low to the top of the range.
If the price climbs and reaches 1286 - 1294 for the first 2 days and provided the candles get smaller after one another, that will be a good chance to sell again.

EURUSD- Weekly Forecast 6th - 10th MayEURUSD has climbed strongly but got rejected at 1.126 which led it to fall for another 2 days.
However, the dollar plunged and pushed EURUSD up again and the week ended with a bullish candle.
Based on the structure, the price could be forming an ABCD which will be completed within a supply zone at 1.1300.
But just before that, the price should face some resistance by a falling trendline at 1.1230.
So, if the price were to fall at first in the first 2 trading days but managed to maintain above 1.1170, it will provide a good opportunity for a short-term long.
If the price continues to climb at first, we will keep a lookout for a breakout of the falling trendline at 1.1230, and keep waiting for a selling opportunity only when it reaches 1.1300.

Dollar - Weekly Forecast 6th - 10th MayThe dollar did not turn out what was expected and the entire sentiment has turned from a bullish to bearish.
It started off by falling for 2 consecutive days which dived a little deep below the breakout level of 97.7 but managed to pull another 2 days of bullish movement that covered most of the weekly losses.
And then the market chose to buy the story and sell the fact which led the dollar to sink below the breakout level once again, which also cause a break at the bottom of the rising channel.
So this week, more bearish movement is definitely expected and there's a good chance for it to reach the demand zone just below 97 before we see any significant rebound.

#USDJPY, downward break in Week 17, what to expect in Week 18?USDJPY moved as expected from our analysis in Week 16, breaking through the level 1 consolidation zone.
It ended the week with a strong bearish move after the NFP and stayed low till closing.
The analysis is currently pointing to some form of potential consolidation that might happen in Week 18 as it is in the bearish zone 2 now which the rally can move about 30 to 60 pips.
Overall, the direction for USDJPY continues to be bearish, however, in Week 18, there can be opportunities for both long and short traders to profit from the market.
I would be looking for long opportunities and continue to go in on a bigger short contract when the signal arises.
I hope all traders can continue to make good profit in Week 18!
If my analysis helped you in any way, I hope you can give me a like and follow me, thanks for your support!

#USDCHF, barely bearish in Week 17, let it continue in Week 18USDCHF moved accordingly to what we expect in Week 17, albeit it is not that of a massive move, short traders can still make good gains from shorting with low drawdown.
The reversal zone delayed for a little while before the bearish move, it dipped a little, followed by a consolidation which forms the level 1 of the bearish zone.
The NFP that occurs on Friday helped to push USDCHF back to its original direction, and the USDCHF ended the week with a strong bear move.
As the pair is currently residing in the level 1 zone, the analysis would expect the pair to continue its downward movement in Week 18.
I would look for shorting opportunity in Week 18 and hopefully, it can reach the level 2 zone in Week 18.
I hope all traders can continue to make good profit in Week 18!
If my analysis helped you in any way, I hope you can give me a like and follow me, thanks for your support!

#GBPUSD, great gains in Week 17, can it continue in Week 18?GBPUSD shifted massively away from where we ended in Week 17. Any traders going long at any point of time would have made a good profit.
With such a strong bullish move except for a short pullback at level 2, can the trend continue on through Week 18? Well, the analysis suggested that we will be looking at a downward rally soon before the price continues back its bullish track.
Week 17 ended with a strong bullish move after the NFP and it stayed at its weekly high at close. That is a pretty strong statement of bullish power.
However, it has broken it's level 2 bullish zone, thus we are expecting some form of consolidations which might lead to a reversal if a reversal pattern occurs, if not it can continue an extended bullish move.
The analysis is suggesting a possible short opportunity in Week 18, which I agree. I am also looking at a longer-term bullish move might resume after the short term bearish move.
I hope all traders continue to make good profit in Week 18.
If my analysis helped you in any way, please like and follow me, thanks for your support!

#EURUSD, long and short in Week 17, remain long in Week 18?EURUSD made a great bullish move at the start of the week, however, it started to stall and resume the bearish move somewhere in the middle of the week.
Fortunately, it continues back its bullish power after the NFP on Friday.
EURUSD currently sits at level 1 of the bullish zone, and the analysis pointed to us that the pair would be likely to continue its upward thrust for Week 18.
The analysis would expect the upward move to reach a level 2 bullish zone in Week 18 since it is currently at its level 1 and it is considered reversed in Week 16.
When the opportunity arises in Week 18, I would be going in long on EURUSD as well.
I hope all traders can continue to make good profit in Week 18!
If my analysis helped you in any way, I hope you can give me a like and follow me, thanks for your support!

USDCAD Short Position: weekly candlestick pattern (22.04.2019)Pair: USD/CAD
Leverage: 1:25
Lot: 0.02
Position: Short
Open: 1.33530
