A trading opportunity to sell in USOILMidterm forecast:
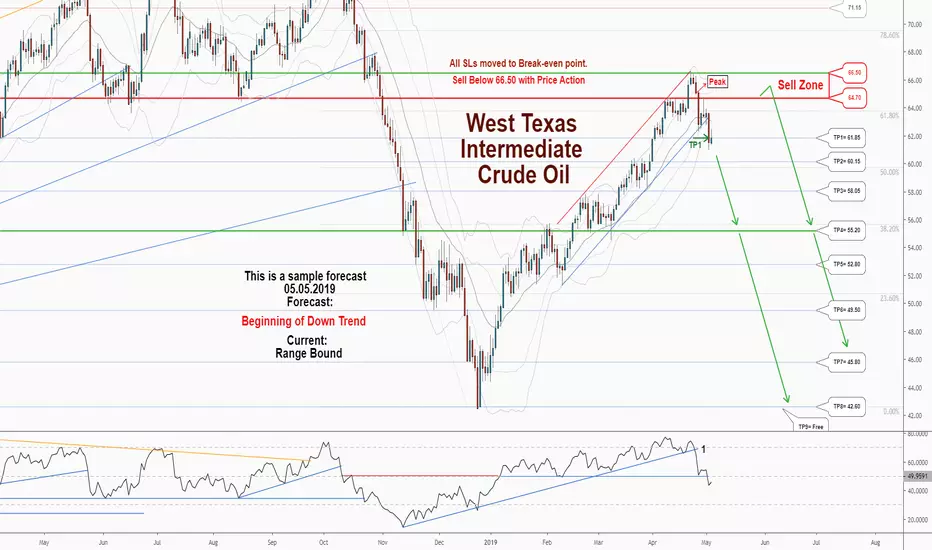
While the price is below the resistance 66.50, beginning of downtrend is expected.
We make sure when the support at 55.20 breaks.
If the resistance at 66.50 is broken, the short-term forecast -beginning of downtrend- will be invalid.
Technical analysis:
The RSI uptrend #1 is broken, so the probability of beginning of downtrend is increased.
A peak is formed in daily chart at 66.50 on 04/23/2019, so more losses to support(s) 61.85, 60.15, 58.05 and minimum to Major Support (55.20) is expected.
Price is below WEMA21, if price rises more, this line can act as dynamic resistance against more gains.
Relative strength index (RSI) is 46.
Trading suggestion:
There is possibility of temporary retracement to suggested Sell Zone (64.70 to 66.50). We wait during the retracement, until the price tests the zone, whether approaching, touching or entering the zone.
We would set sell orders based on Daily-Trading-Opportunities and expect to reach short-term targets.
Beginning of entry zone (64.70)
Ending of entry zone (66.50)
Entry signal:
Signal to enter the market occurs when the price comes to " Sell zone " then forms one of the reversal patterns, whether " Shooting Star " or " Peak ", in other words, NO entry signal when the price comes to the zone BUT after any of reversal patterns is formed in the zone.
To learn more about " Entry signal " and special version of our " Price Action " strategy FOLLOW our lessons:
Trade Setup:
We opened 9 SELL trade(s) @ 65.11 (day close price) based on 'Peak' at 2019.04.25.
Total Profit: 2878 point
Closed trade(s): 326 point Profit
Open trade(s): 2552 point Profit
Closed Profit:
TP1 @ 61.85 touched at 2019.05.02 with 326 point Profit.
Open Profit:
Profit for one trade is 65.11(open price) - 61.92(current price) = 319 point
8 trade(s) still open, therefore total profit for open trade(s) is 319 x 8 = 2552 point
All SLs moved to Break-even point.
Take Profit:
TP2= @ 60.15
TP3= @ 58.05
TP4= @ 55.20
TP5= @ 52.80
TP6= @ 49.50
TP7= @ 45.80
TP8= @ 42.60
TP9= Free
Westtexasoil

A trading opportunity to sell in USOILMidterm forecast:
While the price is below the resistance 66.50, beginning of downtrend is expected.
We make sure when the support at 55.20 breaks.
If the resistance at 66.50 is broken, the short-term forecast -beginning of downtrend- will be invalid.
Technical analysis:
The RSI uptrend #1 is broken, so the probability of beginning of downtrend is increased.
A peak is formed in daily chart at 66.50 on 04/23/2019, so more losses to support(s) 61.85, 60.15, 58.05 and minimum to Major Support (55.20) is expected.
Price is below WEMA21, if price rises more, this line can act as dynamic resistance against more gains.
Relative strength index (RSI) is 46.
Trading suggestion:
There is possibility of temporary retracement to suggested Sell Zone (64.70 to 66.50). We wait during the retracement, until the price tests the zone, whether approaching, touching or entering the zone.
We would set sell orders based on Daily-Trading-Opportunities and expect to reach short-term targets.
Beginning of entry zone (64.70)
Ending of entry zone (66.50)
Entry signal:
Signal to enter the market occurs when the price comes to " Sell zone " then forms one of the reversal patterns, whether " Shooting Star " or " Peak ", in other words, NO entry signal when the price comes to the zone BUT after any of reversal patterns is formed in the zone.
To learn more about " Entry signal " and special version of our " Price Action " strategy FOLLOW our lessons:
Trade Setup:
We opened 9 SELL trade(s) @ 65.11 (day close price) based on 'Peak' at 2019.04.25.
Total Profit: 2878 point
Closed trade(s): 326 point Profit
Open trade(s): 2552 point Profit
Closed Profit:
TP1 @ 61.85 touched at 2019.05.02 with 326 point Profit.
Open Profit:
Profit for one trade is 65.11(open price) - 61.92(current price) = 319 point
8 trade(s) still open, therefore total profit for open trade(s) is 319 x 8 = 2552 point
All SLs moved to Break-even point.
Take Profit:
TP2= @ 60.15
TP3= @ 58.05
TP4= @ 55.20
TP5= @ 52.80
TP6= @ 49.50
TP7= @ 45.80
TP8= @ 42.60
TP9= Free
US OIL - SHORT - ASCENDING WEDGEPRICE CURRENTLY IN IT'S CORRECTION STAGE AFTER THAT HUGE BEARISH IMPULSE.
WAITING FOR PRICE TO BREAKOUT OF THE WEDGE.
WARNING: PRICE CAN GO ABOVE THE UPPER BOUND OF THE WEDGE AND CREATE ANOTHER PATTERN BUT THE SUPPORT LINE OF THE PATTERN WILL STILL REMAIN VALID.
TARGETS BASED ON FIBONACCI CLUSTERS

A trading opportunity to sell in USOILMidterm forecast:
While the price is below the resistance 66.50, beginning of downtrend is expected.
We make sure when the support at 55.20 breaks.
If the resistance at 66.50 is broken, the short-term forecast -beginning of downtrend- will be invalid.
Technical analysis:
The RSI uptrend #1 is broken, so the probability of beginning of downtrend is increased.
A peak is formed in daily chart at 66.50 on 04/23/2019, so more losses to support(s) 61.85, 60.15, 58.05 and minimum to Major Support (55.20) is expected.
Price is below WEMA21, if price rises more, this line can act as dynamic resistance against more gains.
Relative strength index (RSI) is 51.
Trading suggestion:
There is possibility of temporary retracement to suggested Sell Zone (64.70 to 66.50). We wait during the retracement, until the price tests the zone, whether approaching, touching or entering the zone.
We would set sell orders based on Daily-Trading-Opportunities and expect to reach short-term targets.
Beginning of entry zone (64.70)
Ending of entry zone (66.50)
Entry signal:
Signal to enter the market occurs when the price comes to " Sell zone " then forms one of the reversal patterns, whether " Shooting Star " or " Peak ", in other words, NO entry signal when the price comes to the zone BUT after any of reversal patterns is formed in the zone.
To learn more about " Entry signal " and special version of our " Price Action " strategy FOLLOW our lessons:
Take Profits:
TP1= @ 61.85
TP2= @ 60.15
TP3= @ 58.05
TP4= @ 55.20
TP5= @ 52.80
TP6= @ 49.50
TP7= @ 45.80
TP8= @ 42.60
TP9= Free

Oil to $67.35/bbl in July, 2019Hey everyone,
This is my first published TA (USOIL on the weekly chart) with TradingView. My thoughts on this, is that oil will continue to head to the R1 Pivot Point, as this is used widely among floor traders. Oil companies have taken large hits recently, with oil being in the low 40's before climbing back up. The "happy median" for global oil prices is about $60/bbl. If oil solidly breaks through $60/bbl, I believe we will see oil rise upwards of $67/bbl before coming down. I am calling for July, as this is peak for the summer months when the price of oil is usually highest. From their, I believe we will see a steady downward slope going into the winter months, whereas natural gas will become the next rising commodity. Do keep in mind, oil sanctions did go into effect in 2018, and the USA has become the largest supplier of oil. This should be treated as a "new" market, because past performance had other factors involved, that were not involved in prior years. This "prediction" is going past technical analysis, into a more open-minded price target based on global demand. The RSI is making lower lows, while the price is making higher highs. We do see this divergence. This could potentially cause oil to be oversold (<30), giving it the momentum to drive higher. The other indicator is the MACD lines, showing a solid cross signaling a strong uptrend.
Zak

very overbought market on wti, looking for pullback
hey guys,
wti is currently very overbought and I am looking for counter trend trades.
on 1H chart we see a formation of a descending triangle in an uptrend.
It is a very important reversal pattern and it is worth to focus your attention on it.
just wait and sell the breakout of the triangle's support.
your target will be based on structure around 60.0 level.
good luck!

Oscillators Signal Sell Even Though MAs Suggest Trend HigherIf global growth continues to slow, so too will Brent. If not, then this assessment should be updated. While technical oscillators are important for this forecast, so too is the assumption that global growth is not rebounding, but rather will continue to slow in the EU and China.

trading plan for WTI: double top in a rising channel
hey guys,
wti is trading inside a rising parallel channel.
after the market has reached a 60 level we have a trend weakening signs.
the market could not establish a new higher high and was rejected by 60 level.
formation of a double top and overbought rsi with divergence is a red flag for us.
if the market breaks the local support level, it will also break a support line of a rising channel
- giving us a great opportunity for entry.
just wait for a bearish breakout.
initial target is based on structure.
good luck!

WTI (USOIL) - Bullish Minor 5 - March Wave Counts - Part 4If you like my work, please support me with a like.
More details in my signature.
Many pips ahead!

WTI Crude Oil Analysis for the week of Feb 25th - March 1st 2019Based on technical analysis alone, we should approach the R1 level this week, and see a down trend. Based on the Day candlesticks, we should see a slight retracement back down to the indicated level of 56.19 (-1.75%) if the trend line is broken. Since the RSI is hovering near the 70 marker, this indicator could point to a negative week. However, on the weekly charts, the RSI is neutral.
Key notes:
1.) See previous posting of the long position for oil.
2.) If trendline is broken, we should retrace for the week.
3.) If R1 is broken AND sustained, this will invalidate a short position for the week. This being said, the RSI will most likely go into overbought conditions on the daily chart. This will point to a negative week ahead, instead of this week.
There is a lot to look out for. Be patient! Let the trades come to you.
Happy Trading!
Zak

WTI OIL Buy on pull back or break-outPattern: Bullish Megaphone.
Signal: Bullish. Two entries. The pull back towards 53.00 (1) or the break out above the green line (2).
Target: TP(1) 58.00. TP(2) 60.00.

west texas oil/usd bullish set up.On the weekly I have seen very strong support zones which have been tested several times, price seems to have created an inverse H&S pattern on the daily so I'm waiting on breakout to place a trade.

CRUDE OIL (WTI) Detailed trading planPattern: Inverse Head and Shoulders on 1D.
Signal: Essentially sideways trading for 1 week with 2 buy signals and 1 sell.
Targets: As illustrated on the chart. Long TP 52.80, 54.10 and Short TP 50.50.


A trading opportunity to buy in WTIWest Texas Intermediate Crude Oil
Midterm forecast:
The current trend is downtrend but the forecast is beginning of uptrend.
Technical analysis:
While the RSI resistance #1 at 50 is not broken, the probability of price increase would be too low.
A peak is formed in daily chart at 54.65 on 12/04/2018, so more losses minimum to Buy Zone (51.30 to 49.50) is expected.
Price is below WEMA21, if price rises more, this line can act as dynamic resistance against more gains.
Relative strength index (RSI) is 39.
Trading suggestion:
Price is in the support zone (51.30 to 49.50), traders can set orders based on Daily-Trading-Opportunities (Price Action) and expect to reach short-term targets.
Beginning of entry zone (51.30)
Ending of entry zone (49.50)
Entry signal:
Signal to enter the market occurs when the price comes to " Buy zone " then forms one of the reversal patterns, whether " Bullish Engulfing ", " Hammer " or " Valley " in other words,
NO entry signal when the price comes to the zone BUT after any of the reversal patterns is formed in the zone.
To learn more about " Entry signal " and the special version of our " Price Action " strategy FOLLOW our lessons:
Take Profits:
TP1= @ 54.35
TP2= @ 56.00
TP3= @ 58.05
TP4= @ 59.90
TP5= @ 61.85
TP6= @ 63.90
TP7= @ 66.50
TP8= @ 76.75
TP9= Free

A great opportunity to sell in WTIMidterm forecast:
The current trend is downtrend and the forecast is continuation of downtrend.
Technical analysis:
While the RSI resistance #1 at 50 is not broken, the probability of price increase would be too low.
A trough is formed in daily chart at 49.45 on 11/29/2018, so more gains to resistance(s) 52.20, 54.10, 56.00 and maximum to Sell Zone (61.85 to 63.90) is expected.
Price is below WEMA21, if price rises more, this line can act as dynamic resistance against more gains.
Relative strength index (RSI) is 30.
Trading suggestion:
There is possibility of temporary retracement to suggested Sell Zone (61.85 to 63.90). We wait during the retracement, until the price tests the zone, whether approaching, touching or entering the zone.
Beginning of entry zone (61.85)
Ending of entry zone (63.90)
Entry signal:
Signal to enter the market occurs when the price comes to " Sell zone " then forms one of the reversal patterns, whether " Shooting Star " or " Peak ", in other words, NO entry signal when the price comes to the zone BUT after any of reversal patterns is formed in the zone.
To learn more about " Entry signal " and special version of our " Price Action " strategy FOLLOW our lessons:
Take Profits
TP1= @ 59.90
TP2= @ 56.00
TP3= @ 54.10
TP4= @ 52.20
TP5= @ 49.50
TP6= @ 48.10
TP7= @ 45.80
TP8= @ 42.60
TP9= Free

Big Decision Time for West Texas Oil - WTICOUSDWe are at an important decision for WTICOUSD, here are two very possible outcomes . The first is illustrated with the green arrows, and the second is in red. I trade triangles as a continuation pattern rather than a reversal pattern, so I am looking for an upside breakout of the triangle with a retest confirming we will move higher. If we break to the downside of the triangle and the long term support trend-line we could see some serious downside action.

WTI Fibonacci Support Resistance Zones: Crude Oil as of Jun 17These zones are calculated using Fibonacci Ratios of past price moves.
Fib extensions and retracements are projected forward in time and price.
If price bounces or reverses, it will probably do so at one of these zones.
Some zones will match previous highs and lows, since Fibs are derived from the extremes.
Some zones will not match anything previous, but they are Fib multiples and THOSE are the important ones.
Zones that are far from current price will be either WIDE or just a LINE. Just a line indicates important Fib Ratio.
Where prices overlap on the zone lines, drag the Right (price) Axis up to magnify and reduce overlap vertically.
There are zones above and below the current price range, Drag the Chart up/down to see other zones.
Drag bottom axis to the left to magnify the candle size to view close up, or to the right to view larger time frame.
I will update as new zones are defined by upcoming Fibs.

Oil heading higher?Decisionpoint: break or reject.
Rejection candles on the bottom show good potential breakout

WTI looking for Bounce to short more: US Crude Oil to drop moreThis is an idea to ADD to my Shorts.
I originally went short per this plan:
Now looking for spots to add more shorts, because I am pretty sure it will dip some more, hopefully to the targets shown.

WTI scalp Short triggered: US Crude Oil downHave been heavily short for a while now.
Looking to add more shorts on bounces as I think it will drop more.
My entry points are based on Fib Calculations and Confluences thereof.
This entry triggered by this plan:
My shorts first started with this plan:

[US-OIL] Another red wave for oil?
Weekly chart is showing that the upside momentum is slowing down which may indicate the first move of a downtrend.
If price goes above 67.60, bullish outlook.
If price goes below 65.60, bearish outlook.

Update on Long-Term Oil ChartGood bounce and confirm on the ascending wedge breakout from a month-or-so back.
See original analysis.
