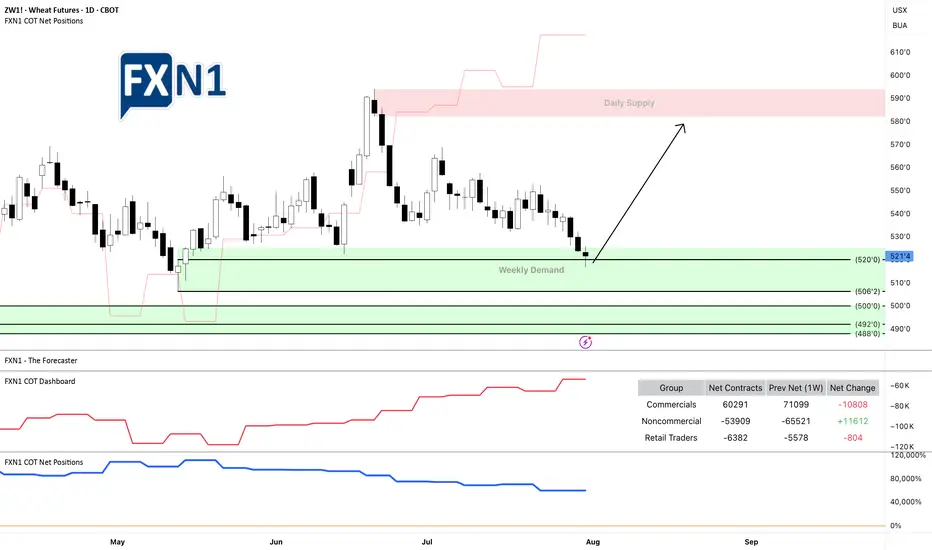
Is Wheat ZW1 Ready for a Long Trade? Key Demand Area InsightsThe futures of Wheat ZW1! are reaching a weekly demand zone, where we observe non-commercials going long and retail traders holding short positions. This could present a potential setup for a long trade. Note: There is another demand area below, but the positions of commercials are less clear compared to non-commercials and retail traders.
Always manage your risk carefully if you agree with my analysis, and be sure to develop your own trading plan.
✅ Please share your thoughts about ZW1! in the comments section below and HIT LIKE if you appreciate my analysis. Don't forget to FOLLOW ME; you will help us a lot with this small contribution.
Wheat
Rain or Ruin? Analyzing Wheat Prices During Precip Extremes1. Introduction: When Rain Means Risk for Wheat Traders
Rain is life for wheat crops—until it isn’t. In the world of agriculture, water is essential, but extremes in precipitation can cause just as much harm as droughts. For traders in the wheat futures market, understanding this relationship between rainfall and price action is not just useful—it’s essential.
Wheat is a crop with a long growth cycle, grown across diverse geographies like the U.S. Plains, the Canadian Prairies, Russia, and Ukraine. Each region has its own precipitation rhythm, and any disruption can ripple through the global supply chain. The question is: can weather signals—especially rainfall—be used to predict market behavior?
This article dives into that question using a data-driven lens. We categorized precipitation data and measured how wheat futures returns responded to different rainfall environments. The results? Revealing, and at times, counterintuitive.
2. The Role of Rainfall in Wheat Production
Wheat, especially spring and winter varieties, is particularly sensitive to soil moisture levels at key phases like germination, tillering, and heading. Too little rain in early development and the crop can fail to establish. Too much rain close to harvest? Risk of disease, sprouting, and quality degradation.
Traders have long known that unexpected wet or dry weeks can trigger speculative surges or hedging activity. But how do these events influence actual futures returns?
Before answering that, we need to translate rain into something traders can use: categories based on historical norms.
3. Methodology: Categorizing Rainfall and Measuring Market Response
To understand how wheat prices respond to different levels of rainfall, we analyzed weekly precipitation data across global wheat-producing regions. We normalized the data using percentiles:
Low Precipitation: Below the 25th percentile
Normal Precipitation: Between the 25th and 75th percentiles
High Precipitation: Above the 75th percentile
We then matched this categorized weather data with weekly returns from wheat futures (symbol: ZW) to explore if price behavior systematically varied depending on how wet or dry a week had been.
To test significance, we used a simple t-test comparing the mean returns of low-precip and high-precip weeks. The p-value (6.995E-06) revealed a compelling result: yes, there is a statistically significant difference.
4. Results: High Rainfall, Higher Price Volatility
The data confirms that weeks with extreme rainfall—especially those with high precipitation—often align with more volatile wheat price movements.
But here’s the twist: while low-precip weeks didn’t consistently show bullish returns, high-precip weeks correlated with negative or erratic returns. That makes sense when you think about harvest delays, rot, and declining grain quality.
Traders watching forecasts for excessive rainfall should consider the implications for grain availability and price stabilization mechanisms. This is where speculative plays or hedging via options and standard or micro futures contracts can become especially useful.
5. Interpreting the Volatility: Why the Market Reacts to Rain
Why does excessive rain lead to such uneven price behavior?
The answer lies in uncertainty. Heavy rainfall often introduces multiple variables into the equation: planting delays, logistical bottlenecks, and downgraded wheat quality due to fungal infections. For example, a wet harvest can reduce protein content, pushing millers to seek alternatives—altering both demand and supply expectations simultaneously.
This dual-sided pressure—reduced high-quality yield and uncertain export capability—tends to shake market confidence. Traders respond not just to the supply data but also to how much trust they place in the supply pipeline itself.
6. Futures Contracts: Navigating Risk with Position Size Control
Traders looking to participate in wheat price action have two main CME-listed options:
Standard Wheat Futures (ZW)
Contract Size: 5,000 bushels
Tick Size: 1/4 cent per bushel (0.0025) has a $12.50 per tick impact
Margin Requirement: Approx. $1,700 (subject to change)
Micro Wheat Futures (MZW)
Contract Size: 500 bushels (1/10th the size of the standard contract)
Tick Size: 0.0050 per bushel has a $2.50 per tick impact
Margin Requirement: Approx. $170 (subject to change)
Micro contracts like MZW offer a lower-cost, lower-risk way to trade wheat volatility—perfect for sizing into weather-related trades with precision or managing risk in a more granular fashion. Many traders use these contracts to test strategies during seasonal transitions or while responding to forecast-driven setups.
7. Visual Evidence: Price Behavior by Precipitation Category
To visually represent our findings, we used box plots to show wheat weekly returns grouped by precipitation category:
The shape of these distributions is revealing. High-precipitation weeks not only show lower average returns but also a wider range of possible outcomes—underscoring the role that rainfall extremes play in price volatility rather than just directional bias.
We are also complementing this visual with a weather map that shows real-time precipitation patterns in major wheat-growing regions. This could help traders align weather anomalies with trading opportunities.
8. Final Thoughts: The Forecast Beyond Forecasts
Precipitation isn’t just an agricultural concern—it’s a market catalyst.
Our analysis shows that rainfall extremes, particularly heavy rain, create meaningful signals for wheat traders. The price response is less about direction and more about uncertainty and volatility, which is equally important when structuring trades.
If you’re serious about trading wheat futures, don’t just watch the charts—watch the clouds.
This article is one piece in our broader series on how weather influences ag futures. Stay tuned for the next one, where we continue to decode the atmosphere’s impact on the markets.
When charting futures, the data provided could be delayed. Traders working with the ticker symbols discussed in this idea may prefer to use CME Group real-time data plan on TradingView: www.tradingview.com - This consideration is particularly important for shorter-term traders, whereas it may be less critical for those focused on longer-term trading strategies.
General Disclaimer:
The trade ideas presented herein are solely for illustrative purposes forming a part of a case study intended to demonstrate key principles in risk management within the context of the specific market scenarios discussed. These ideas are not to be interpreted as investment recommendations or financial advice. They do not endorse or promote any specific trading strategies, financial products, or services. The information provided is based on data believed to be reliable; however, its accuracy or completeness cannot be guaranteed. Trading in financial markets involves risks, including the potential loss of principal. Each individual should conduct their own research and consult with professional financial advisors before making any investment decisions. The author or publisher of this content bears no responsibility for any actions taken based on the information provided or for any resultant financial or other losses.

Rob the Wheat Market Before the Trend Escapes!🏴☠️Wheat Vault Breach: Sweet Profit Heist in Progress!🍫💰
(Thief Trader’s Swing/Day Plan – Only Bulls Allowed)
🌟Hi! Hola! Ola! Bonjour! Hallo! Marhaba!🌟
Dear Money Makers & Robbers, 🤑 💰💸✈️
We’ve cracked the code to the 🏉"WHEAT"🏉 Commodities CFD market, and now it’s time to launch a high-stakes heist based on 🔥Thief Trading style technical + fundamental analysis🔥.
🎯 Mission Objective: Infiltrate the overbought zone, where traps are set, robbers are lurking, and the market’s about to turn. The plan? Ride the bullish wave, loot the Red Zone, and vanish with sweet profits. 🏆💸
🔓 Entry Point:
"The vault is wide open!"
Buy at will — loot that bullish treasure!
⏱️ Best tactic: Set buy limits on the 15M or 30M swing low/high zones. Set alerts and stay sharp.
🛑 Stop Loss:
SL = Nearest 6H Swing Low below the MA line (520.00)
🔐 Protect your stash. Use risk-adjusted SL based on trade size and number of entries.
🎯 Target:
575.00 or escape early if the pressure builds!
⚔️ Scalper’s Note:
Only steal on the long side.
💰 Big money = Go direct
💼 Small bags = Team up with swing traders
📉 Use trailing SLs to guard your gains.
🔥Wheat Market is Bullish – Why?
☑️ Fundamentals
☑️ Macroeconomics
☑️ COT Report
☑️ Sentiment Signals
☑️ Intermarket Vibes
☑️ Seasonal Patterns
☑️ Trend Forecasts & Target Levels
👉 Dive into the data: 🔗🔗🔗
⚠️ Trading Alerts:
News releases = Danger zones!
❌ No new entries during news
✅ Trailing SL to protect ongoing raids
💥 Smash the Boost Button 💥
Support this Thief Plan and keep our crew winning daily.
💪 Rob with confidence. Win with consistency.
🎉 Thief Trading Style = Your daily cash machine.
💣Stay tuned for the next robbery blueprint!
— Your Friendly Market Criminal, 🐱👤

Heatwaves and Wheat: How Temperature Shocks Hit Prices🌾 Section 1: The Wheat–Weather Connection—Or Is It?
If there’s one crop whose success is often tied to the weather forecast, it’s wheat. Or so we thought. For decades, traders and analysts have sounded the alarm at the mere mention of a heatwave in key wheat-producing regions. The logic? Excessive heat during the growing season can impair wheat yields by disrupting pollination, shortening the grain-filling period, or damaging kernel development. A tightening supply should lead to price increases. Simple enough, right?
But here’s where the story takes an unexpected turn.
What happens when we actually analyze the data? Does heat reliably lead to price spikes in the wheat futures market? The short answer: not exactly. In fact, our statistical tests show that temperature may not have the consistent, directional impact on wheat prices that many traders believe it does.
And that insight could change how you think about risk, seasonality, and the role of micro contracts in your wheat trading strategy.
📈 Section 2: The Economics of Wheat—And Its Role in the Futures Market
Wheat isn’t just a breakfast staple—it’s the most widely grown crop in the world. It’s cultivated across North America, Europe, Russia, Ukraine, China, and India, making it a truly global commodity. Because wheat is produced and consumed everywhere, its futures markets reflect a wide array of influences: weather, geopolitics, global demand, and speculative positioning.
The Chicago Board of Trade (CBOT), operated by CME Group, is the main venue for wheat futures trading. It offers two primary wheat contracts:
Standard Wheat Futures (ZW)
Contract Size: 5,000 bushels
Tick Size: 1/4 cent per bushel (0.0025) has a $12.50 per tick impact
Margin Requirement: Approx. $1,700 (subject to change)
Micro Wheat Futures (MZW)
Contract Size: 500 bushels (1/10th the size of the standard contract)
Tick Size: 0.0050 per bushel has a $2.50 per tick impact
Margin Requirement: Approx. $170 (subject to change)
These micro contracts have transformed access to grain futures markets. Retail traders and smaller funds can now gain precise exposure to weather-driven moves in wheat without the capital intensity of the full-size contract.
🌡️ Section 3: Weather Normalization—A Smarter Way to Measure Impact
When analyzing weather, using raw temperature values doesn’t paint the full picture. What’s hot in Canada might be normal in India. To fix this, we calculated temperature percentiles per location over 40+ years of historical weather data.
This gave us three weekly categories:
Below 25th Percentile (Low Temp Weeks)
25th to 75th Percentile (Normal Temp Weeks)
Above 75th Percentile (High Temp Weeks)
Using this approach, we grouped thousands of weeks of wheat futures data and examined how price returns behaved under each condition. This way, we could compare a “hot” week in Ukraine to a “hot” week in the U.S. Midwest—apples to apples.
🔄 Section 4: Data-Driven Temperature Categories and Wheat Returns
To move beyond anecdotes and headlines, we then calculated weekly percent returns for wheat futures (ZW) for each of the three percentile-based categories.
What we found was surprising.
Despite common assumptions that hotter weeks push wheat prices higher, the average returns didn’t significantly increase during high-temperature periods. However, something else did: volatility.
In high-temp weeks, prices swung more violently — up or down — creating wider return distributions. But the direction of these moves lacked consistency. Some heatwaves saw spikes, others fizzled.
This insight matters. It means that extreme heat amplifies risk, even if it doesn't create a reliable directional bias.
Traders should prepare for greater uncertainty during hot weeks — an environment where tools like micro wheat futures (MZW) are especially useful. These contracts let traders scale exposure and control risk in turbulent market conditions tied to unpredictable weather.
🔬 Section 5: Statistical Shock—The t-Test Revelation
To confirm our findings, we ran two-sample t-tests comparing the returns during low vs. high temperature weeks. The goal? To test if the means of the two groups were statistically different.
P-Value (Temp Impact on Wheat Returns): 0.354 (Not Significant)
Conclusion: We cannot reject the hypothesis that average returns during low and high temp weeks are the same.
This result is counterintuitive. It flies in the face of narratives we often hear during weather extremes.
However, our volatility analysis (using boxplots) showed that variance in returns increases significantly during hotter weeks, making them less predictable and more dangerous for leveraged traders.
🧠 Section 6: What Traders Can Learn from This
This analysis highlights a few key lessons:
Narratives aren’t always backed by data. High heat doesn’t always mean high prices.
Volatility increases during weather stress. That’s tradable, but not in the way many assume.
Risk-adjusted exposure matters. Micro wheat futures (MZW) are ideal for navigating weather-driven uncertainty.
Multi-factor analysis is essential. Weather alone doesn’t explain price behavior. Global supply chains, speculative flows, and other crops’ performance all play a role.
This article is part of a growing series where we explore the relationship between weather and agricultural futures. From corn to soybeans to wheat, each crop tells a different story. Watch for the next release—we’ll be digging deeper into more effects and strategies traders can use to capitalize on weather.
When charting futures, the data provided could be delayed. Traders working with the ticker symbols discussed in this idea may prefer to use CME Group real-time data plan on TradingView: www.tradingview.com - This consideration is particularly important for shorter-term traders, whereas it may be less critical for those focused on longer-term trading strategies.
General Disclaimer:
The trade ideas presented herein are solely for illustrative purposes forming a part of a case study intended to demonstrate key principles in risk management within the context of the specific market scenarios discussed. These ideas are not to be interpreted as investment recommendations or financial advice. They do not endorse or promote any specific trading strategies, financial products, or services. The information provided is based on data believed to be reliable; however, its accuracy or completeness cannot be guaranteed. Trading in financial markets involves risks, including the potential loss of principal. Each individual should conduct their own research and consult with professional financial advisors before making any investment decisions. The author or publisher of this content bears no responsibility for any actions taken based on the information provided or for any resultant financial or other losses.

Breadbasket Basics: Trading Wheat Futures🟡 1. Introduction
Wheat may be a breakfast-table staple, but for traders, it’s a globally sensitive asset — a commodity that reacts to geopolitics, climate patterns, and shifting demand from dozens of countries.
Despite its critical role in food security and its status as one of the most traded agricultural commodities, wheat is often overlooked by traders who focus on corn or soybeans. Yet wheat offers a unique combination of liquidity, volatility, and macro sensitivity that makes it highly attractive for both hedgers and speculators.
If you’re new to trading wheat, this guide gives you a solid foundation: how the wheat market works, who the key players are, and what makes wheat such a dynamic futures product.
🌍 2. Types of Wheat and Where It Grows
One of the first things traders need to understand is that wheat is not a single, uniform product. It’s a diverse group of grain types, each with its own characteristics, end uses, and pricing dynamics.
The major classes of wheat include:
Hard Red Winter (HRW): High-protein wheat grown in the central U.S. — used in bread and baking.
Soft Red Winter (SRW): Lower protein, used for pastries and crackers.
Hard Red Spring (HRS): Grown in the Northern Plains; prized for high gluten content.
Durum Wheat: Used for pasta, grown mainly in North Dakota and Canada.
White Wheat: Grown in the Pacific Northwest; used for noodles and cereals.
Each class responds differently to weather, demand, and regional risks — giving traders multiple ways to diversify or hedge.
Major global producers include:
United States
Russia
Canada
Ukraine
European Union
Australia
India
These regions experience different planting and harvesting calendars — and their weather cycles are often out of sync. This creates trading opportunities year-round.
🛠️ 3. CME Group Wheat Contracts
Wheat futures are traded on the Chicago Board of Trade (CBOT), part of the CME Group.
Here are the two key contracts:
o Standard Wheat
Ticker: ZW
Size = 5,000 bushels
Tick = 0.0025 = $12.50
Margin = ~$1,750
o Micro Wheat
Ticker: MZW
Size = 500 bushels
Tick = 0.0050 = $2.50
Margin = ~$175
Keep in mind that margins are subject to change — always confirm with your broker. Micro contracts are ideal for scaling in/out of trades or learning market structure without large capital risk.
📅 4. Wheat’s Seasonality and Supply Chain
Unlike corn or soybeans, wheat is planted and harvested across multiple seasons depending on the variety and geography.
In the U.S., winter wheat (HRW and SRW) is planted in the fall (September–November) and harvested in early summer (May–July). Spring wheat (HRS) is planted in spring (April–May) and harvested late summer.
Globally, things get even more staggered:
Australia’s wheat is harvested in November–December
Ukraine and Russia harvest in June–August
Argentina’s crop comes off the fields in December–January
This scattered global schedule means news headlines about one country’s weather or war (think Ukraine in 2022) can quickly shift sentiment across the entire futures curve.
📈 5. Who Trades Wheat and Why
Wheat is traded by a wide range of participants — each with their own objectives and strategies. Understanding their behavior can give you an edge in anticipating market moves.
Commercial hedgers:
Farmers lock in prices to protect against adverse weather or market crashes.
Grain elevators and exporters use futures to manage inventory risk.
Flour mills hedge their input costs to protect profit margins.
Speculators:
Hedge funds and CTAs trade wheat based on global macro trends, weather anomalies, or technical setups.
Retail traders increasingly use micro contracts to gain exposure to agricultural markets with lower capital risk.
Spread traders bet on pricing differences between wheat classes or harvest years.
🔍 For retail traders especially, micro contracts like XW open the door to professional markets without oversized exposure.
🧠 6. What Makes Wheat Unique in Futures Markets
Wheat is often considered the most geopolitically sensitive of the major grains. Here’s why:
Price can spike fast — even on rumor alone (e.g., export bans or missile strikes near ports).
Production risks are global — the market reacts not just to the U.S. crop, but to conditions in Russia, Ukraine, and Australia.
Storage and quality matter — protein levels and moisture content affect milling demand.
Unlike corn, wheat doesn’t have a single dominant industrial use (like ethanol). This means food demand is king, and food security often drives policy decisions that affect futures pricing.
📌 7. Summary / Takeaway
Wheat may not get as much media attention as corn or soybeans, but it’s a deeply important — and deeply tradable — market. Its global footprint, class differences, and sensitivity to weather and politics make it a must-know for serious agricultural futures traders.
Whether you're just starting out or looking to diversify your trading playbook, understanding wheat is an essential step. Learn its rhythms, follow its news, and respect the fact that every crop cycle brings a new story to the market.
🧭 This article is part of an ongoing educational series exploring futures trading in agricultural commodities.
📅 Watch for the next release: “Soybeans: The Global Protein Powerhouse.”
When charting futures, the data provided could be delayed. Traders working with the ticker symbols discussed in this idea may prefer to use CME Group real-time data plan on TradingView: www.tradingview.com - This consideration is particularly important for shorter-term traders, whereas it may be less critical for those focused on longer-term trading strategies.
General Disclaimer:
The trade ideas presented herein are solely for illustrative purposes forming a part of a case study intended to demonstrate key principles in risk management within the context of the specific market scenarios discussed. These ideas are not to be interpreted as investment recommendations or financial advice. They do not endorse or promote any specific trading strategies, financial products, or services. The information provided is based on data believed to be reliable; however, its accuracy or completeness cannot be guaranteed. Trading in financial markets involves risks, including the potential loss of principal. Each individual should conduct their own research and consult with professional financial advisors before making any investment decisions. The author or publisher of this content bears no responsibility for any actions taken based on the information provided or for any resultant financial or other losses.

Will Dry Soil Lift Wheat's Price?Global wheat markets are currently experiencing significant attention as traders and analysts weigh various factors influencing their future price trajectory. Recent activity, particularly in key futures markets, suggests a growing consensus towards potential upward price movements. While numerous elements contribute to the complex dynamics of the grain trade, current indicators highlight specific supply-side concerns as the primary catalyst for this outlook.
A major force behind the anticipation of higher wheat prices stems from challenging agricultural conditions in significant production areas. The United States, a crucial global supplier, faces concerns regarding its winter wheat crop. Persistent dryness across key growing regions is directly impacting crop development and posing a material threat to achieving expected yields. This environmental pressure is viewed by market participants as a fundamental constraint on forthcoming supply.
Further reinforcing these concerns, official assessments of crop health have underscored the severity of the situation. Recent data from the U.S. Department of Agriculture revealed a winter wheat condition rating below both the previous year's level and average analyst expectations. This shortfall in anticipated crop health indicates a less robust supply picture than previously factored into market pricing, thereby increasing the likelihood of price appreciation as supply tightens relative to demand, even as other global factors like shifts in export prices from other regions introduce different market crosscurrents.

Start of the bullish multi year cycle Maybe witnessing the start of a multi year bullish cycle. Not only prior highs seem a great return, but the possibility of a giant cup and handle pattern up to the 200% extension seems a great in terms of risk vs reward

I've Cracked the Bullish Code in Chicago Wheat Using COTZW (Chicago Wheat) is setup for longs based on COT positioning and other fundamental indicators.

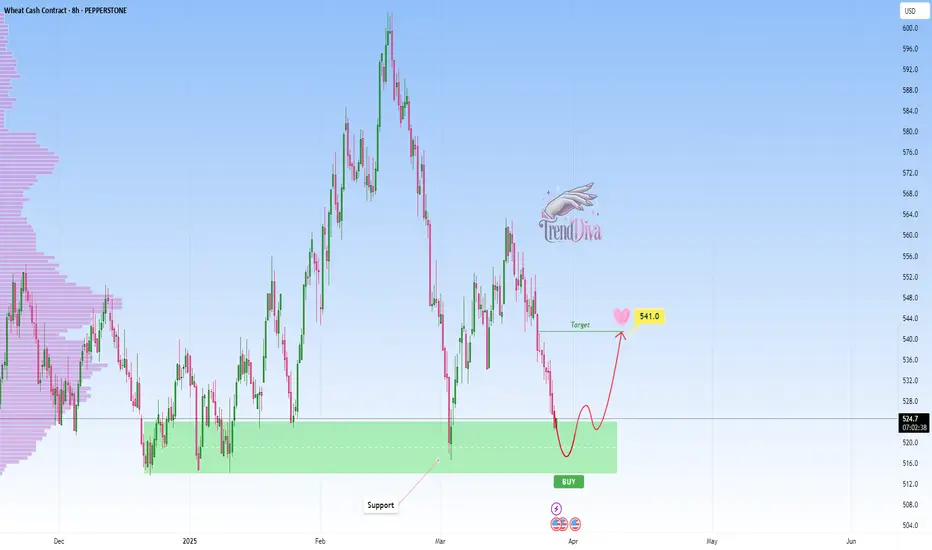
WHEAT at Key Support Level - Will Price Rebound to 541$?PEPPERSTONE:WHEAT has reached a major support level, an area where buyers have previously shown strong interest. This area has previously acted as a key demand zone, increasing the likelihood of a bounce if buyers step in.
A bullish confirmation, such as a strong rejection pattern, bullish engulfing candles, or long lower wicks, would strengthen the case for a move higher. If buyers step in, the price could rally toward the 541$ target. However, a decisive breakdown below this support would invalidate the bullish scenario and could lead to further downside.
This is not financial advice but rather how I approach support/resistance zones. Remember, always wait for confirmation, like a rejection candle or volume spike before jumping in.
Best of luck , TrendDiva
ZW! | InformativeCBOT:ZW1!
Buy at support and sell at resistance. This pattern has worked for over a year, and based on data analysis and trends, it will likely continue—easy profit.

Inflation Leading Indicator Data with Agricultural Commodities Inflation leading indicator data is not derived solely from CPI numbers; more importantly, we must consider what drives these CPI numbers. By understanding this, we can stay ahead of the mass market.
Looking at past trends, we can observe that CPI numbers and agricultural commodities tend to move in tandem.
In this discussion, we will explore why agricultural commodities are an effective tool for projecting inflation direction and examine where these commodities may be heading.
Micro Agriculture Futures:
. Corn: MZC
. Wheat: MZW
. Soybean: MZS
. Soybean Oil: MZL
. Soybean Meal: MZM
Disclaimer:
• What presented here is not a recommendation, please consult your licensed broker.
• Our mission is to create lateral thinking skills for every investor and trader, knowing when to take a calculated risk with market uncertainty and a bolder risk when opportunity arises.
CME Real-time Market Data help identify trading set-ups in real-time and express my market views. If you have futures in your trading portfolio, you can check out on CME Group data plans available that suit your trading needs www.tradingview.com
Trading the Micro: www.cmegroup.com

WHEAT Approaching Key Support - Will Price Rebound to 550$?PEPPERSTONE:WHEAT is approaching a key support level, an area where buyers have previously shown strong interest. The recent bearish movement suggests that price may soon be testing this level, potentially setting up for a rebound.
A bullish confirmation, such as a strong rejection pattern, bullish engulfing candles, or long lower wicks, would strengthen the case for a move higher. If buyers step in, the price could rally toward the 550$ target. However, a decisive breakdown below this support would invalidate the bullish scenario and could lead to further downside.
This is not financial advice but rather how I approach support/resistance zones. Remember, always wait for confirmation, like a rejection candle or volume spike before jumping in.
Best of luck , TrendDiva

WHEAT at Key Support Zone – Bullish Bounce ExpectedPEPPERSTONE:WHEAT has approached a key support zone, marked by previous price reactions and strong buying interest. This area has previously acted as a demand zone, increasing the likelihood of a bullish bounce if buyers step in.
The current market structure suggests that if the price confirms support within this zone, we could see a reversal toward 573.0, a logical target based on prior price behavior and current structure. A clear bullish signal, such as a rejection wick or bullish engulfing candle, would strengthen this outlook.
However, if the price breaks below this support zone, the bullish scenario may be invalidated, signaling potential further downside.
Just my take on support and resistance zones—not financial advice. Always confirm your setups and trade with solid risk management.
Best of luck!

"WHEAT" Cash CFD Commodities Market Bullish Heist Plan🌟Hi! Hola! Ola! Bonjour! Hallo!🌟
Dear Money Makers & Thieves, 🤑 💰🐱👤🐱🏍
Based on 🔥Thief Trading style technical and fundamental analysis🔥, here is our master plan to heist the "WHEAT" Cash CFD Commodities Market market. Please adhere to the strategy I've outlined in the chart, which emphasizes long entry. Our aim is the high-risk Red Zone. Risky level, overbought market, consolidation, trend reversal, trap at the level where traders and bearish robbers are stronger. 🏆💸Book Profits wealthy and safe trade.💪🏆🎉
Entry 📈 : "The vault is wide open! Swipe the Bullish loot at any price - the heist is on!
however I advise placing Place Buy limit orders within a 15 or 30 minute timeframe. Entry from the most recent or closest low or high level should be in retest.
Stop Loss 🛑:
Thief SL placed at the recent / nearest low level Using the 2H timeframe (568.0) swing trade basis.
SL is based on your risk of the trade, lot size and how many multiple orders you have to take.
Target 🎯:
1st Target - 594.0 (or) Escape Before the Target
Final Target - 616.0 (or) Escape Before the Target
Scalpers, take note 👀 : only scalp on the Long side. If you have a lot of money, you can go straight away; if not, you can join swing traders and carry out the robbery plan. Use trailing SL to safeguard your money 💰.
📰🗞️Fundamental, Macro, COT, Sentimental Outlook:
🌾"WHEAT" Cash CFD Commodities Market is currently experiencing a bullish trend,., driven by several key factors.
🌿Fundamental Analysis
Supply and Demand: Global wheat production is expected to increase by 2% in 2025, driven by favorable weather conditions in major producing countries
Weather Conditions: Weather forecasts indicate a high probability of drought in key wheat-producing regions, which could impact yields and support prices
Global Economic Trends: The ongoing global economic recovery is expected to drive up demand for wheat, particularly from emerging markets
Trade Policies: The recent trade agreements between major wheat-producing countries are expected to increase global wheat trade and support prices
🌿Macro Economics
Global GDP Growth: The World Bank forecasts global GDP growth to accelerate to 3.4% in 2025, up from 3.2% in 2024
Inflation Rate: Global inflation is expected to rise to 3.8% in 2025, driven by increasing demand and supply chain disruptions
Interest Rates: Central banks are expected to maintain low interest rates in 2025, supporting commodity prices
Unemployment Rate: The global unemployment rate is expected to decline to 5.4% in 2025, driven by job growth in emerging markets.
🌿COT Data
Net Long Positions: Institutional traders have increased their net long positions in wheat to 55%
COT Ratio: The COT ratio has risen to 2.2, indicating a bullish trend
Open Interest: Open interest in wheat futures has increased by 10% over the past month, indicating growing investor interest
🌿Sentimental Outlook
Institutional Sentiment: 60% bullish, 40% bearish
Retail Sentiment: 55% bullish, 45% bearish
Market Mood: The overall market mood is bullish, with a sentiment score of +30
🌿Technical Analysis
Moving Averages: 50-period SMA: 565.0, 200-period SMA: 540.0.
Relative Strength Index (RSI): 4-hour chart: 62.21, daily chart: 58.14.
Bollinger Bands: 4-hour chart: 580.0 (upper band), 560.0 (lower band).
🌿Next Move Prediction
Bullish Move: Potential upside to 600.0-620.0.
Key Support Levels: 565.0, 540.0.
Key Resistance Levels: 600.0, 620.0.
🌿Overall Outlook
The overall outlook for wheat is bullish, driven by a combination of fundamental, technical, and sentimental factors. The expected increase in global wheat demand, favorable weather conditions, and low interest rates are all supporting the bullish trend. However, investors should remain cautious of potential downside risks, including changes in global trade policies and unexpected weather events.
⚠️Trading Alert : News Releases and Position Management 📰 🗞️ 🚫🚏
As a reminder, news releases can have a significant impact on market prices and volatility. To minimize potential losses and protect your running positions,
we recommend the following:
Avoid taking new trades during news releases
Use trailing stop-loss orders to protect your running positions and lock in profits
📌Please note that this is a general analysis and not personalized investment advice. It's essential to consider your own risk tolerance and market analysis before making any investment decisions.
📌Keep in mind that these factors can change rapidly, and it's essential to stay up-to-date with market developments and adjust your analysis accordingly.
💖Supporting our robbery plan will enable us to effortlessly make and steal money 💰💵 Tell your friends, Colleagues and family to follow, like, and share. Boost the strength of our robbery team. Every day in this market make money with ease by using the Thief Trading Style.🏆💪🤝❤️🎉🚀
I'll see you soon with another heist plan, so stay tuned 🤑🐱👤🤗🤩

WHEAT at Key Resistance Zone - Sellers Ready to Step In?PEPPERSTONE:WHEAT is approaching a key resistance zone, an area that has previously triggered strong selling pressure, making it a key level to watch.
If rejection occurs—such as wicks, bearish engulfing patterns, or a shift in momentum—sellers could regain control, driving the price lower toward the 559.0 target. This aligns with a short-term pullback scenario within the broader market structure. However, a sustained breakout above this resistance would invalidate the bearish outlook, potentially opening the door for further upside.
This is not financial advice but rather how I approach support/resistance zones. Remember, always wait for confirmation, like a rejection candle or volume spike before jumping in.
Please boost this post, every like and comment drives me to bring you more ideas! I’d love to hear your perspective in the comments.
Best of luck , TrendDiva

WHEAT – Signs of Weakness, Could a Short Be Next?PEPPERSTONE:WHEAT is within a clear resistance zone that has times before led to bearish reversals. In any case, this zone marked by previous price rejections, could once again attract selling pressure.
If bearish confirmation occurs—through rejection wicks, bearish engulfing candles, or a decrease in buying volume—we could see a decline toward the 544,00 level.
However, I’ll be watching for strong support reactions or signs of exhaustion before confirming the next move.
Just my take on support and resistance zones—not financial advice. Always confirm your setups and trade with solid risk management!
What’s your take on the potential trend of this chart? I’d love to hear your perspective in the comments.
Best of luck , TrendDiva

"WHEAT" Commodity CFD Market Bullish Heist Plan🌟Hi! Hola! Ola! Bonjour! Hallo!🌟
Dear Money Makers & Robbers, 🤑 💰
Based on 🔥Thief Trading style technical and fundamental analysis🔥, here is our master plan to heist the "WHEAT" Commodity CFD market. Please adhere to the strategy I've outlined in the chart, which emphasizes long entry. Our aim is the high-risk Red Zone. Risky level, overbought market, consolidation, trend reversal, trap at the level where traders and bearish robbers are stronger. Be wealthy and safe trade.💪🏆🎉
Entry 📈 : Traders & Thieves with New Entry A bull trade can be initiated at any price level.
however I advise placing Buy limit orders within a 15 or 30 minute timeframe. Entry from the most recent or closest low or high level should be in retest.
Stop Loss 🛑: Using the 4H period, the recent / nearest low or high level.
Target 🎯: 5.700 (or) Escape Before the Target
Scalpers, take note 👀 : only scalp on the Long side. If you have a lot of money, you can go straight away; if not, you can join swing traders and carry out the robbery plan. Use trailing SL to safeguard your money 💰.
Fundamental Outlook 📰🗞️
Based on the current market situation and fundamental analysis, the outlook for Wheat is bullish in the short term. Prices are expected to continue rising due to supply and demand imbalances, weather-related issues, and geopolitical tensions. However, traders should be cautious of potential price volatility and keep a close eye on upcoming events that may impact wheat prices.
CURRENT FUNDAMENTALS:
Supply and Demand: The global wheat supply is currently outpacing demand, which has put downward pressure on prices. The International Grains Council (IGC) estimates that global wheat production will reach 765 million tons in 2023, up from 758 million tons in 2022.
Weather Conditions: Weather conditions in major wheat-producing countries such as the United States, Russia, and Ukraine have been favorable, which has supported wheat yields and production.
Government Policies: The US government's trade policies, including tariffs on Chinese goods, have impacted the wheat market. The US is a major wheat exporter, and trade tensions have reduced demand for US wheat.
Competition from Other Grains: Wheat is competing with other grains such as corn and soybeans for market share. The price of corn and soybeans has been relatively high, which has made wheat less attractive to buyers.
BULLISH SENTIMENT:
Weather Risks: 20% of traders and investors believe that adverse weather conditions in major wheat-producing countries could reduce wheat yields and production, which could support prices.
Trade Deals: 15% of traders and investors believe that a resolution to the US-China trade dispute could increase demand for US wheat and support prices.
Strong Demand from Importers: 10% of traders and investors believe that strong demand from importers such as Egypt and Turkey could support prices.
Trading Alert⚠️ : News Releases and Position Management 📰 🗞️ 🚫🚏
As a reminder, news releases can have a significant impact on market prices and volatility. To minimize potential losses and protect your running positions,
we recommend the following:
Avoid taking new trades during news releases
Use trailing stop-loss orders to protect your running positions and lock in profits
Please note that this is a general analysis and not personalized investment advice. It's essential to consider your own risk tolerance and market analysis before making any investment decisions.
Keep in mind that these factors can change rapidly, and it's essential to stay up-to-date with market developments and adjust your analysis accordingly.
💖Supporting our robbery plan will enable us to effortlessly make and steal money 💰💵 Tell your friends, Colleagues and family to follow, like, and share. Boost the strength of our robbery team. Every day in this market make money with ease by using the Thief Trading Style.🏆💪🤝❤️🎉🚀
I'll see you soon with another heist plan, so stay tuned 🫂

Wheat- In a Clean Resistance Zone, can it reach 542.00?Wheat is already within a critical resistance zone that has times before led to bearish reversals. In any case this area, marked by previous price rejections, could once again attract selling pressure.
If bearish confirmation occurs—through rejection wicks, bearish engulfing candles, or a decrease in buying volume—we could see a decline toward the 542,00 level. However, a breakout above this resistance would invalidate the bearish outlook and suggest potential for further upward movement. So keep an eye on that.
Wait for clear signs of rejection before considering short positions.

The Wheat Revelation: A Privilege to See the CodeThe Wheat Revelation: A Privilege to See the Code
"You’ve always felt it—the hum of something deeper beneath the markets, the unseen forces at play. Today, you are invited to glimpse the truth."
The Commitment of Traders (COT) strategy has unveiled another red pill: the Wheat market is primed for a bullish move. This is no ordinary signal; it is a rare alignment of forces, a convergence of codes that point to a potential market shift. But we do not act blindly. We do not rush headlong into the storm. Instead, we wait for the signal—a confirmed bullish trend change on the daily timeframe. Patience will unlock the reward.
Let me show you the code:
CODE 1: The COT Index
The commercials, the smartest players in the market, are very long relative to the 26-week index lookback. This positioning is not noise; it’s a whisper from those who understand the market’s heartbeat better than anyone else.
CODE 2: Net Positioning Extremes
Commercials are hovering around their maximum long positioning since December 2023. But it gets better: we see the "Bubble Up" phenomenon between the net positions of Commercials and Large Specs. This divergence is a hallmark of major market turning points.
CODE 3: Open Interest
The recent multi-week downtrend has coincided with a large increase in Open Interest. The question is: who is driving this increase? The answer is as bullish as it is clear—Commercials are loading up, signaling a seismic shift beneath the surface.
CODE 4: Valuation
Wheat is undervalued relative to US Treasuries. This imbalance cannot persist indefinitely. Markets correct, and when they do, the opportunity to ride the wave is immense.
CODE 5: True Seasonal Strength
Seasonality is on our side. History tells us that Wheat often exhibits strength until May, and this year appears no different.
CODE 6: Accumulation
The code is crystal clear:
Bullish spread divergence between front and next-month contracts.
Indicators like POIV, Insider Accumulation Index, and ProGo point to heavy accumulation by smart money.
CODE 7: Large Speculators Moving to Buy Side
In this week’s COT data, we see the Large Speculators reducing their shorts. The Large Specs are the ones that will drive a trend. It appears that maybe, the large specs see what you and I see, and are preparing for an impending bullish move.
Other Signals of Strength
Technical indicators like %R, Ultimate Oscillator, and Stochastic all converge, painting a picture of imminent bullish potential.
What Does This Mean for Us?
We do not jump into the market simply because the conditions are ripe. Instead, we wait for confirmation. A bullish trend change on the daily timeframe is the key that unlocks the door. Until then, we prepare. We watch. We wait.
Are you ready to see beyond the noise of the markets? To decode the signals others overlook? Follow me for more insights, and if you’re ready to take the red pill, join me on this journey to uncover the truth behind the markets. The choice is yours.

ZW | Wheat | InfoCBOT:ZW1!
The Wheat Futures (ZW) market is currently in oversold territory across all timeframes. On the 30-minute chart, the RSI is below 10, a condition that is exceptionally rare and indicative of potential exhaustion in selling pressure.
Analysis:
Overall Trend: The overall trend remains bearish, as confirmed by the series of lower highs and lower lows visible on the chart.
Expectation: Despite the bearish trend, I anticipate the possibility of a counter-rally from the current levels. However, there is a lesser probability of the price moving further down to test the next major support, which I have identified as the extreme pain point.
Actionable Plan:
Key Levels: The chart features clearly marked Bullish (530’4) and Bearish (527’4) lines. These serve as critical breakout zones.
A break above 530’4 signals a safer entry for a long position, targeting the bullish retracement levels.
A break below 527’4 confirms further downside momentum, justifying a short position, targeting the bearish support levels.
Price Targets:
Bearish Targets: Calculated based on support zones, with the immediate levels at 520’0 and 514’2.
Bullish Targets: Based on Fibonacci retracement levels, which align precisely with key resistance areas.
Conclusion:
I recommend waiting for a confirmed breakout of either the Bullish Line (530’4) or the Bearish Line (527’4) before entering a position. This approach minimizes risk while capitalizing on the momentum toward clearly defined price targets.

Unlocking the Wheat Matrix: The Code to Dominating CommoditiesUnlocking the Wheat Matrix: The Code to Dominating Commodities
What if I told you there is a way to see the hidden signals of the market? To move not with the herd but ahead of it, where clarity reigns and profits follow. This week, we delve into Wheat (ZW) — a market where the COT strategy reveals its secrets. The choice is yours: read on and learn, or remain blind to the patterns all around you.
Decoding the Setup
Understand this: this is not an invitation to blindly leap into the market. No, we wait. Patience is the cornerstone of mastery. When the technical tools confirm the market’s strength, only then do we act. Now, let’s break down the wheat matrix:
Code 1: Commercial and Small Speculator Positioning
The Commercial COT Index, using a 26-week lookback, reveals that commercials are at an extreme in long positioning. At the same time, the Small Speculator COT Index shows small specs aligning at a similar extreme. In the wheat market, unlike others, we follow the small specs rather than fading them. A deviation from the norm—an anomaly in the matrix.
Code 2: Commercial Extremes in Net Positioning
Commercial entities are nearing their most bullish stance in three years. History whispers a truth: when commercials move like this, the market often follows.
Code 3: Contrarian Signal from Investment Advisors
The masses of investment advisors are overwhelmingly bearish. Against this backdrop, the extreme bullish positioning of commercials sends a powerful contrarian signal. The matrix is showing its hand.
Code 4: Valuation Metrics
Wheat stands undervalued against U.S. Treasuries. When value aligns with positioning, the code becomes clearer.
Code 5: Seasonal Patterns
Seasonal truths tell us that wheat’s true bottom often forms in early January. This aligns perfectly with the cyclical and technical signals currently emerging.
Additional Signs in the Matrix
Spread Divergence: Bullish spread divergence between front and next month contracts.
Accumulation Indicators: Insider Accumulation Index and Williams ProGo confirm accumulation.
Technical Tools: %R is in the buy zone, and Weekly Ultimate Oscillator Divergence further supports the bullish narrative.
Cycles: The Recurring Patterns
44-Month Cycle: A major bottom forms now.
830-Day Cycle: Signals an upward move into March.
151/154-Day Cycles: Align with a cyclical bottom occurring now, projecting strength into March.
The Red Pill of Action
With these signals converging, the urge to act immediately can feel irresistible. Don’t. The matrix requires patience. Let the market reveal its strength. When the time comes, you’ll ride the wave with confidence.
The Path to Mastery
Trading isn’t merely a series of moves; it’s a philosophy. The COT strategy is a key, but only those who seek mastery will unlock its full potential. If you’re ready to see the market for what it truly is, join Tradius Trades. Here, we don’t just navigate the matrix of commodities—we redefine it. Are you ready to free your mind?

Wheat low risk Zone...Wheat is in low risk zone price...
First targets are clear and in any recession or war extension, it can meet higher prices...

Wheat Futures Are at a Crossroads – Here’s What I’m SeeingAlright, here’s where things stand with wheat futures, and this one feels like it’s balancing on a knife’s edge. We’re sitting right around 571, and honestly, the chart could break either way. Moments like these can be exciting, but they’re also where preparation makes all the difference—whether you catch the right move or get left chasing after it.
If the price drops below 564, we could see it slide down to 554, 543, and maybe even 535. This kind of move would likely mean that supplies are holding strong, or demand is weaker than expected. It might not happen all at once, but once that first level breaks, sellers could pile on, and each support level below becomes the next stop on the way down. It’s like the market testing where buyers are willing to step back in.
But if the bulls get their act together and push above 600, the game changes. That’s the kind of breakout that could attract a lot of momentum and send prices heading toward 620. It wouldn’t take much—maybe bad weather affecting crops or surprising export numbers—and suddenly, we’d see buyers jump back in with force. When a psychological level like 600 cracks, traders love to pile on, and things can move quickly.
This is one of those trades where you’ll want to stay sharp. Just watch the levels, have a plan, and let the market show you the way. Whether it’s a slide down or a breakout higher, there’s opportunity either way. If this breakdown helped, like, boost, follow, and drop a comment—always better when we trade together.
Mindbloome Trader
