Can Wheat hold these highs?Wheat has put in a strong performance in the last few months and has hit new recent highs. Technically at one point it looked like profit takers could force a correction back to previous mid June numbers in the late 400's. Fundamental weather news and more than likely funds having to cover their shorts for the moment have kept Wheat at these new levels. Approaching Fibonacci resistance at 565 the next Fibonacci resistance pocket could be in the early 600's if it can break here? Support at 523 then 471.
Wheat

Is wheat heading higher?3 good reasons why Wheat maybe heading higher.
Also MACD is bullish, although RSI is undecided.

WHEAT in breakout modeI see a weekly break out of a wedge pattern and above Ichimoku clouds for the wheat and expect the 2nd half of 2017 to be very bullish...like a spring being pressured to the max and now being released....Price has started making higher highs and higher lows on a weekly basis.

Future wheat Long.My 1st look at Wheat future. What are the Fundamentals for Wheat prices? I see a nice technical support off of a Monthly support.

Wheat Approaching KEY ResistanceWheat is rallying up to a key quarterly/yearly trendline projected from the major 2008 and 2012 highs which is also the upper boundary of an enormous decending wedge.
I'm watching for a high at this area over the next few months to short into a final low (ideally 2019) before breaking out of this wedge to the upside.
Bull cycle counts point towards July and October as the ideal months for the high.
I'll post more analysis and go over the opportunities once things become clearer.
Checkout my website @ PatsTrades (link is on my profile page below my picture) for my analysis on other trades like this and subscribe to avoid missing out on ideas and entries.
Thanks!!

Short wheatNo signal but touched upper limit trend so good chance to go lower to the low limit around 400

Wheat shorting opportunity before potentially going more up!Hello everyone, we have an opportunity to short this towards the highlighted target. Overall I believe this could go a lot higher.
For any questions leave a comment or DM me.
Good Luck

Wheat Long thesisThis is a market we are very very interested in, fundamentally and now technically price is now pointing to a much higher area in the long term.
We would look at pullback's as value areas to look for long signals as you can clearly see how price is heading after its very long term consolidation period.

Wheat monthly potential bottom setting upThe monthly wheatusd chart looks like it may be setting up a potential long term bottom.
+DI has crossed above -DI and has put in a solid support line at 4.090 holding for past 4 months
ADX has continued to trend up signaling a strengthening of dominant trend (+DI)
TRIX has been moving toward 0 from negative
Stoch, after being oversold for past year, has moved above 25 and continues to climb
Continue to watch 4.090 to hold. if price closes the month above this line, momentum should continue to build for up trend
Look at Weekly and Daily charts for signals to enter long position.
Weekly
4.214 is an important resistance line on weekly. A close and hold above this line weekly would signal building strength in up trend
Daily
Neither weekly or daily have clear buy signals but rather both have their ADX below 20 indicating price consolidation in all 3 time frames.


Cup and Handle Formation on Wheat FuturesIn my continuing quest of using price action and TA to find opportunities in the futures markets, I search through each futures product each day to see what the weekly charts look like. When I stumbled upon Wheat Futures, I realized that Wheat was forming a perfect cup and handle pattern on the chart. This was honestly pretty sweet because it was the first time I've found such a pattern on the chart. This is usually a very bullish signal. Although I cannot trade the futures directly on my paper trading account here, I am looking at the ETF equivalent, but haven't found that one yet.
Regardless of what the move does after this, it will provide a great data point when it comes to analyzing different chart patterns, such as the cup and handle.
As always, when entering a trade I'll look to risk no more than 1% of my capital, and look to take profits right around the 3:1 or 4:1 risk reward ratio.
All the best,
RC


Trading opportunity for Wheat (2017-05-01)It seems that wheat has finished the wave (C) down. Pay attention to whether it can break up the decline channel.
Good luck for everyone!

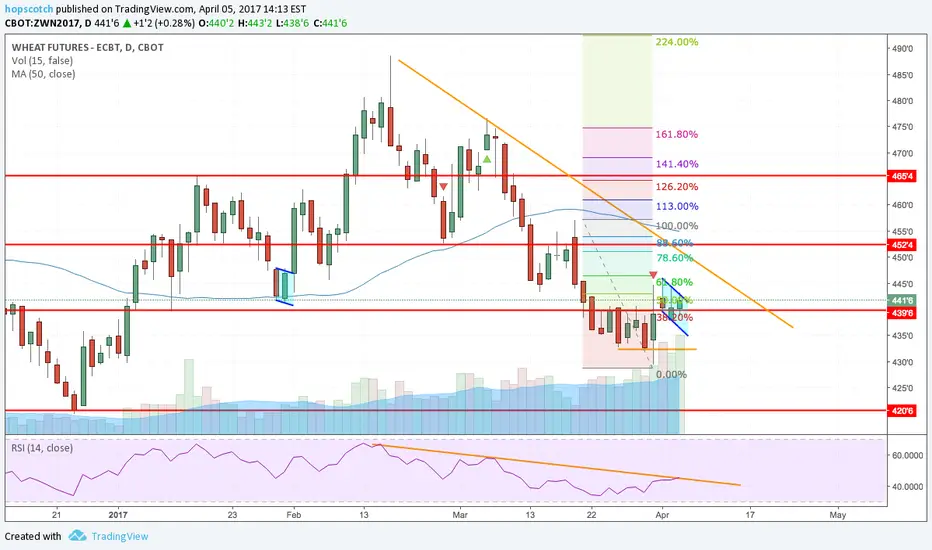
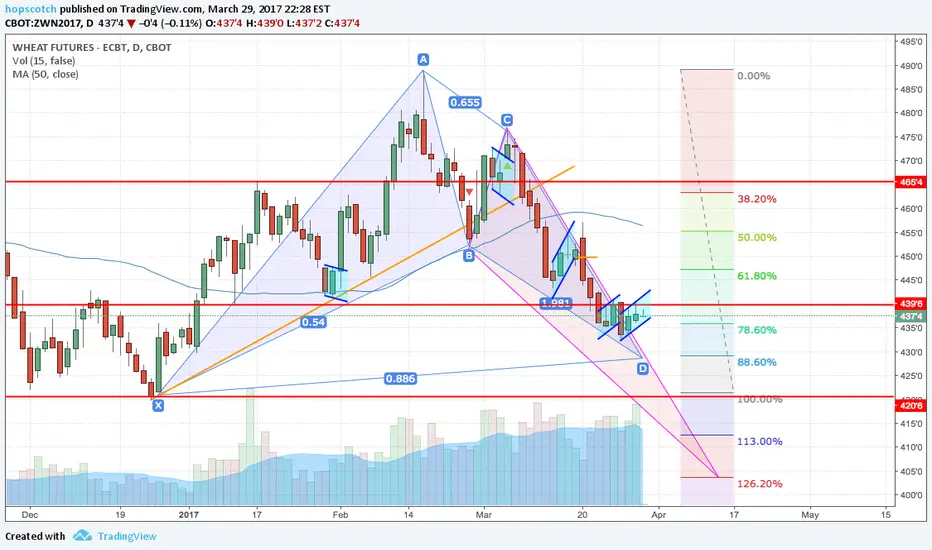
Wheat Turn Around? Cypher?Wheat RSI has floored. Elliot wave 1-5 complete, and wheat is still trying to sell itself off of a bearish flag. There is an outside chance of this becoming a Shark. More likelihood a Bearish Cypher. If up trend forms, looking at 430'4 and then 444'2. After 452. This could also fall more into extension in which case target numbers may change.

Wheat to turn at the corner?My mate @Bo here on TV gave me a heads up.
I can see the following on the chart:
- very stretched down swing
- coiling = something is cooking in here
- price landed nicely at the A/R line
The white fork is a "potential" projection of price.
If price close out of the L-MLH, then the fork is not valid anymore.
Let's see if there will be something more interesting.
I don't like to jump the gun, there is mostly a re- entry if I miss it.
But we need to stalk it for sure!
Hunt mode ON ;-)
TNX Bo for the heads up.
P!

WN2017 - July '17 Wheat FuturesAs the market made lower lows, the MACD indicator made higher highs. This is very powerful bullish divergence. Circled is where the MACD crossed over to the upside, further indicating bullishness.
Stops should be placed slightly below the most recent low of 429'4, which occurred on March 31.
Profit targets are at the Fibonacci retracement levels.
Target 1 - 459
Target 2 - 483
Target 3 - 503*
*Following the same pattern as the other upward movements would put price at this level on June 21, the summer solstice.

Wheat Still in DowntrendJuly Wheat has made a bullish flag and tried to escape it today. Wheat still in downtrend and market full of wheat right now, so still looking for further downside. Upside target reversal may come at 449 downtrend line if flag doesn't decay. If broken and stable we could see a short term turn around. RSI has come to downtrend line so caution should be taken.
Wheat - diagonal triangleThere's a possible diagonal triangle, so bears are likely going to deliver wave 5 of (C)

Wheat Bearish FlagJuly Wheat created a bearish flag today. Next downside target is 428 which would make a bullish Bat. If it goes through that and continues further we would be entering a bullish butterfly.
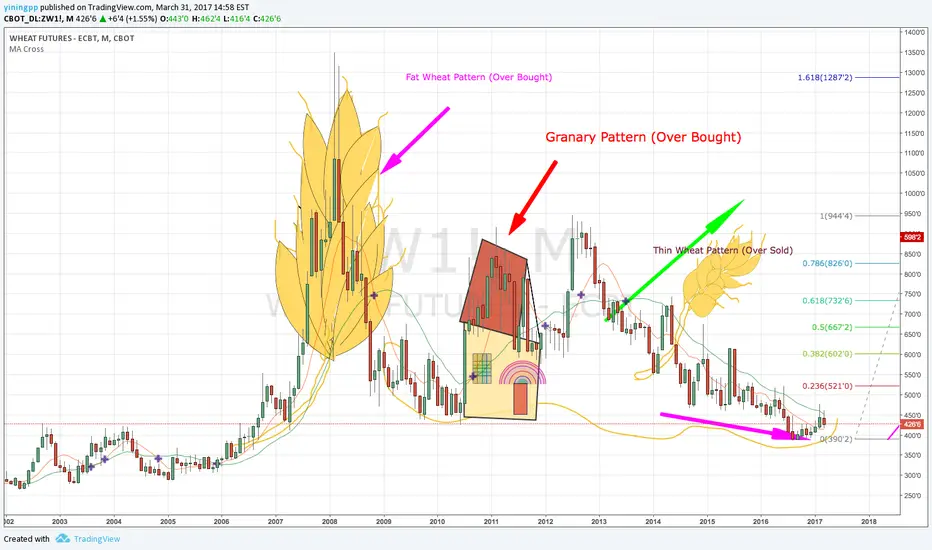
Super Bullish on Wheat Master Technical analysis - Lulu Capital
#Fat Wheat Pattern
#Thin Wheat Pattern
#Granary Pattern
#Target 600+
Wheat - Mar $4 Support?Bulled up... just a matter of weather* $4 support holds or we drop down to 3.5 levels
Trend line resistance erroded

Wheat - Waiting for the touchdown to take a flightThe A/R's doing a good job.
Now I wait to go long from the pullback at the A/R.
Patience...hunt mode on.

Wheat Bearish FlagMay Wheat is forming a bearish flag. Could fall into Cypher extension heading for a double bottom. Looking for confirmation of a start near centre of the flag downwards and continues downwards. RSI still trending downwards
