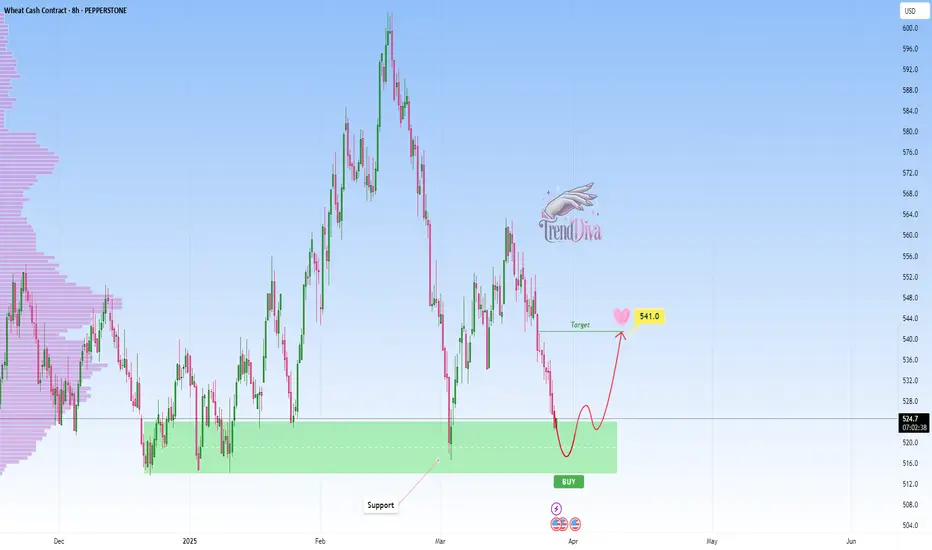
WHEAT at Key Support Level - Will Price Rebound to 541$?PEPPERSTONE:WHEAT has reached a major support level, an area where buyers have previously shown strong interest. This area has previously acted as a key demand zone, increasing the likelihood of a bounce if buyers step in.
A bullish confirmation, such as a strong rejection pattern, bullish engulfing candles, or long lower wicks, would strengthen the case for a move higher. If buyers step in, the price could rally toward the 541$ target. However, a decisive breakdown below this support would invalidate the bullish scenario and could lead to further downside.
This is not financial advice but rather how I approach support/resistance zones. Remember, always wait for confirmation, like a rejection candle or volume spike before jumping in.
Best of luck , TrendDiva
Wheatforecast
Wheat Futures Are at a Crossroads – Here’s What I’m SeeingAlright, here’s where things stand with wheat futures, and this one feels like it’s balancing on a knife’s edge. We’re sitting right around 571, and honestly, the chart could break either way. Moments like these can be exciting, but they’re also where preparation makes all the difference—whether you catch the right move or get left chasing after it.
If the price drops below 564, we could see it slide down to 554, 543, and maybe even 535. This kind of move would likely mean that supplies are holding strong, or demand is weaker than expected. It might not happen all at once, but once that first level breaks, sellers could pile on, and each support level below becomes the next stop on the way down. It’s like the market testing where buyers are willing to step back in.
But if the bulls get their act together and push above 600, the game changes. That’s the kind of breakout that could attract a lot of momentum and send prices heading toward 620. It wouldn’t take much—maybe bad weather affecting crops or surprising export numbers—and suddenly, we’d see buyers jump back in with force. When a psychological level like 600 cracks, traders love to pile on, and things can move quickly.
This is one of those trades where you’ll want to stay sharp. Just watch the levels, have a plan, and let the market show you the way. Whether it’s a slide down or a breakout higher, there’s opportunity either way. If this breakdown helped, like, boost, follow, and drop a comment—always better when we trade together.
Mindbloome Trader

Wheat price attempts to recover – AnalysisWheat price decline stopped around 740.00 areas, to start rising and hint heading to achieve expected gains in the upcoming sessions, on its way to visit 778.10 mainly.
Therefore, the bullish bias will be suggested for today, and breaching 758.50 will ease the mission of achieving the mentioned target, while breaking 745.00 will stop the expected rise and press on the price to resume the bearish track.

WHEAT, closed in Stop ProfitAfter 3 months we close our positions on wheat.
The price pulled back 25 points, leading our positions to hit the Stop Profit we had set at 769.80 to save profits, and it did.
Very good are those who have deducted part of the contracts on 50%, others on 38.2% letting the remaining part of the contracts run, very well indeed.
Now let's let the WHEAT go where it wants to go, we are far from any signal of the MCS, in February we will be in A1 of the annual and we will then evaluate any possible trade.

Wheat (US) - SHORT; SELL it!It's definitely a SHORT, for now.
The Kansas-Chicago differential also indicates a Chicago short here, and then probably a recovery into the new crop.


WHEAT FUTURES (KE1!) MonthlyThe Djinn Predictive Indicators are simple mathematical equations. Once an equation is given to Siri the algorithm provides the future price swing date. Djinn Indicators work on all charts, for any asset category and in all time frames. Occasionally a Djinn Predictive Indicator will miss its prediction date by one candlestick .
Dates in the future with the greatest probability for a price high or price low.

WHEAT FUTURES (KE1!) WeeklyThe Djinn Predictive Indicators are simple mathematical equations. Once an equation is given to Siri the algorithm provides the future price swing date. Djinn Indicators work on all charts, for any asset category and in all time frames. Occasionally a Djinn Predictive Indicator will miss its prediction date by one candlestick .
Dates in the future with the greatest probability for a price high or price low.
