They brought it down for the fill — now it's time to see who’s rBINANCE:WIFUSDT just reacted perfectly off the 0.618 golden zone at 0.827 with bullish intent. The STB 1D and FVG 1D combo formed a high-probability demand zone that Smart Money won't ignore lightly.
Here’s the bullish roadmap:
Entry: 0.788 (bottom wick through 0.618 fib)
Structure: Clear higher low with mitigation of FVG 1D
Volume: Climax candle into key levels — classic absorption
Targets:
TP1: 0.921 (mid-level fib and consolidation ceiling)
TP2: 1.015 - 1.132 (FVG to OB 1D imbalance fill)
TP3: 1.321 (full expansion target — optimal trade entry delivery)
Moonshot: 1.393 if bulls dominate past OB retest
Invalidation: Daily close below 0.692 (STB 1D)
Price doesn’t just reverse — it transfers power. This is that shift.
For more plays just like this — all based in structure and timing — check the profile for setups that speak precision, not prediction.
Wif

I didn’t chase the high. I waited for the reclaim.WIF ran the 1.048 liquidity, reversed, and now it's offering the kind of structure I don’t second-guess. This isn’t about trend — this is about reclaiming control.
Here’s the map:
Price retraced cleanly into the BPR zone between 0.944 and 0.920 — right in the middle of the fib rebalancing zone
0.618 fib sits at 0.920, which makes this entire region a Smart Money entry block
Below that is the 1H OB at 0.840 — a worst-case sweep zone if liquidity gets run
Current structure suggests a tight range building beneath the previous high — a classic setup before a displacement move into 0.999 → 1.048
Hold above BPR and reclaim 0.969? That’s your greenlight.
Execution plan:
Entry: 0.944–0.920
TP1: 0.969
TP2: 1.048
Invalid below: 0.885 — or full re-entry from the 1H OB near 0.840
The move already happened. This is the retest. You either planned for it — or you're reacting late.
Precision like this lives in the profile. Setup-first. Noise-free.

This wasn’t a bounce. It was a reclaim.BINANCE:WIFUSDT.P hit the daily OB at 0.8330 and snapped back — not with hope, but with intent.
Smart Money didn’t panic on the drop. It positioned.
Here’s the structure:
Price tapped a clean D OB, aligned perfectly with 0.618 fib — the algorithm’s comfort zone
The bounce reclaimed 1.00 fast, and the market is now flirting with internal liquidity near 1.0178 and 1.1339
Above, the real draw sits at 1.3965 — a void yet to be filled
Below, we still have W OB liquidity near 0.7260 if this rotation fails
This move doesn’t need hype. It needs follow-through. If we consolidate above 0.9299 and break into 1.0178 clean, the next phase unlocks — straight into the 1.13–1.32 range.
Execution plan:
Bias remains bullish above 0.92
Pullbacks into 0.89–0.83 are still valid long zones as long as 0.7260 doesn’t get breached
Target 1.1339 first — then 1.3965 as the higher timeframe liquidity magnet
This setup isn’t emotional. It’s engineered. You don’t need to guess when price is built to deliver.
More trades like this — real levels, real invalidations — are in the profile description.

WIF sniffs!WIF looks to sniff a bit but the OB looks very delicious atm, 35% buys at cmp but buys at the orange box looks more like a delicaisies where two instances are marked what can happen!

WIF WIF, whose there?Bit late to post as i posted it late, but however wif looks weak to break even the black line!

#WIF/USDT#WIF
The price is moving within a descending channel on the 1-hour frame, adhering well to it, and is heading for a strong breakout and retest.
We are seeing a rebound from the lower boundary of the descending channel, which is support at 1.06.
We have a downtrend on the RSI indicator that is about to be broken and retested, supporting the upward trend.
We are looking for stability above the 100 Moving Average.
Entry price: 1.068
First target: 1.115
Second target: 1.157
Third target: 1.211

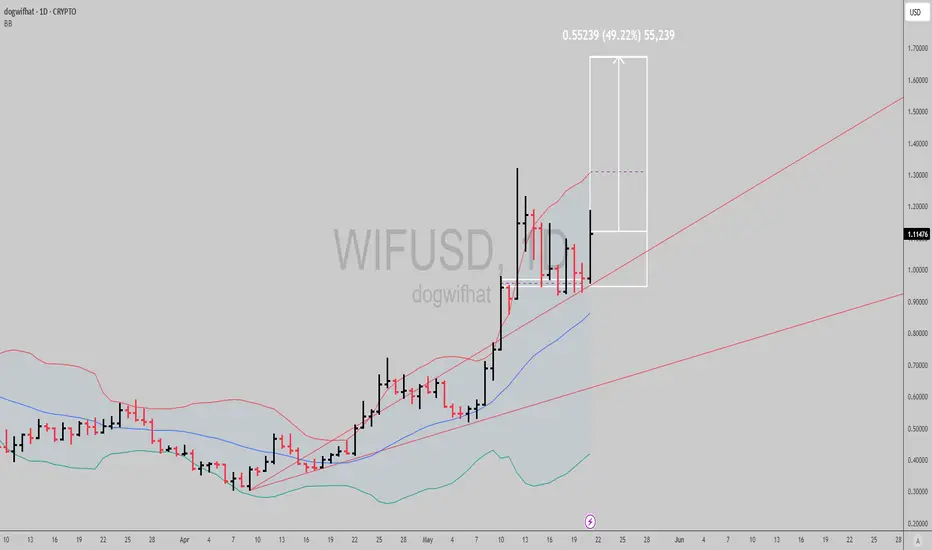
$WIF: Uptrend signal activeNice signal in SEED_WANDERIN_JIMZIP900:WIF here, the trend in the daily timeframe has been bullish since April 18th, and has been giving us multiple continuation signals to trade in and out, or scale in with low risk as we move the stop higher if playing it longer term.
If prices hold above recent lows, we can see a close to 50% run from here within a week give or take.
Best of luck!
Cheers,
Ivan Labrie.
WIFUSDT 1D Analysis WIF ~ 1D Analysis
#WIF Buy gradually after successfully breaking through this resistance line with a short-term target of at least 15%++

Continuation of the PORTO trendAccording to porto, the picture resembles alpine, the goal is also to try to take the level of 1.5 with the opening of the second half of the quarter higher, which will create the ground for a stable trend immediately to 2.5. The main medium-term goal is the range of 2.5-3.5, where large volumes of purchases were previously left. I would like to note that the level of 2.5 is the threshold for the growth of volatility, and in case of its breakdown, any growth wave can give an impulse up to 5 and 7.5. If there is insufficient volatility, there is a possibility of a rollback to a 0.9-1.0 retest and a second attempt to take 1.5 by the beginning of the new month.
Porto Lazio adm city acm does not have futures on finance yet and may be added in the near future, which will cause a wave of growth up to 100%+ for these tokens. Together with this group, I am considering alpine for work, while the rest of the fan tokens are still in a more overbought zone.

A likely move by ALPINEToday, the market looks very optimistic. The week on air opened above 2500, which compensates for sales on a weekly schedule. You can continue to keep working on fantokens to maintain growth in a row. In the absence of a significant market drawdown, an additional wave of purchases of up to 70-100% from current levels is likely. Binance also continues to support this group of instruments by adding futures. There is a possibility of a new announcement regarding atm city acm tomorrow.
To date, the fan token group remains the most undervalued instruments on binance. In addition to ATM AND ACM, which are the most oversold among them, I am considering the work of ALPINE in connection with the recent addition of futures on binance and listings on several small exchanges. These factors can contribute to significant liquidity inflows and growth. A technical signal was also left for a breakdown of the strong resistance of 1.5, which will open the way immediately to 2.5. In an optimistic scenario, an attempt to open above 1.5 in the second half of the quarter can be expected in the next few days, which will pave the way for purchases until the end of the half-year. In a more negative scenario and a drawdown of ether below 1400-1500, there is a possibility of a slight pullback and an attempt to consolidate above 1.5 for ALPINE already in the last days of the month in order to open a new monthly candle above this level. This rollback will provide an additional opportunity to top up the position and make a profit. I would like to draw your attention to the fact that the main level for increasing volatility is 2.5, in case of a breakdown of which there is a possibility of a growth impulse to 5.0 and 7.5.

WIF/USDT - Fresh meme coin. Trading setup in chanal. Popular fresh meme coin – Dogwifhat
📊 CoinMarketCap Rank: #102
🐦 Twitter (X) : 152K followers
💬 Telegram : 50K members
✅ Highly liquid meme coin – traded on many major exchanges, including Binance.
After the hype phase , the coin is now declining along with the overall crypto market —no exceptions. Essentially, it broke below multiple channel supports , and the price is now sitting at the support of the outer channel.
I also notice a non-textbook Head & Shoulders pattern, which suggests a potential -64% breakdown . The last squeeze happened around this level.
Currently, we are seeing consolidation with increased volume , along with high-wick price action in this zone.
I've marked potential downside support zones as well as upside resistance targets on the chart. Consider this in your trading strategy!

WIFUSDT: The Dog That's Howling at the Moon!🚀 WIFUSDT: The Dog That's Howling at the Moon! 🌕🐕
📊 Key Stats (May 11, 2025)
- Current Price: $0.945 (+11.97% today!)
- Volume: $61.55M (Big moves incoming!)
- Key Levels:
- Support: $0.84 (Today's low)
- Resistance: $0.999 (Break = Moon Mission)
- Take Profit: $1.100 (Next target)
🔥 Technical Breakdown
1. Massive Bounce: Up 11.97% today from $0.844
2. Volume Spike: $61M volume shows strong interest
3. Breakout Potential: Testing key resistance at $0.99
💎 Why This Trade Works
1. Meme Coin Season: Dog-themed coins heating up
2. Liquidity Pool: Deep volume at $0.80-$0.90 zone
3. Technical Setup: Bull flag forming on 4H chart
🎯 Trading Plan
- Aggressive Entry: $0.88
- Ideal Entry: $0.85 pullback
- Targets:
→ $1.100 (18% gain)
→ $1.250 (32% gain)
- Stop Loss: Below $0.80 (Key support)
⚠️ Risk Warning
Meme coins are volatile! Only risk what you can afford to lose.
📈 The Big Picture
WIF is showing strength while other meme coins consolidate. A break above $1 could trigger massive FOMO!
👍 Like/Follow for more hot crypto setups!
#WIF #Memecoin #AltSeason2025
Not financial advice - always DYOR.

#WIF/USDT#WIF
The price is moving in a descending channel on the 1-hour frame and is adhering to it well and is heading to break it strongly upwards and retest it
We have a bounce from the lower limit of the descending channel, this support is at a price of 0.650
We have a downtrend on the RSI indicator that is about to break and retest, which supports the rise
We have a trend to stabilize above the moving average 100
Entry price 0.671
First target 0.716
Second target 0.751
Third target 0.800

Waiting for a Perfect Entry! 🚀 SEED_WANDERIN_JIMZIP900:WIF in Uptrend – Waiting for a Perfect Entry! 📈
SEED_WANDERIN_JIMZIP900:WIF is currently in an uptrend! If you missed the entry, you can wait for a correction. Once the price comes back to the green zone, keep an eye out for confirmation to enter long! 🔥
Let’s catch the next opportunity together! 💼💸

When Moving Averages Meet the Demand ZoneOne of the simplest ways to identify the market trend is by using the moving average (MA) indicator.
When price moves above the MA, it's generally considered an uptrend.
When price moves below the MA, it's seen as a downtrend.
Aside from showing the trend, moving averages can also act as dynamic support and resistance:
In an uptrend, the MA acts as support — meaning if price retraces into the MA, it often bounces back and continues upward.
In a downtrend, the MA acts as resistance — price tends to reject the MA and move lower.
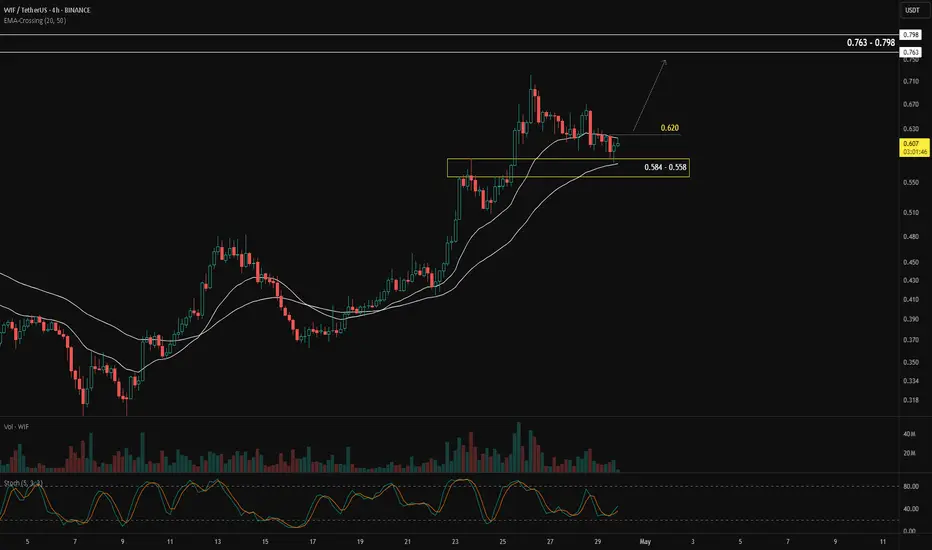
In BINANCE:WIFUSDT , the moving average is currently acting as support, and price is pulling back into a confluence zone between 0.584 – 0.558, where the MA meets a demand zone. This setup increases the probability of the pullback ending and the uptrend continuing.
The confirmation for a bullish continuation would be a break and close above 0.620.
If that happens, the next target zone is between 0.763 – 0.789.
Keep a close eye when price approaches the previous high. The ideal scenario is a strong impulsive breakout. The worst-case scenario would be a rejection or false breakout from that level.
Alright, what's your take on BINANCE:WIFUSDT ?
WIF (SPOT)BINANCE:WIFUSDT
WIF / USDT
4H time frame
analysis tools
____________
SMC
FVG
Trend lines
Fibonacci
Support & resistance
MACD Cross
EMA Cross
______________________________________________________________
Golden Advices.
********************
* Please calculate your losses before any entry.
* Do not enter any trade you find it not suitable for you.
* No FOMO - No Rush , it is a long journey.
Useful Tags.
****************
My total posts
www.tradingview.com

WIF/USDTHello friends
According to the market cycle, the price decline is ongoing and is expected to continue.
Now the only important support is the green area, which the price reaches there and we will see what reaction we get from the buyers.
Will they support the price or will the decline continue...
If you want to be with us in this alt season, send us a message.
*Trade safely with us*

WIF on the road to 6 usdWIF is breaking out of the range, next week we will see a green candle. MEME coins are on fire. Do not miss this one.
If you need more info, let me know.
NOT A FINANCIAL ADVICE
ALWAYS USE STOPLOSS AND MANAGE YOUR RISK

WIF /USDT Long SL -14.12%WIF/USDT Long Setup ( Retake )
Reason:
Breakout and Confirmation done in Internal Structure.
Strong Bullish bullish momentum with high Volume.
All technical Parameters suggesting a strong Bullish Wave.
After Successfully breakout from wedge, we can Expect a 40% bullish wave.
Pro Tips:
After Target 2, Move Stoploss to breakeven
HODL
Best Regards,
The Panda
BINANCE:WIFUSDT
MEXC:WIFUSDT
BINANCE:WIFUSDT.P
KUCOIN:WIFUSDT
BITGET:WIFUSDT.P
BINGX:WIFUSDT.P

Breaking: Dogwifhat Tanks 13% TodayBuilt on the solana ecosystem, a token embroidering the dog with a hat narrative saw its price tank 13% today amidst general crypto dip.
With the RSI at 39 could more dip be looming ahead. For now the asset is in a steep falling wedge pattern so a reversal could be feasible. Given that SEED_WANDERIN_JIMZIP900:WIF once had an All-time-high of $4.85 rising from an all time low of $0.00002344 representing a whooping +2452405.65% gains, SEED_WANDERIN_JIMZIP900:WIF could pull out such fit again with a market cap of $564.14M this adds more credence to the bullish comeback of $WIF.
dogwifhat Price Live Data
The live dogwifhat price today is $0.574867 USD with a 24-hour trading volume of $627,598,272 USD. We update our WIF to USD price in real-time. dogwifhat is down 12.29% in the last 24 hours. The current CoinMarketCap ranking is #98, with a live market cap of $574,200,548 USD. It has a circulating supply of 998,841,059 WIF coins and the max. supply is not available.

TradeCityPro | WIF: Diving into the Dynamics of a Popular Meme👋 Welcome to TradeCityPro!
In this analysis, I want to examine the coin WIF, which you requested in the comments. This project is one of the famous meme coins in the crypto world, operating on the Solana network, and it has a market cap of $655 million, ranking it 105th on CoinMarketCap.
📅 Daily Timeframe
In the daily timeframe, we are witnessing a downward trend that started from a high of 3.9560 and has continued down to 0.5852. The market volume has also converged with the trend, indicating that the selling pressure has been much stronger than buying.
❌ If you previously purchased this coin, you should have set a stop-loss after the price stabilized below 1.3886. However, if you haven’t done this yet, I cannot specify a stop-loss area for you now because there's a significant support area at 0.4464, and we need to see how the price reacts to this area.
🛒 If you're looking to buy this coin, first of all, I should mention that purchasing meme coins is very risky, and I personally neither buy meme coins nor recommend buying them. But if you want to buy this coin, you should wait for a trend reversal. For a trend change, we need a new structure to form and a suitable trigger to confirm the trend change.
🔼 If the price breaks 0.5852 and the RSI enters the oversold area, we could open a very good long-term position. A break of 34.36 in this indicator gives us the first confirmation of entering bullish momentum, but this confirmation is not reliable at all and only serves to confirm futures triggers.
⏳ 4-Hour Timeframe
In the 4-hour timeframe, I want to specify the futures triggers for you. We also have an interesting ascending channel, to which the price has reacted very well so far, and breaking this channel from any side could provide a good position.
🔍 Currently, it seems there's a range box between 0.5734 and 0.7803, which has timed the price's move from the box's floor to its ceiling.
📈 For a long position after the channel break, you can enter with a trigger of 0.7803 targeting 1.0411 and 1.345, but keep in mind that we've had a very strong downtrend, and this position is against the trend.
🔽 For a short position, our trigger is very clear, and if 0.5734 is broken, you can enter, and your target could be the bottom of the channel.
📝 Final Thoughts
This analysis reflects our opinions and is not financial advice.
Share your thoughts in the comments, and don’t forget to share this analysis with your friends! ❤️

WIF Is Going To Come Down Hard Be CarefulWIF is way overextended and overvalued. There is bearish divergence on many indicators on almost all higher timeframes. I think WIF comes down to tap the trendline at $1.40 and a small bounce then it falls swiftly into the wedge again. Where is goes from there I dont know but I will update the chart at that time.
This is not finainclal advice this is just my opinion.
LIKE, AND FOLLOW ME + THIS IDEA FOR CONSTANT UPDATES. THANK YOU

Bitcoin and altcoin overview (February 18-19)The Bitcoin scenario hasn't changed since yesterday—we are still expecting a test of key support zones, from which a full-fledged upward movement is likely to develop.
Primary target for growth: $102,000.
Sell zone:
$107,000–$109,000 (volume anomalies).
Buy zones:
Around $95,000 (strong buyer reaction, volume anomalies).
$94,000–$93,000 (volume anomalies).
$89,000–$86,300 (accumulated volumes).
Interesting Altcoins
For WIF , the trend has shifted to long on the 4H timeframe. We are waiting for a test of the $0.57 and $0.55 levels, and if there is a false breakout with a strong buyer reaction, we expect an upward movement.
