Potential Bullish Reversal for WFI (WIF/USDT)#WIF/USDT #Analysis
Description
---------------------------------------------------------------
+ The chart shows a descending channel pattern forming since the peak in early 2024. The price has respected the upper and lower bounds of this channel multiple times, indicating a strong bearish trend within this range.
+ The price is currently approaching a significant support zone around $1.80, which aligns with the lower boundary of the descending channel.
+ A breakout above the upper boundary of the channel around $2.30 could signal a potential trend reversal.
+ The EMA 100 (blue line) and EMA 55 (light blue line) are currently acting as dynamic resistance levels. A break above these moving averages would add to the bullish sentiment.
+ If the price holds above the $1.80 support level and breaks out of the descending channel, we can expect a potential move towards the $4.00 - $4.50 resistance zone. Further upside could see the price targeting the $6.50 - $7.00 levels, as indicated by the dotted arrow path.
+ The RSI is currently at 37.31, indicating that the asset is in the oversold region. A reversal in RSI towards the 50 mark would support a bullish momentum shift.
+ As long as the price remains above the $1.80 support level, there is a potential for a bullish reversal.
---------------------------------------------------------------
VectorAlgo Trade Details
------------------------------
Entry Price: $1.80 with confirmation of suppor
Stop Loss: $1.3
------------------------------
Target 1: 3.042
Target 2: 4.170
Target 3: 5.0
Target 4: 7.0
------------------------------
Timeframe:1D (Daily)
Capital Risk: 1-2% of trading amount
Leverage: 5-10x
---------------------------------------------------------------
Enhance, Trade, Grow
---------------------------------------------------------------
Feel free to share your thoughts and insights.
Don't forget to like and follow us for more trading ideas and discussions.
Best Regards,
VectorAlgo
Wif

WIF Technical Analysis in a Daily TimeframeHello everyone, I’m Cryptorphic.
For the past seven years, I’ve been sharing insightful charts and analysis.
Follow me for:
~ Unbiased analyses on trending altcoins.
~ Identifying altcoins with 10x-50x potential.
~ Futures trade setups.
~ Daily updates on Bitcoin and Ethereum.
~ High time frame (HTF) market bottom and top calls.
~ Short-term market movements.
~ Charts supported by critical fundamentals.
Now, let’s dive into this chart analysis:
WIF, in the daily timeframe, is in a correction phase and is likely to move down toward the lower support trendline between $1.50 and $1.70.
A rebound can be expected from anywhere near the support range, which could eventually push the price as high as 200% in the coming days.
Key levels:
- Support/Accumulation Range: $1.5 to $1.7.
- Primary Resistance: $2.85.
- Higher Resistance: $4.86.
- Invalidation: A close below the lower support at $1.5.
DYOR. NFA.
Please hit the like button to support my content and share your thoughts in the comment section. Feel free to request any chart analysis you’d like to see!
Thank you!
#PEACE

WIF UPDATE (12H)Now, there is good data on the chart. From where we put the red arrow on the chart, it looks like a big correction has started.
The correction seems to be a diametric.
Wave D seems to be ending.
The targets are listed on the chart.
The green area is a strong support on which we look for buy/long positions
Closing a candle above the invalidation level will violate the analysis
For risk management, please don't forget stop loss and capital management
Comment if you have any questions
Thank You

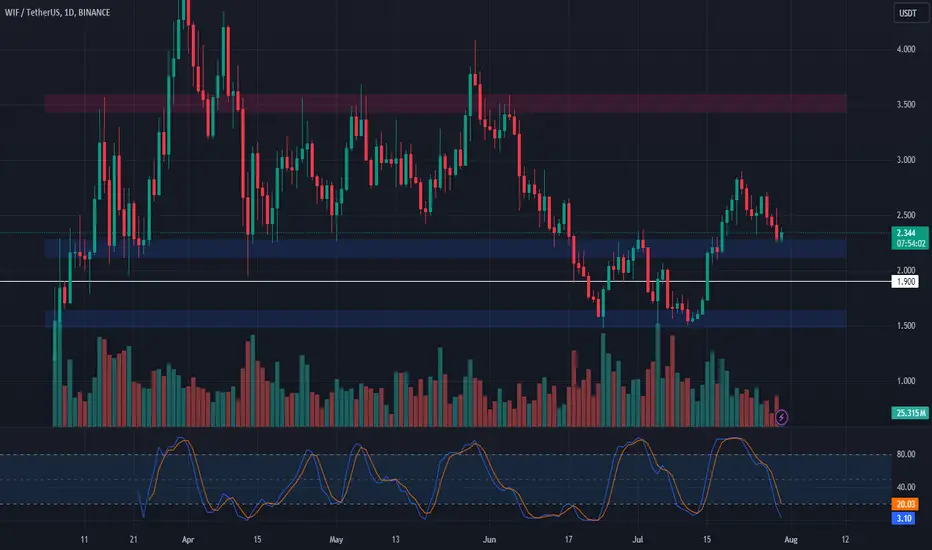
Trade Setup: WIF Long PositionMarket Context:
WIF set in a double bottom on July 11th and has since climbed 90%, establishing a higher high and breaking the downtrend.
The price is currently retracing, and we are looking for acceptance above $2. Observing this area for signs of a bounce will help in trading the breakout while setting in a higher low.
Trade Parameters:
Entry: Enter a trade between $2 and $2.2.
Take Profit:
First target: $3
Second target: $3.6
Stop Loss: Set at a daily close below $1.90
📊 Monitor price action closely around the $2 area for signs of a bounce. Ensure to manage your risk effectively and adjust the trade if market conditions change. #WIF #TradingStrategy #CryptoTrading 🎯
WIF is bearishThe large WIF structure is bearish. Price is constantly making lower L's and H's.
Every time the price moves above the demand range, it cannot make new Hs.
It has now hit good resistance.
By maintaining the swap range, it can move and drop towards the targets.
We have specified the targets on the chart.
Closing a daily candle above the invalidation level will violate the analysis.
Note that the financial market is risky, so:
Do not enter a position without setting a stop and capital management and confirmation and trigger.
When we reach the first TP, save some profit and try to move the stop continuously in the direction of your profit.
If you have any comments please post them, comments will help us improve our performance
Thanks

#Wif 1D chartCRYPTOCAP:WIF 1D chart;
A bearish harmonic pattern is present
The most important factor that can support this decline is that the market will move downwards
This pattern is automatically cancelled if the stop level on the chart is exceeded
44% decline ⏳

WIF: Key Levels and Buy StrategyThe trading volume is 438.706K WIF, indicating significant market activity.
Indicates a potential bullish trend with the SAR at $2.364.
The SMA is at $2.561, indicating that the current price is slightly above the moving average, which can be a bullish sign.
The histogram value is 0.008, MACD line is 0.008, and the signal line is -0.001, indicating a bullish trend.
%K at 79.49 and %D at 81.50, indicating near overbought conditions.
The RSI stands at 52.57, suggesting that WIF is in a neutral zone but with a bullish bias.
Market Sentiment
The market sentiment for WIF appears cautiously optimistic. While the Stochastic Oscillator indicates nearing overbought conditions, the MACD and Parabolic SAR suggest bullish momentum.
Potential Market Scenarios
Bullish Scenario:
A decisive break above the local resistance at $2.8 could lead to further upward movement, targeting the solid resistance at $3.2.
Bearish Scenario:
If WIF fails to break above the local resistance, it could retest the support levels at $2.555 and $2.43. A break below $2.43 could signal further declines.
When to Buy WIF for Investment
Current Situation:
Given WIF's current price at $2.6 and the technical indicators suggesting potential overbought conditions, a cautious approach is warranted.
Optimal Buying Strategy:
Wait for a Pullback: Considering the Stochastic Oscillator indicating near overbought conditions, waiting for a pullback towards the local support level at $2.555 could offer a better entry point.
Solid Support Level: If the price drops further, the solid support at $2.43 is a strong level to consider for investment. Historically, WIF has found significant buying interest at this level, making it a safer entry point.
Gradual Accumulation: Alternatively, adopting a dollar-cost averaging (DCA) strategy by buying small amounts at regular intervals can mitigate the risk of market timing and take advantage of potential dips.
Conclusion and Market Outlook
WIF is currently positioned with significant support and resistance levels to watch. While technical indicators suggest potential overbought conditions in the short term, the bullish MACD and overall market activity suggest room for growth.
Impact of Bitcoin:
It's essential to note that Bitcoin (BTC) is currently at a crucial level. If BTC fails to surpass its all-time high and experiences a significant drop, it could negatively impact the broader cryptocurrency market, including WIF. Monitoring BTC's price action is vital for understanding potential risks to WIF's price movements.

Huge comeback for $MEW!Cat-themed coins are dominating the charts!
MEW is one of the top CAT meme coins, along with POPCAT . These coins have been showing strong performance.
With all this momentum, I believe we’ll see a new ATH for MEW soon.
Chart looks primed though we need .008 to hold (VAH)
If .008 breaks, the level I'm watching is .0077 to .0073 for potential long, targeting .0093 to .010 (short-term)

Dogwifhat (WIF)Dogwifhat is just another Dog-themed meme coin, this time with a hat; literally. Anyway, WIF got the traders' attention and thus trading volume went up, a lot. As a result, WIF's price went up too. Then, correction started, and it seems WIF is moving in a descending channel. Let's see when WIF breaks this channel.

Meme Coins: What’s Behind the Curtains ?Have you ever wondered how meme coins keep pumping? Are people really getting rich from them?
How the Pumps are Made ?
Step 1: Establishing Credibility
First, the creators spend significant investment capital to demonstrate good credibility. This ensures that the strongest platforms list them. During the Initial Public Offering (IPO), coins are sold massively to investors. However, as their is no more buyers, prices begin to decline.
Step 2: Accumulation Phase
Next, the coin enters an accumulation phase where big whales start buying from bored speculators at the lowest prices. The whales objective during this phase is to accumulate the maximum quantities for the lowest price possible. The long accumulation time will breakdown the enthusiasm of the speculators , selling their coins for a loss or no profits.
Step 3: Controlling Supply and Demand
When accumulation reaches its peak, the whales start withdrawing their coins from the platform, leaving the market with small quantities. They then inject a significant amount of capital, such as $1 million, causing the price to take off.
Step 4: Advertising
Following this, the coin creators and whales invest heavily in advertising , attracting a big community and more investors. This new crowd keeps injecting liquidity into the pumps, leading to noticeable price increases.
Getting Rich Quick?
Can you get rich quick from meme coins? The reality is nuanced. Even if speculators buy at the bottom, their investments are often too low, leading them to sell at modest gains during the pumps. On the other hand, people who buy after a 1000% increase are typically looking for substantial returns. However, their small capital makes even a 5x return seem insufficient.
The meme coin trend is aggressive and driven by a powerful crowd. While investing in these coins can bring profits, it’s essential to remember that you are always at the mercy of the whales. If they decide to sell off, the market can crash just as quickly as it pumped. Therefore, caution and awareness of the market dynamics are crucial when dealing with meme coins.

Dogwifhat WIF price looks like ... 👇Do you think the memecoin era has already passed or do they need to rest a little more before they can continue "show"?
The chart shows the global price movement of #WIFUSDT. Since the beginning of 2024, this asset has grown neither a little not a lot, just do +7000%)
Applying wave analysis to this coin, it seems to us that there need one more corrective wave down.
At $1.35, we might consider buying CRYPTOCAP:WIF , but at $3.30, we don't feel comfortable to buy.
Or are you saying that we are wrong and the price of #WIFUSDT will soon consolidate above $4.85 and head straight for $15 for #dogwifhat?)

WIFUSDT Double BottomWIFUSDT Technical analysis update
WIF price is breaking the double bottom neckline on the daily chart, and the price has broken above the 100 EMA. We can expect a strong bullish move in the coming days.
Buy zone : Below $2.45
Stop loss : $1.97
Take Profit 1: $2.85
Take Profit 2: $3.60
Take Profit 3: $4.85

Alikze »» DOGE |Descending channel movement scenario🔍 Technical analysis: Descending channel movement scenario
- According to the analysis presented in the 4H time frame in the previous post, it faced selling pressure after hitting the supply zone and failing to break it.
- The projected downward path is in accordance with the movement path after the break of the green box area, and touched the 0.12590 area and the second green box area.
- But currently, according to the correction structure, if the green box area is broken, the correction will continue.
- Therefore, as long as it is below the Fibo area of 1.618, the first target close to it can be the range of 0.097 and then the specified Fibo 100 range of 009214.
Considering that it is moving in a descending channel, the Fibo 100 zone can collide with the bottom of the descending channel.
💎 Alternative scenario: In addition, if it can stabilize the neckline or Fibo range of 1.618 towards the break and above it, it can be the first target of the ceiling of the descending channel and the range of 0.1464.
»»»«««»»»«««»»»«««
Please support this idea with a LIKE and COMMENT if you find it useful and Click "Follow" on our profile if you'd like these trade ideas delivered straight to your email in the future.
Thanks for your continued support.
Best Regards,❤️
Alikze.
»»»«««»»»«««»»»«««

#WIF/USDT#WIF
The price is moving within a bearish channel pattern on the 12-hour frame, which is a strong retracement pattern and was broken to the upside.
We have a bounce from a major support area in green at 1.50
We have a tendency to stabilize above the Moving Average 100
We have a downtrend on the RSI indicator that supports the rise and gives greater momentum, and the price is based on it to rise after it was broken upward.
Entry price is 1.90
The first goal is 2.32
Second goal 2.68
Third goal 3.10

Alikze »» 1000PEPE | Pull Back to the broken structure🔍 Technical analysis: Pull Back to the broken structure
- In the frame time frame, a five -wave cycle has completed the upward movement.
- It is currently moving in a mid -time uptrend.
- After several reactions to the major roof, it eventually faces pressure in the middle of the channel and is now on the uptreen floor.
- This short return can continue the correction after the money to the broken structure, by failing the channel to the origin of the Movement and the Buyer Zone.
💎 Alternative scenario: can test the fiber range of 2.618 and the middle of the channel if it can break the supply area.
»»»«««»»»«««»»»«««
Please support this idea with a LIKE and COMMENT if you find it useful and Click "Follow" on our profile if you'd like these trade ideas delivered straight to your email in the future.
Thanks for your continued support.
Best Regards,❤️
Alikze.
»»»«««»»»«««»»»«««
BINANCE:1000PEPEUSDT.P

WIF Breakout downtrend...Seems like WIF will fall by Elliot Symmetrical Wave pattern, on E can be another good buy moment but we can also already fall underneath. I expect WIF to go to atleast 1.20.
This is no financial advice, always DYOR.

$WIF Holding On For Dear LifeCRYPTOCAP:WIF down 65% in the past 100 days.
Holding onto the .236 Fib for dear life.
RSI and EMAs show more downward pressure ahead.
The descent started just 18 days after @blknoiz06 announced the Vegas Sphere Ad had been fully funded.
"Representatives from the Sphere had crafted new “crypto-specific” terms after hearing of the campaign, adding that there had been internal meetings to develop their crypto-related policies in response to the initiative.
There was a small chance the deal could still fall through, owing to doubts around requirements the WIF community or partnering companies could not agree to, but said so far, this “had not been the case.
If it was canceled, we would let you know immediately and all funds will be returned.”
~Mihir, one of the WIF organizers via @Cointelegraph

CAN SOL GO PARABOLIC? MartyBoots here. I have been trading for 17 years and I am here to share my ideas with you to help the Crypto space.
I posted about SOL crashing the market before it crashed when FTX collapsed , check back on my previous trading view videos
This is potentially forming the same pattern that crashed BTC back into COVID crash . So be on alert but if we can negate this pattern then SOL could go PARABOLIC

BITCOIN IS THE NEXT AMAZONMartyBoots here. I have been trading for 17 years and I am here to share my ideas with you to help the Crypto space. The Bull market is here
Even tho the bull market is here BTC has not fully mooned yet there is still time to buy on DIPS . The market has just hit a critical level . This is a bullish structure and dips are buys, when these dips happen BTC can start its move higher . This needs to be watched carefully.
BTC To The MOON
Please watch the video for more information

WIF Bearish- Bearish Price action
- We look for buys at the -0.62 FIB retracement.
- If it will be hit, a structure break to the upside is needed before we enter a long position.

Are Alts Ready For Entry? Meh...But DogWifHat Might Surprise!Traders,
I promised to do some analysis on alts. Altcoins are looking pretty bearish right now but some unexpected coins are looking especially interesting. It may surprise you which categories of alts could pump soon.
Stew

Alikze »» SHIB | Bullish Flag🔍 Technical analysis: Bullish flag in corrective zigzag wave 4
According to the analysis presented in the previous post, wave 3 or rising C in the area of 2.618 Fibo of the previous wave itself was completed.
💎 But now in the 1D time frame a bullish flag is formed in the form of wave 4 zigzag.
After exiting the congestion and descending channel in the supply range, it has faced selling pressure.
💎 Therefore, it can be offered after the pullback to the broken structure in the liquidity range by successfully collecting liquidity to break the zone.
💎 In addition, if the candle closes to the sub-zone in the daily time, the bullish scenario will be invalid and should be re-examined and updated.
»»»«««»»»«««»»»«««
Please support this idea with a LIKE and COMMENT if you find it useful and Click "Follow" on our profile if you'd like these trade ideas delivered straight to your email in the future.
Thanks for your continued support.
Best Regards,❤️
Alikze.
»»»«««»»»«««»»»«««

Alikze »» TURBO | 4H descending channel🔍 Technical analysis: Moving in the descending channel
- The daily frame time is moving in an upstream channel.
- But in the 4H frame time, there is a corrective form that is moving within a downtrend.
- This correction can first touch the range of 0.003052 if it is below the supply area and can extend this correction to the middle of the channel if continued.
💎 Alternative scenario: Also, if it can break the 0.0061 area, it could form an upward flag pattern that can continue the uptrend and continue its growth channel as much as the channel supply.
If the behavior and structure of the post will be updated, it will be updated.
»»»«««»»»«««»»»«««
Please support this idea with a LIKE and COMMENT if you find it useful and Click "Follow" on our profile if you'd like these trade ideas delivered straight to your email in the future.
Thanks for your continued support.
Best Regards,❤️
Alikze.
»»»«««»»»«««»»»«««
