Dogwifhat Poised For 22% Growth Toward $1.50Hello✌
Let’s analyze Dogwifhat’s upcoming price potential 📈.
📈 BINANCE:WIFUSDT is currently sitting near a strong daily support and trendline. At the same time, the Fibonacci Level support lines up closely with this key level. This convergence suggests a potential upside of about 22%, aiming for a target price of $1.50. 🔥
✨We put love into every post!
Your support inspires us 💛 Drop a comment we’d love to hear from you! Thanks , Mad Whale
WIFUSD

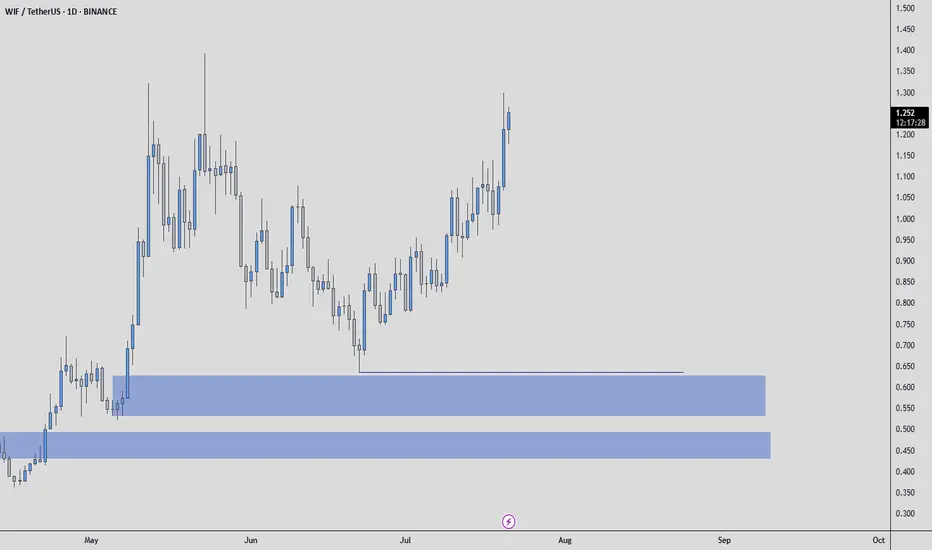
WIFUSDT: Mid-Term AnalysisI know the prices I want are very cheap.
But I believe this market can give me those prices if I’m patient.
Until then, I’m watching calmly. If price comes to my levels, I will look for:
✅ Footprint absorption
✅ CDV support
✅ Structure reclaim for confirmation
If it aligns, I’ll take the trade with clear risk. If not, I’ll keep waiting.
No rush. The right price, or no trade.
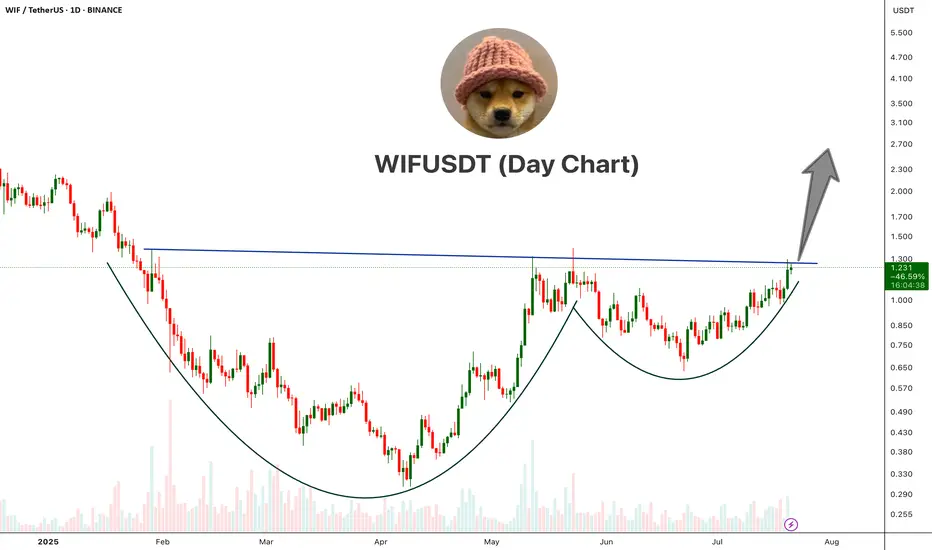
WIFUSDT Cup And Handle PatternWIF is showing a classic Cup and Handle pattern on the daily chart, a strong bullish reversal setup.
The price has broken above the neckline resistance around the $1.25–$1.30 area with bullish momentum. This breakout, if sustained with volume confirmation, could open the doors for a major upside move.
Cheers
Hexa
BINANCE:WIFUSDT
Price explosion is coming?Read carefullyhello friends👋
We have come to analyze a popular Kuwaiti meme that you have asked to analyze a lot.
🌟Well, according to the drop we had, it can be seen that the buyers came in and formed a good upward wave, and after that, Femt entered a channel, which can be said to be a flag pattern...🧐
Now, according to the formed channel, we can enter into a purchase transaction with capital and risk management in case of a valid failure of the channel.
🔥Follow us for more signals on Bolran.🔥
*Trade safely with us*

WIF/USDT – Major Breakout Incoming! Potential Upside Over +400%!Technical Analysis:
The WIF/USDT (dogwifhat / Tether) pair on the 1D timeframe is currently showing signs of a bullish breakout from a well-defined descending channel that has formed over the past few months.
📌 Key Highlights:
Price has been consolidating within a descending channel since March 2025.
It is now attempting to break out above the upper boundary of the channel – a strong bullish signal.
The breakout is forming after a strong bounce from the $0.70–$0.75 support zone, indicating accumulation and potential trend reversal.
📈 Resistance Levels (Target Zones):
1. $1.0251 – first key resistance to watch.
2. $1.2008 – minor resistance, ideal short-term target post-breakout.
3. $1.8468 – major historical resistance level.
4. $2.1772 – key psychological and technical level.
5. $2.9503 – extended bullish target.
6. $4.1525 – maximum bullish projection in case of parabolic move.
📉 Support Levels:
$0.8627 – current price level.
$0.70–$0.75 – previous strong support zone and lower channel base.
📊 Strategy Insight:
A potential entry could be considered on a confirmed breakout and retest around $1.02.
Targets can be scaled based on resistance levels mentioned above.
Use proper risk management and stop-loss below the channel to avoid fakeouts.
Conclusion:
WIF/USDT is showing a strong bullish reversal structure, breaking out from a mid-term descending pattern. This could be the beginning of a massive upward impulse, with over +400% potential gain if key targets are reached. A critical moment for traders and investors to pay attention!
#WIFUSDT #WIFBreakout #CryptoAnalysis #AltcoinSeason #Dogwifhat #BullishSetup #BreakoutAlert #CryptoTrading #CryptoSignals #WIFArmy

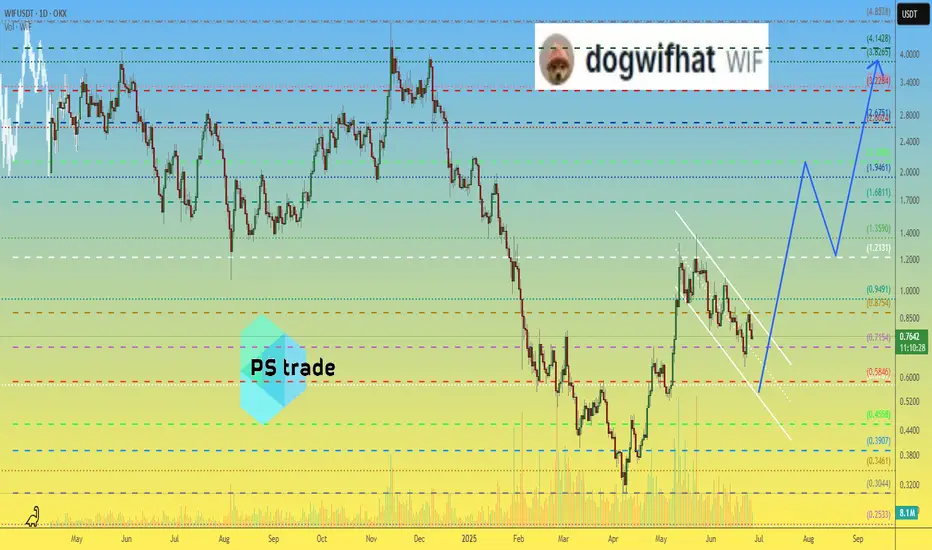
dogwifhat WIF price analysis🤪 "They" are trying to breathe "new life" into #WIF . And if they manage to keep the price of OKX:WIFUSDT above $0.55, this plan will have a chance of success.
So what do we have:
◆ #WIF holders need to keep their fingers crossed that everything will work out and there will soon be growth, and with it a chance to get out of a prolonged "draw fall"
◆ Traders need to wait for confirmation that the price of #WIFUSD is holding steady above $0,55.
And no large trading leverage, because this is a fairly volatile meme coin, even x5 leverage, which allows for a -19% error, or x3, which forgives a “miss” of -32% from the entry point, can liquidate your deposit when trading volatile assets.
⁉️ Do you believe that the price of #dogwifhat can still return to the $4 range with a corresponding project capitalization of $4 billion?
_____________________
Did you like our analysis? Leave a comment, like, and follow to get more
They brought it down for the fill — now it's time to see who’s rBINANCE:WIFUSDT just reacted perfectly off the 0.618 golden zone at 0.827 with bullish intent. The STB 1D and FVG 1D combo formed a high-probability demand zone that Smart Money won't ignore lightly.
Here’s the bullish roadmap:
Entry: 0.788 (bottom wick through 0.618 fib)
Structure: Clear higher low with mitigation of FVG 1D
Volume: Climax candle into key levels — classic absorption
Targets:
TP1: 0.921 (mid-level fib and consolidation ceiling)
TP2: 1.015 - 1.132 (FVG to OB 1D imbalance fill)
TP3: 1.321 (full expansion target — optimal trade entry delivery)
Moonshot: 1.393 if bulls dominate past OB retest
Invalidation: Daily close below 0.692 (STB 1D)
Price doesn’t just reverse — it transfers power. This is that shift.
For more plays just like this — all based in structure and timing — check the profile for setups that speak precision, not prediction.

I didn’t chase the high. I waited for the reclaim.WIF ran the 1.048 liquidity, reversed, and now it's offering the kind of structure I don’t second-guess. This isn’t about trend — this is about reclaiming control.
Here’s the map:
Price retraced cleanly into the BPR zone between 0.944 and 0.920 — right in the middle of the fib rebalancing zone
0.618 fib sits at 0.920, which makes this entire region a Smart Money entry block
Below that is the 1H OB at 0.840 — a worst-case sweep zone if liquidity gets run
Current structure suggests a tight range building beneath the previous high — a classic setup before a displacement move into 0.999 → 1.048
Hold above BPR and reclaim 0.969? That’s your greenlight.
Execution plan:
Entry: 0.944–0.920
TP1: 0.969
TP2: 1.048
Invalid below: 0.885 — or full re-entry from the 1H OB near 0.840
The move already happened. This is the retest. You either planned for it — or you're reacting late.
Precision like this lives in the profile. Setup-first. Noise-free.

This wasn’t a bounce. It was a reclaim.BINANCE:WIFUSDT.P hit the daily OB at 0.8330 and snapped back — not with hope, but with intent.
Smart Money didn’t panic on the drop. It positioned.
Here’s the structure:
Price tapped a clean D OB, aligned perfectly with 0.618 fib — the algorithm’s comfort zone
The bounce reclaimed 1.00 fast, and the market is now flirting with internal liquidity near 1.0178 and 1.1339
Above, the real draw sits at 1.3965 — a void yet to be filled
Below, we still have W OB liquidity near 0.7260 if this rotation fails
This move doesn’t need hype. It needs follow-through. If we consolidate above 0.9299 and break into 1.0178 clean, the next phase unlocks — straight into the 1.13–1.32 range.
Execution plan:
Bias remains bullish above 0.92
Pullbacks into 0.89–0.83 are still valid long zones as long as 0.7260 doesn’t get breached
Target 1.1339 first — then 1.3965 as the higher timeframe liquidity magnet
This setup isn’t emotional. It’s engineered. You don’t need to guess when price is built to deliver.
More trades like this — real levels, real invalidations — are in the profile description.

A 35% fall in WIF from its current price levels is possibleWIF has just broken below the 200 EMA on the H4 timeframe and reacted to an imbalance area.
From here, it’s possible for a pullback to form in an ABC pattern with low volume on the upward move, potentially testing the resistance zone where the 200 EMA may also act as resistance.
Looking at the BTC chart, there’s still room for further downside, which supports our thesis.
Using the RSI across the M15 and H1 timeframes to identify overbought areas with divergence could serve as the entry trigger.
Let’s see what this week brings!

#WIF/USDT#WIF
The price is moving within a descending channel on the 1-hour frame, adhering well to it, and is heading for a strong breakout and retest.
We are seeing a rebound from the lower boundary of the descending channel, which is support at 1.06.
We have a downtrend on the RSI indicator that is about to be broken and retested, supporting the upward trend.
We are looking for stability above the 100 Moving Average.
Entry price: 1.068
First target: 1.115
Second target: 1.157
Third target: 1.211

WIF NEXT In my opinion, this is the likely scenario.
* The purpose of my graphic drawings is purely educational.
* What i write here is not an investment advice. Please do your own research before investing in any asset.
* Never take my personal opinions as investment advice, you may lose your money.

WIFUSDT 1D Analysis WIF ~ 1D Analysis
#WIF Buy gradually after successfully breaking through this resistance line with a short-term target of at least 15%++

#WIF/USDT#WIF
The price is moving in a descending channel on the 1-hour frame and is adhering to it well and is heading to break it strongly upwards and retest it
We have a bounce from the lower limit of the descending channel, this support is at a price of 0.650
We have a downtrend on the RSI indicator that is about to break and retest, which supports the rise
We have a trend to stabilize above the moving average 100
Entry price 0.671
First target 0.716
Second target 0.751
Third target 0.800

WIFUSDT 1WWIF ~ 1W Analysis
#WIF Buy back from here with a short-term target of at least 15%+.
This is a very strong support level for now.

WIF/USDTHello friends
According to the market cycle, the price decline is ongoing and is expected to continue.
Now the only important support is the green area, which the price reaches there and we will see what reaction we get from the buyers.
Will they support the price or will the decline continue...
If you want to be with us in this alt season, send us a message.
*Trade safely with us*

WIF on the road to 6 usdWIF is breaking out of the range, next week we will see a green candle. MEME coins are on fire. Do not miss this one.
If you need more info, let me know.
NOT A FINANCIAL ADVICE
ALWAYS USE STOPLOSS AND MANAGE YOUR RISK

WIF ANALYSIS (2H)After pumping, changing CH, and clearing a supply zone, the price is now pulling back to lower order blocks.
In the lower zone, there is an overlap between the flip line and the QM level, which appears to be a strong area.
Additionally, the upper order blocks have been consumed, and if the price intends to continue its upward movement, there are no significant sell orders ahead.
Targets are marked on the chart.
A daily candle closing below the invalidation level will invalidate this analysis.
For risk management, please don't forget stop loss and capital management
Comment if you have any questions
Thank You

WIFUSDT 2DWIF ~ 2D Analysis
#WIF If this support block is tested, This will be a very good place of buy. with a minimum target of 20%+.

WIFUSDT: Is This the Last Stand Before a Breakout?A Critical Moment for WIFUSDT: Buyers or Sellers—Who Wins?
WIFUSDT is teetering at a pivotal point, currently priced at $0.9981, reflecting a staggering -79.56% deviation from its all-time high of $4.8848 just 81 days ago. Meanwhile, the asset remains a massive 486% above its absolute low recorded nearly a year ago, underscoring its extreme volatility.
Technical indicators are flashing mixed signals:
📉 RSI14 is hovering around 32.19, signaling that WIFUSDT is approaching oversold conditions, but not quite there yet.
📊 Moving Averages are still bearish, with MA50, MA100, and MA200 sitting well above the current price, reflecting lingering downside pressure.
However, the latest candle patterns suggest growing instability:
✅ Buyers attempted a takeover in the last session, driving prices from $0.9807 to $0.9981 with a high of $1.0194.
❌ Prior bearish volume dominance, where increased selling pressure pulled the price down from $0.9966 to $0.9807, remains a concern.
So, what’s next? Is WIFUSDT on the brink of reclaiming key resistance levels at $1.2916 and beyond, or will it succumb to seller dominance and revisit its lower support zones? Your move, traders.
WIFUSDT Roadmap: Tracking the Market's Next Big Move
VSA Manipulation Sell Pattern 3rd (Jan 31, 18:00 UTC)
Heavy sell-off triggered a sharp decline $1.2625 → $1.1371, with a low at $1.1082. A textbook VSA manipulation move, where weak hands were shaken out. The key question: will buyers step in at this level, or is more downside ahead?
Increased Buy Volumes (Jan 31, 19:00 UTC)
Buyers made an aggressive comeback, pushing the price $1.1371 → $1.1813. A solid confirmation of demand, but resistance at $1.1990 remains a critical barrier. Will this be a continuation or just a liquidity grab before another dump?
VSA Manipulation Buy Pattern 3rd (Feb 1, 10:00 UTC)
This was the true test of bullish strength. Price surged from $1.0916 → $1.1021, closing above the trigger point—a classic signal for an extended move. But will bulls hold their ground, or will sellers take over again?
Increased Sell Volumes (Feb 2, 03:00 UTC)
Trap alert! After a brief rally, sellers stepped back in, pushing the price down $0.9966 → $0.9807. Bears are showing dominance, but they failed to break below the key level of $0.9773.
Sell Volumes Takeover (Feb 2, 04:00 UTC)
This was the moment of truth—bears tried to push lower, but bulls fought back, sending the price $0.9807 → $0.9981. This reversal hints at potential upside, but confirmation is needed with a break above $1.0194.
Conclusion: The market has been heavily manipulated by both sides, but the last pattern suggests sellers are losing steam. If $1.0194 is broken, expect further upside momentum. However, a drop below $0.9773 could signal another bearish wave. Time to watch closely!
Technical & Price Action Analysis
When it comes to trading WIFUSDT, key levels are everything. If buyers can’t hold support, those same levels will flip into resistance—classic market behavior. Here’s the roadmap:
Resistance Levels:
$1.2916 – First real test for bulls, flipping this opens the door for momentum plays.
$1.3355 – A historical supply zone; break and hold above confirms bullish intent.
$1.5553 – Major liquidity level; failure here could mean distribution.
$1.8968 – If price gets here, it’s game on for breakout traders.
$2.0384 – Last known battleground before an aggressive trend shift.
Powerful Support Levels:
$1.4167 – Critical bounce zone; failure turns it into a major resistance.
$2.0848 – If this gets tested, expect big bids or a deep dive.
Powerful Resistance Levels:**
$0.8363 – The biggest wall for any dip buyers; reclaiming flips the script.
$0.35 – If price ever touches this, it’s bargain-bin shopping or full collapse mode.
Smart money watches these levels closely. If support holds, it’s a dip-buying opportunity. If not, those same levels will act as ceilings, trapping breakout traders. Play it right, and don’t get caught on the wrong side of the move.
Trading Strategies Based on Rays
Concept of Rays:
My analysis method is based on VSA Rays, constructed using Fibonacci principles. These dynamic levels define movement channels, allowing us to track price behavior at key zones. The price will either bounce or break through these rays, signaling a reversal or continuation, but only after confirming with volume dynamics and key patterns.
Instead of guessing exact price levels, we focus on probability zones where price interaction with rays gives us trading opportunities. The Moving Averages (MA50, MA100, MA200, MA233) serve as dynamic resistance/support, interacting with these rays and enhancing trade setups.
Optimistic Scenario (Bullish Playbook):
If price confirms interaction with a bullish VSA Ray, we enter long positions targeting the next resistance level. Each new level serves as a potential profit zone or a point of reevaluation.
Entry: Above $0.9981 (confirmed breakout from VSA Ray + bullish candle close)
Target 1: $1.2916 (first ray extension)
Target 2: $1.3355 (higher liquidity zone)
Target 3: $1.5553 (major supply area, strong resistance)
Invalidation: If price drops below $0.9773 and confirms with volume shift
Pessimistic Scenario (Bearish Playbook):
If price rejects from a bearish VSA Ray or fails to hold above dynamic support, shorting opportunities emerge with key downside targets.
Entry: Below $0.9807 (confirmed rejection + bearish volume surge)
Target 1: $0.8363 (first support level, possible bounce)
Target 2: $0.3500 (strong liquidity absorption zone)
Target 3: Below $0.1702 (if major breakdown occurs)
Invalidation: If price reclaims $1.0194 with strong bullish volume
Key Takeaways:
Trade only after confirmation of interaction with rays
Expect movement from one ray to the next—each level acts as a stepping stone
Use MAs for additional confluence—failure to break a moving average signals continuation
Volume always matters—no volume = no conviction, wait for a real move
The market is dynamic, but VSA Rays + Key Levels give us the edge to stay ahead. Watch for interaction and execute with precision.
Let’s Talk Trading—Drop Your Thoughts Below!
Got questions? Want to dive deeper into the setups? Drop a comment! I always check and reply, so let’s discuss the best trading opportunities together.
If this breakdown helped you, hit Boost and save this idea—watch how price respects these levels over time. Trading is all about understanding key reaction zones, and this analysis gives you the exact roadmap.
By the way, my custom VSA Ray indicator automatically maps all these levels and updates in real-time. It’s private, but if you want access—DM me and we’ll talk.
Need analysis for another asset? I can chart anything! Some breakdowns I share publicly, but if you want something private and exclusive—we can arrange that too. Just let me know in the comments what you need.
My rays work on all markets—crypto, forex, stocks—you name it. If you want a custom markup for your asset, just Boost this post and comment below, and I’ll do my best to make it happen.
Most importantly—follow me on TradingView to stay ahead of the market moves. Let’s trade smart, not blind! 🚀

WIF long term 300%+Now or never region for WIF around 0,9-1,3 usd. Very nice R:R. There is potential to see new ATH this year as volume is in place and smart money as well. Buy and hold.
THIS IS NOT A FINANCIAL ADVICE
MANAGE YOUR RISK AND ALWAYS USE STOPLOSS

WIFUSD targeting $3.00 on this Channel Down bottom signal.Dogwifhat (WIFUSD) has been trading within a Channel Down pattern on the 1W time-frame, which on the greater scale looks like a giant Bull Flag. Regardless of that, the price almost hit the pattern's bottom (Lower Low trend-line) and with the 1W RSI stabilizing like on the August 05 2024 Low, we should now see that start of its technical Bullish Leg.
The previous Bullish Leg reached marginally above the 0.786 Fibonacci retracement level, so our current Target is $3.000.
-------------------------------------------------------------------------------
** Please LIKE 👍, FOLLOW ✅, SHARE 🙌 and COMMENT ✍ if you enjoy this idea! Also share your ideas and charts in the comments section below! This is best way to keep it relevant, support us, keep the content here free and allow the idea to reach as many people as possible. **
-------------------------------------------------------------------------------
💸💸💸💸💸💸
👇 👇 👇 👇 👇 👇

$WIF - Long Trade IdeaSEED_WANDERIN_JIMZIP900:WIF | 1D
Previous low has been swept
Buying zone: 1.23 to 1.18
Stoploss: below 1.05
Targets:
tp1 - 1.40 to 1.50
tp2 - 1.76 to 1.92
tp3 - 2.36 to 2.50
