WIFUSDT

WIFUSDT to bounce from weekly support around 0.60#WIF #WIFUSD #WIFUSDT SEED_WANDERIN_JIMZIP900:WIF
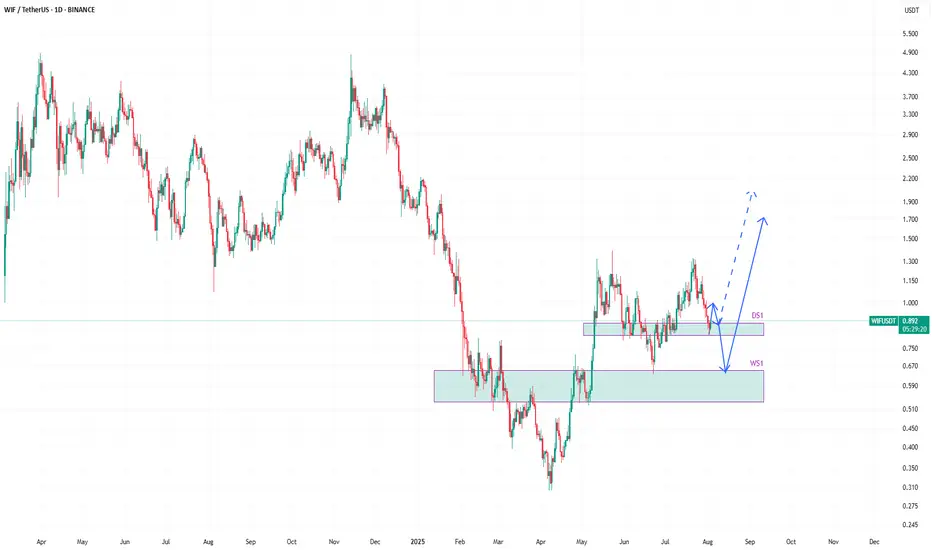
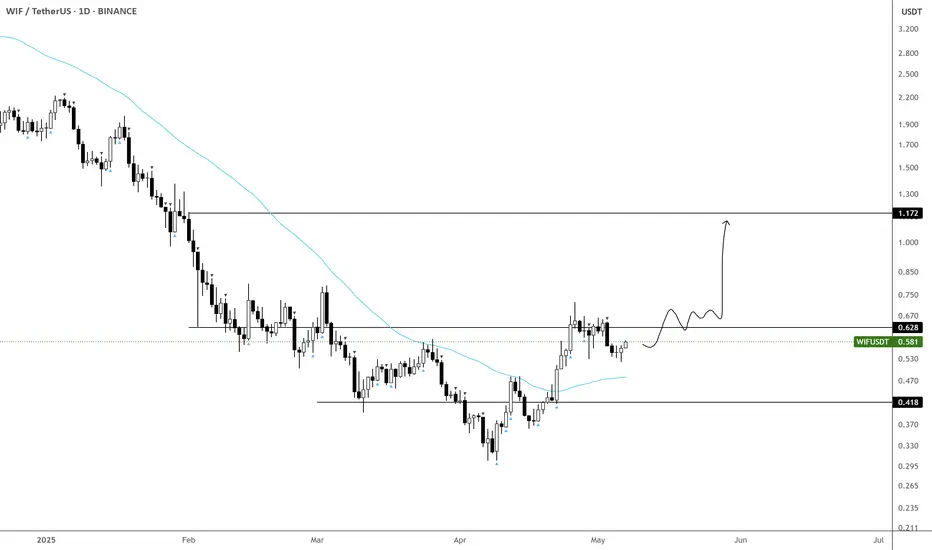
On WIFUSDT, I see two possibilities for the upcoming price action.
The price has tapped into daily support DS1 and it is currently bouncing from there.
The first path suggests that this is the start of the reversal and upward journey continuation. But I am not very inclined to that possibility.
The second path suggests that the price will go down further to weekly support zone WS1 after the current bounce from DS1 is exhausted.
I am more inclined on the second path. This will allow a bounce with enough strength to make the price move beyond the current highs. And that bounce from weekly support WS1 will be a real breakout and allowing the price to move beyond 1.5 and so on.
Dogwifhat Poised For 22% Growth Toward $1.50Hello✌
Let’s analyze Dogwifhat’s upcoming price potential 📈.
📈 BINANCE:WIFUSDT is currently sitting near a strong daily support and trendline. At the same time, the Fibonacci Level support lines up closely with this key level. This convergence suggests a potential upside of about 22%, aiming for a target price of $1.50. 🔥
✨We put love into every post!
Your support inspires us 💛 Drop a comment we’d love to hear from you! Thanks , Mad Whale

Memecoin with potential for purchase.Hello friends🙌
Considering the decline we had in the weekly timeframe, you can now see that with the good growth we had, it gives us a good signal to buy, of course in a stepwise manner and with capital and risk management.
🔥Follow us for more signals🔥
*Trade safely with us*

WIFFF your destiny!The patience is a game most fail, here you can get something which u cant expect!
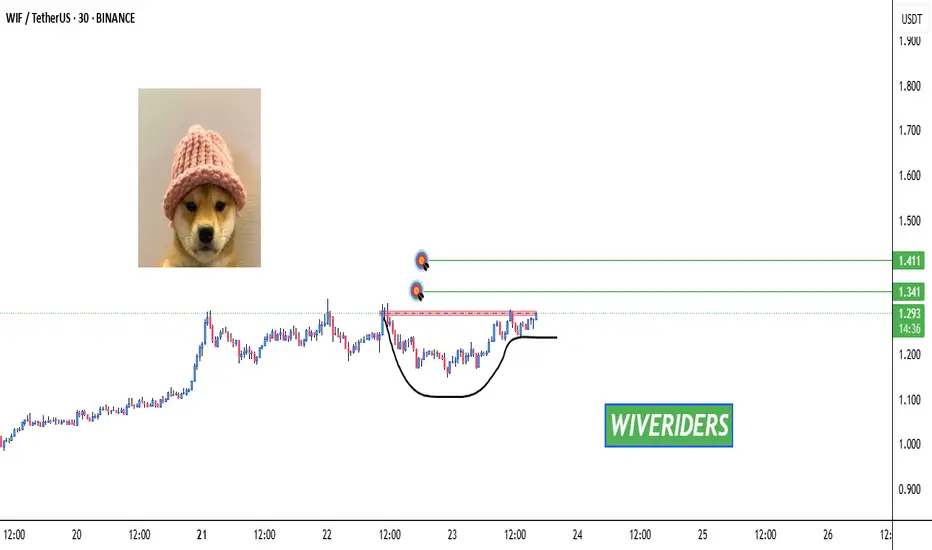
Bullish Cup & Handle Pattern Formed 🚨 SEED_WANDERIN_JIMZIP900:WIF Testing Red Resistance – Bullish Cup & Handle Pattern Formed 📈
SEED_WANDERIN_JIMZIP900:WIF is currently testing the red resistance zone and has formed a bullish cup and handle pattern on the chart.
If a breakout occurs, potential upside toward:
✅ First Target: Green line level
✅ Second Target: Green line level
Wait for breakout confirmation before entering long. 📊
Patience is key—watch this closely! 💼💸
WIFUSDT: Mid-Term AnalysisI know the prices I want are very cheap.
But I believe this market can give me those prices if I’m patient.
Until then, I’m watching calmly. If price comes to my levels, I will look for:
✅ Footprint absorption
✅ CDV support
✅ Structure reclaim for confirmation
If it aligns, I’ll take the trade with clear risk. If not, I’ll keep waiting.
No rush. The right price, or no trade.
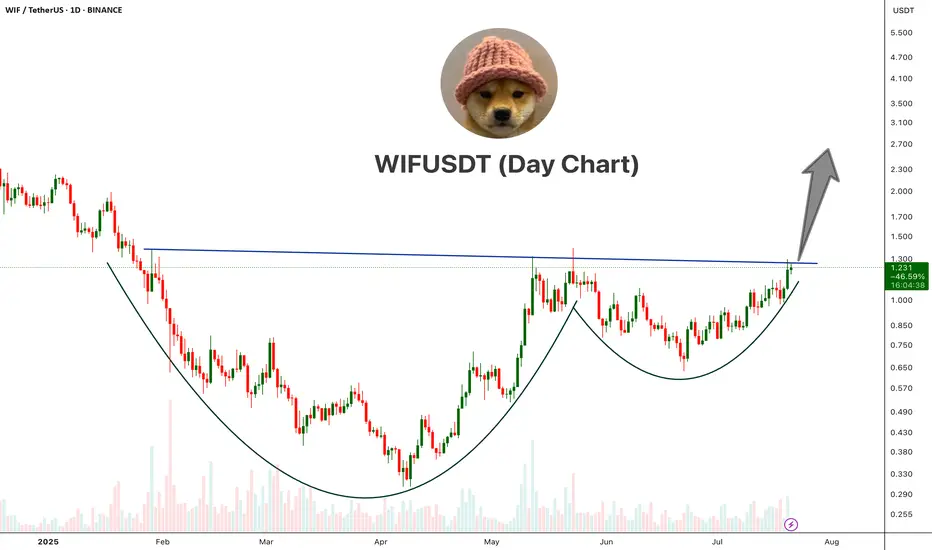
WIFUSDT Cup And Handle PatternWIF is showing a classic Cup and Handle pattern on the daily chart, a strong bullish reversal setup.
The price has broken above the neckline resistance around the $1.25–$1.30 area with bullish momentum. This breakout, if sustained with volume confirmation, could open the doors for a major upside move.
Cheers
Hexa
BINANCE:WIFUSDT
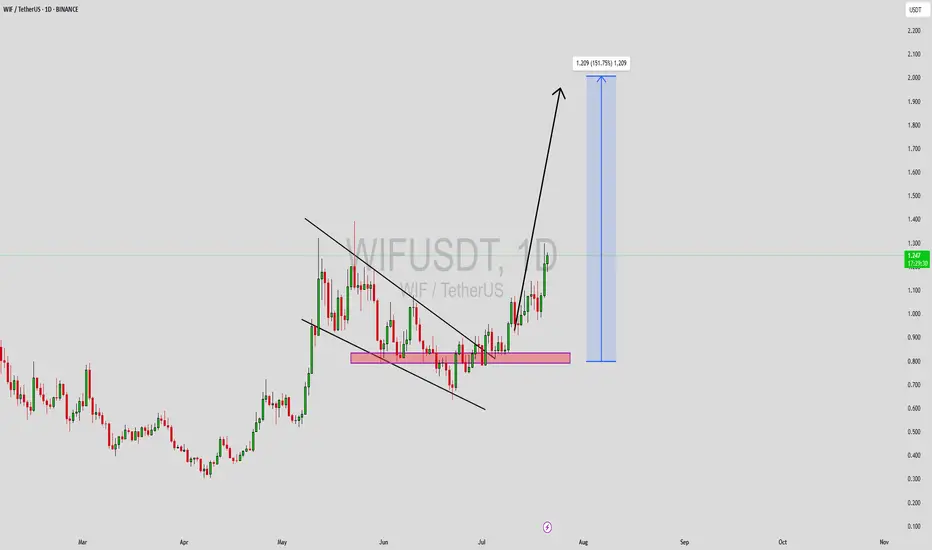
WIFUSDT Forming Descending ChannelWIFUSDT is currently trading within a descending channel pattern, a structure often considered bullish when found in a broader uptrend. This pattern indicates a period of healthy correction and consolidation, which often precedes a breakout move to the upside. With good trading volume and growing interest from the crypto community, WIF may be preparing for a strong reversal. The technical setup suggests a potential gain of 140% to 150%+ upon a confirmed breakout above the upper boundary of the channel.
Dogwifhat (WIF) has garnered significant attention due to its strong meme coin narrative within the Solana ecosystem. As meme tokens continue to attract retail attention, WIF has remained one of the more resilient and talked-about assets in its category. This strong community support, combined with current technical indicators, adds confidence to the bullish case.
The descending channel has allowed price to compress and reset RSI levels, setting the stage for a possible explosive move. If price breaks out with volume, this could mark the beginning of a new bullish wave. Traders should watch for a breakout candle with strong follow-through above recent resistance zones as a key confirmation point.
✅ Show your support by hitting the like button and
✅ Leaving a comment below! (What is You opinion about this Coin)
Your feedback and engagement keep me inspired to share more insightful market analysis with you!
$WIF just gearing for a new ATH! Not expecting much of a retrace on BINANCE:WIFUSDT — more likely we get consolidation against resistance.
This current level is crucial, and likely to form the base for either:
• A new ATH, or
• At minimum, a third retest of the $4.5–5 zone.
The broader market continues to push higher, and with Bitcoin Dominance breaking down, things could get very interesting in the coming months.
📌 Plan:
• Waiting on a clean retrace (as per second entry... previous post)
• Or a reclaim of the purple block to add to the position

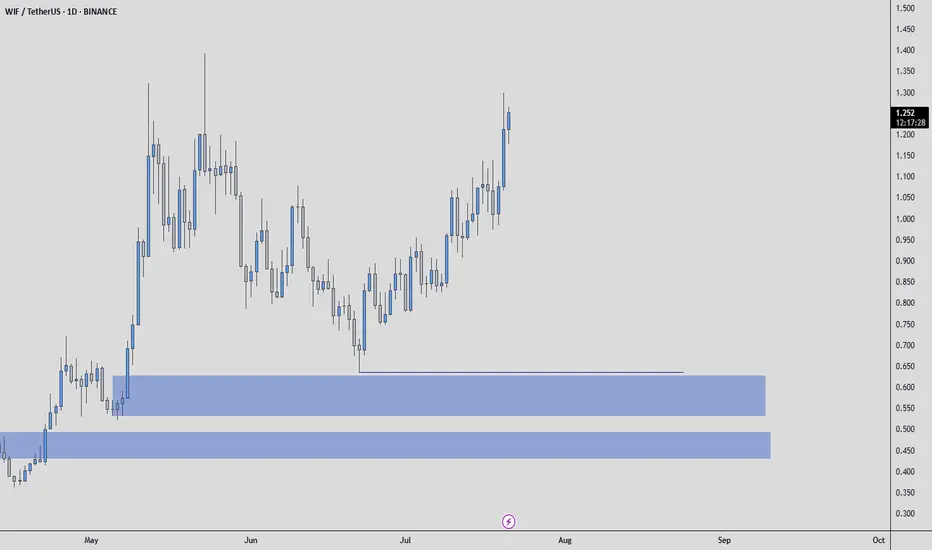
Time to Accumulate $WIF - $1.2 is NextWIF finally showing signs of life.
Starting to build a position below 60c—this looks like an optimal entry given how well it's behaving.
Accumulation zone remains between 40–50c, as long as price holds there.
Targeting the 1.2 area on a break and hold above 65c.
BINANCE:WIFUSDT SEED_WANDERIN_JIMZIP900:WIF
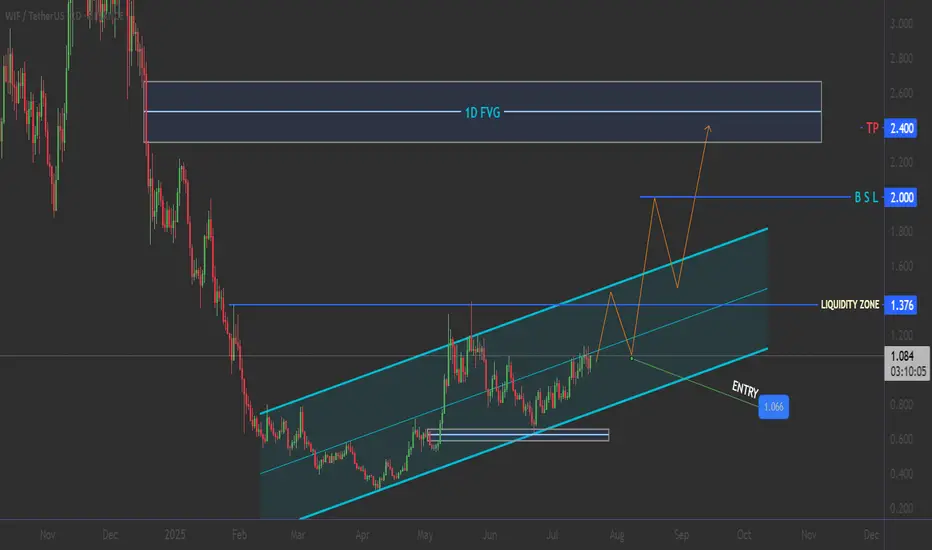
WIF: The Perfect Storm Setup - Ascending Triangle Breakout
📐 Perfect geometric pattern formation
📊 Volume profile supporting the setup
🎯 Clear target zones with minimal resistance
⚡ Compression leading to expansion
🎯 THE SETUP: Triple Confluence Strategy 🔥
📍 ENTRY ZONE: $1.00 - $1.06
🎯 TARGET 1: $2.000 (+85%)
🎯 TARGET 2: $2.400 (+120%)
🔴 STOP LOSS: $0.95 (-3%)
___________ NOTE ____________
🚨 RISK MANAGEMENT 🚨 DYOR
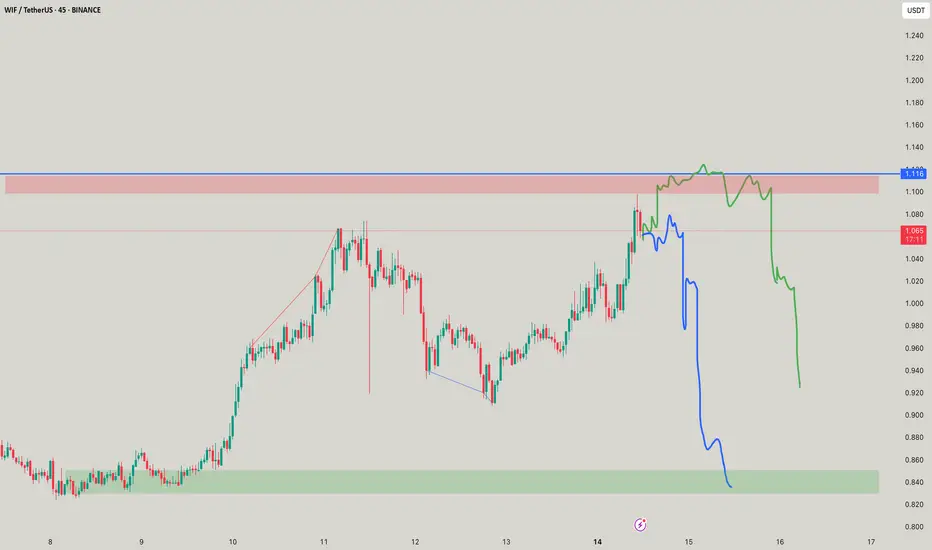
WIF WIF - SMOL SCALPSas showed stays in red box its happy, goes above its gone! Awesome super small scalps

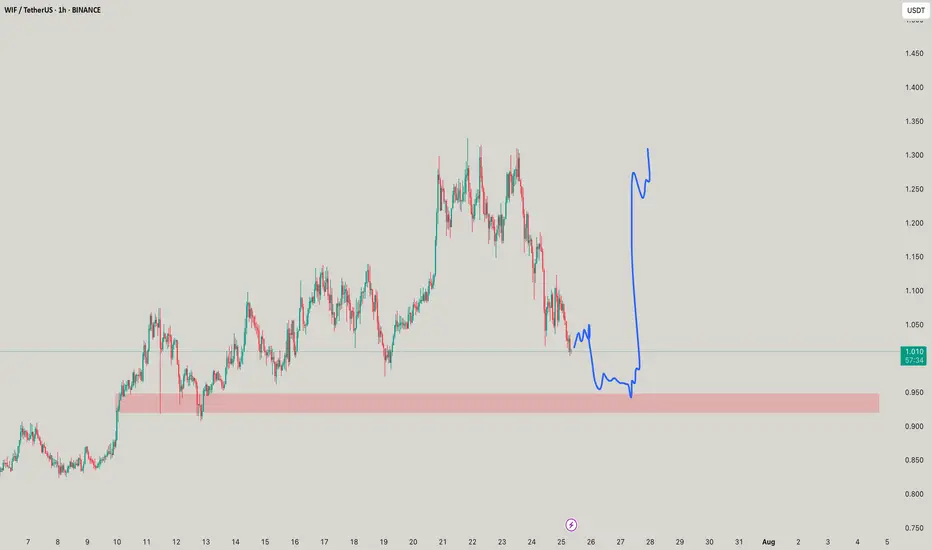
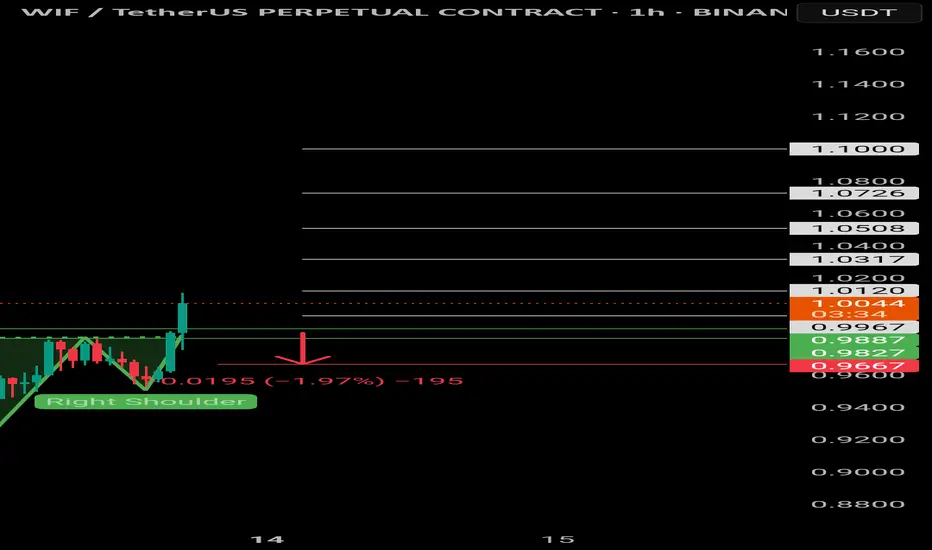
$WIF | Inverted head and shoulders $Wif/Usdt
BINANCE:WIFUSDT.P
The price is formed the Inverted head and shoulders pattern and did a breakout of the neckline, expecting the price to retest green lines (neckline).
If 1H CC hit and bounce above the green lines, it'll be a long opportunity.
Entering at current price will increase the SL, it's suggested to wait for a retest, to have better entry and a good risk management.
Use only 1-2% of your portfolio.
NFA, DYOR
TP:
Price explosion is coming?Read carefullyhello friends👋
We have come to analyze a popular Kuwaiti meme that you have asked to analyze a lot.
🌟Well, according to the drop we had, it can be seen that the buyers came in and formed a good upward wave, and after that, Femt entered a channel, which can be said to be a flag pattern...🧐
Now, according to the formed channel, we can enter into a purchase transaction with capital and risk management in case of a valid failure of the channel.
🔥Follow us for more signals on Bolran.🔥
*Trade safely with us*

WIF - One COIN TWO MOVES!SO the moves are for you to be seen, I am as usual saying half things so you come to me and ask whats it hahahha
MEW MEW - WIF is here!So yet again a very probable trade to the mark and you see something is better than nothing! The moves as said and marked!

WIFUSDT Forming Breakout Descending ChannelWIFUSDT is showing an exciting technical setup as it breaks free from a prolonged downward channel and consolidates near a strong support zone. This breakout pattern signals that the coin could be on the verge of a significant trend reversal, supported by healthy trading volume and renewed investor confidence. With buyers defending key levels and pushing the price above resistance, WIF is capturing the attention of traders looking for high-momentum plays.
Looking at the chart, WIFUSDT’s recent price action suggests that the base has formed well within the highlighted demand zone, providing a solid foundation for a sharp upward move. The breakout from the descending channel is a classic sign of trend change, and this technical shift is further reinforced by steady volume and bullish sentiment across social platforms. Traders should keep an eye on retests of the breakout zone for potential entry opportunities, as these could offer excellent risk-to-reward setups.
The potential gain of 140% to 150%+ makes WIFUSDT a top pick for those scanning the market for trending coins with breakout potential. The meme coin community remains highly active around WIF, and this fresh surge in interest could propel the coin to test its next major resistance levels in the coming weeks. As always, risk management and closely monitoring price action will be key to riding this bullish wave successfully.
✅ Show your support by hitting the like button and
✅ Leaving a comment below! (What is You opinion about this Coin)
Your feedback and engagement keep me inspired to share more insightful market analysis with you!


When the bark is louder than the bid - WIFWIF looks problematic, fall is there, but it would take shorters with them! so wait for that time!

Skeptic | Dogwifhat (WIF): Precision Triggers for Spot & FuturesWelcome, traders, Its Skeptic! 😎 Is Dogwifhat (WIF) the next meme coin rocket or a risky gamble? I’m diving into a pro-level breakdown of WIF, the Solana-based meme coin with a $882.06M market cap, ranked #75 globally. This analysis covers recent performance, ecosystem strengths, and technical triggers for spot and futures trading, grounded in cycle-based strategies. Trade with no FOMO, no hype, just reason. Let’s dissect WIF! 🚖
📰 Recent Performance & Key Events
Dogwifhat (WIF) , a Solana-based meme coin launched in late 2023, trades at 0.886 with a $882.06M market cap, ranking #75 globally. Featuring a Shiba Inu in a pink beanie, it leverages Solana’s high-speed, low-fee blockchain and a deflationary burn mechanism with a 998.9 million token supply. Listed on major exchanges like Binance, KuCoin, and Gate.io, WIF enjoys strong liquidity. In July 2025, it’s up 5.26% in 24 hours and 24.57% over 7 days, with a 24-hour trading volume of $450M. However, it’s down 80.94% from its all-time high of $4.84 (March 31, 2024), reflecting meme coin volatility :)
Technical & Market Position
WIF benefits from Solana’s scalable ecosystem, a hub for DeFi and NFTs, with 160,000+ TPS and low fees, outpacing slower networks. Its community-driven appeal, active on X, Reddit, and Discord, fuels its momentum, with posts highlighting a cult-like following. Compared to Pepe ($4.08B market cap, 456,000+ holders, 37% holding over a year), WIF’s smaller but vocal community shows dedication. However, its lack of real-world utility and reliance on social media hype mirror Pepe’s 25.7% year-to-date drop, raising concerns about sustainability.
Risks : Speculative volatility, pump-and-dump schemes, and dependence on Solana’s performance and social media sentiment make WIF a high-risk bet. Use stop loss to manage swings.
📈 Technical Analysis
Daily Timeframe
The Weekly (HWC) is bearish, entering a major bearish trend after forming a double bottom and breaking support. However, the Daily (MWC) started an uptrend, achieving 350 % growth before correcting to the 0.5 Fibonacci retracement —a healthy correction without breaking the uptrend momentum. Key support zones are $0.635–$0.679 . A break below could resume the Weekly bearish trend, so stay alert.
Spot Trigger (Long): Break above resistance at $ 1.047 , confirmed by a volume surge (ideally 2x the average of the prior 5–7 candles). Volume is critical—technical analysis is an art, not a science, so don’t fixate on exact numbers.
Key Insight: The Daily uptrend holds, but a volume spike is essential to confirm bullish moves and avoid fakeouts.
4-Hour Timeframe (Futures Triggers)
On the 4-hour chart (LWC), for longs:
Trigger: Break of the downward trendline and resistance at $ 0.958 , with volume confirmation (strong volume seen in the prior uptrend leg). Additional confirmation: RSI re-entering overbought.
Shorts: No short trigger currently. Despite the Weekly bearish HWC, the Daily MWC uptrend and strong support at $0.635–$0.679 make shorting illogical. Wait for a support break and MWC turning bearish for a safer short with better R/R.
Pro Tip: Longs are viable with volume and RSI confirmation. Avoid shorts until the MWC aligns bearish to minimize fakeout risk. Always use MAX 1%–2% risk per trade.
Final Vibe Check
This WIF breakdown delivers precise triggers for spot ($1.047) and futures ($0.958 long, no short yet), leveraging cycle-based strategies. With a bearish Weekly but bullish Daily, prioritize volume confirmation to navigate meme coin volatility. Solana’s ecosystem and exchange listings give WIF an edge, but its hype-driven nature demands caution. Want more cycle setups or another pair? Drop it in the comments! If this analysis sharpened your game, hit that boost—it fuels my mission! 😊 Stay disciplined, fam! ✌️
💬 Let’s Talk!
Which WIF trigger are you watching? Share your thoughts in the comments, and let’s crush it together!

WIF will now say Uff!WIF and FART had same patterns but just have got out of the phase on conjunction, little steep moves to the tops then it starts to mend down, observe for momentum and then take a play

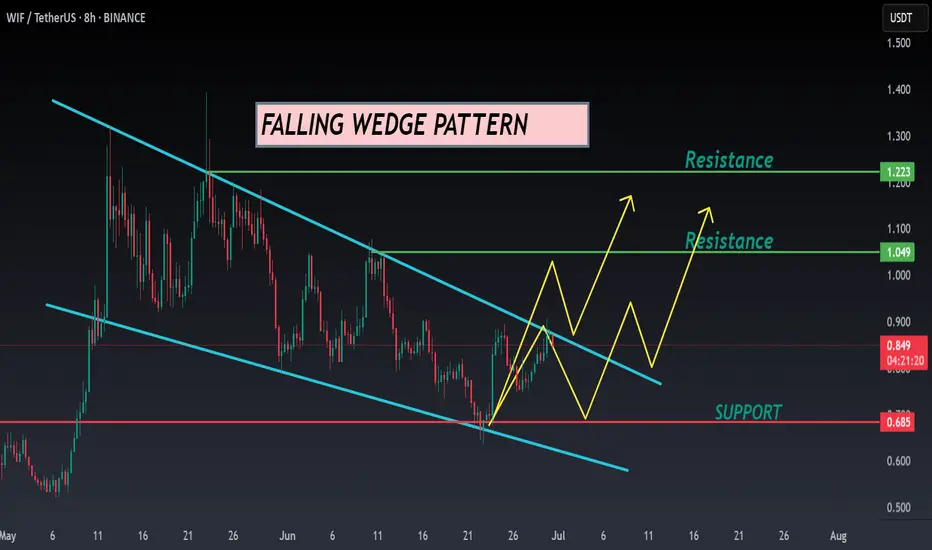
WIF ANALYSIS🔮 #WIF Analysis - Update 🚀🚀
💲 We can see that there is a formation of Falling Wedge Wedge Pattern in #WIF and we can see a bullish movement after a good breakout. Before that we would see a little retest and and then a bullish movement.
💸Current Price -- $0.848
📈Target Price -- $1.049
⁉️ What to do?
- We have marked crucial levels in the chart . We can trade according to the chart and make some profits. 🚀💸
#WIF #Cryptocurrency #Breakout #DYOR