WIFUSDT to bounce from weekly support around 0.60#WIF #WIFUSD #WIFUSDT SEED_WANDERIN_JIMZIP900:WIF
On WIFUSDT, I see two possibilities for the upcoming price action.
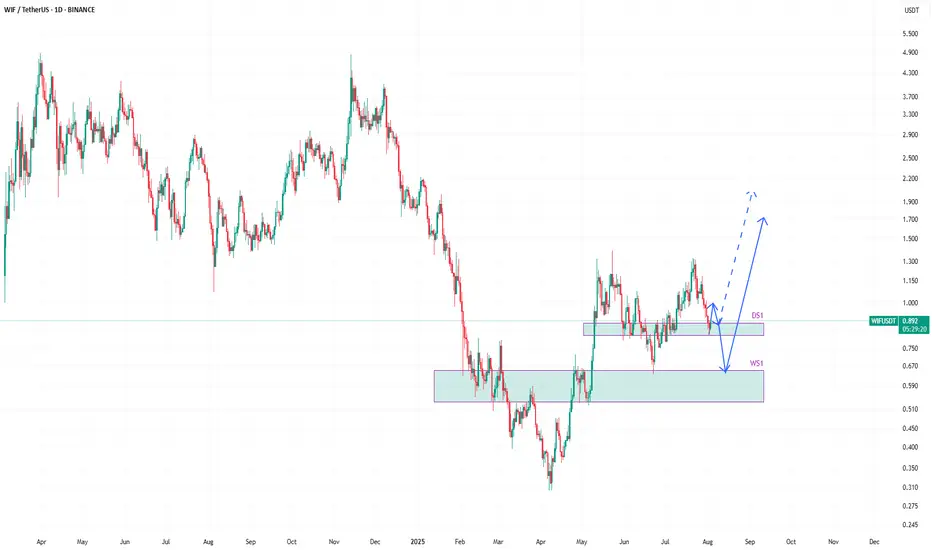
The price has tapped into daily support DS1 and it is currently bouncing from there.
The first path suggests that this is the start of the reversal and upward journey continuation. But I am not very inclined to that possibility.
The second path suggests that the price will go down further to weekly support zone WS1 after the current bounce from DS1 is exhausted.
I am more inclined on the second path. This will allow a bounce with enough strength to make the price move beyond the current highs. And that bounce from weekly support WS1 will be a real breakout and allowing the price to move beyond 1.5 and so on.
Wifusdtperp
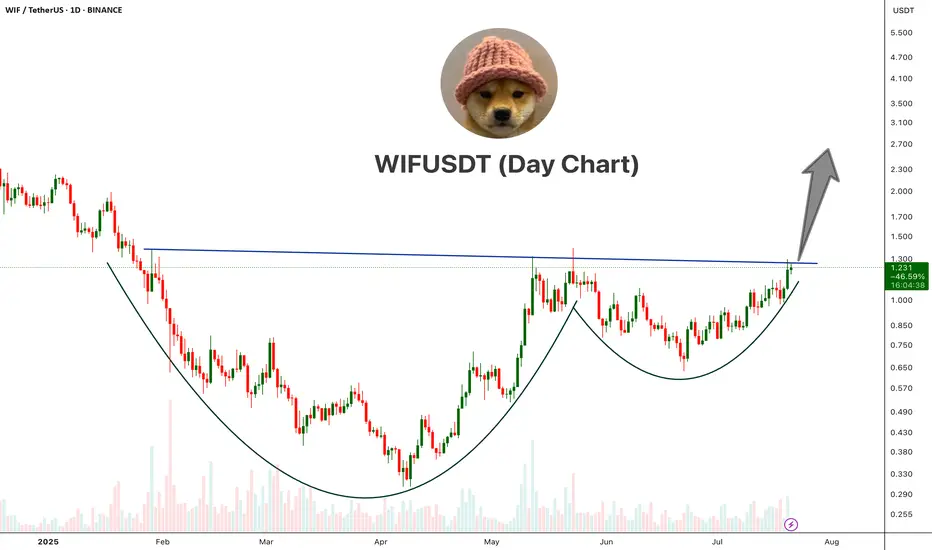
WIFUSDT Cup And Handle PatternWIF is showing a classic Cup and Handle pattern on the daily chart, a strong bullish reversal setup.
The price has broken above the neckline resistance around the $1.25–$1.30 area with bullish momentum. This breakout, if sustained with volume confirmation, could open the doors for a major upside move.
Cheers
Hexa
BINANCE:WIFUSDT
WIFUSDT Forming Breakout Descending ChannelWIFUSDT is showing an exciting technical setup as it breaks free from a prolonged downward channel and consolidates near a strong support zone. This breakout pattern signals that the coin could be on the verge of a significant trend reversal, supported by healthy trading volume and renewed investor confidence. With buyers defending key levels and pushing the price above resistance, WIF is capturing the attention of traders looking for high-momentum plays.
Looking at the chart, WIFUSDT’s recent price action suggests that the base has formed well within the highlighted demand zone, providing a solid foundation for a sharp upward move. The breakout from the descending channel is a classic sign of trend change, and this technical shift is further reinforced by steady volume and bullish sentiment across social platforms. Traders should keep an eye on retests of the breakout zone for potential entry opportunities, as these could offer excellent risk-to-reward setups.
The potential gain of 140% to 150%+ makes WIFUSDT a top pick for those scanning the market for trending coins with breakout potential. The meme coin community remains highly active around WIF, and this fresh surge in interest could propel the coin to test its next major resistance levels in the coming weeks. As always, risk management and closely monitoring price action will be key to riding this bullish wave successfully.
✅ Show your support by hitting the like button and
✅ Leaving a comment below! (What is You opinion about this Coin)
Your feedback and engagement keep me inspired to share more insightful market analysis with you!

WIF/USDT – Major Breakout Incoming! Potential Upside Over +400%!Technical Analysis:
The WIF/USDT (dogwifhat / Tether) pair on the 1D timeframe is currently showing signs of a bullish breakout from a well-defined descending channel that has formed over the past few months.
📌 Key Highlights:
Price has been consolidating within a descending channel since March 2025.
It is now attempting to break out above the upper boundary of the channel – a strong bullish signal.
The breakout is forming after a strong bounce from the $0.70–$0.75 support zone, indicating accumulation and potential trend reversal.
📈 Resistance Levels (Target Zones):
1. $1.0251 – first key resistance to watch.
2. $1.2008 – minor resistance, ideal short-term target post-breakout.
3. $1.8468 – major historical resistance level.
4. $2.1772 – key psychological and technical level.
5. $2.9503 – extended bullish target.
6. $4.1525 – maximum bullish projection in case of parabolic move.
📉 Support Levels:
$0.8627 – current price level.
$0.70–$0.75 – previous strong support zone and lower channel base.
📊 Strategy Insight:
A potential entry could be considered on a confirmed breakout and retest around $1.02.
Targets can be scaled based on resistance levels mentioned above.
Use proper risk management and stop-loss below the channel to avoid fakeouts.
Conclusion:
WIF/USDT is showing a strong bullish reversal structure, breaking out from a mid-term descending pattern. This could be the beginning of a massive upward impulse, with over +400% potential gain if key targets are reached. A critical moment for traders and investors to pay attention!
#WIFUSDT #WIFBreakout #CryptoAnalysis #AltcoinSeason #Dogwifhat #BullishSetup #BreakoutAlert #CryptoTrading #CryptoSignals #WIFArmy

#WIF/USDT#WIF
The price is moving within a descending channel on the 1-hour frame, adhering well to it, and is heading for a strong breakout and retest.
We are seeing a rebound from the lower boundary of the descending channel, which is support at 1.06.
We have a downtrend on the RSI indicator that is about to be broken and retested, supporting the upward trend.
We are looking for stability above the 100 Moving Average.
Entry price: 1.068
First target: 1.115
Second target: 1.157
Third target: 1.211

WIFUSDT 1D Analysis WIF ~ 1D Analysis
#WIF Buy gradually after successfully breaking through this resistance line with a short-term target of at least 15%++

#WIF/USDT#WIF
The price is moving in a descending channel on the 1-hour frame and is adhering to it well and is heading to break it strongly upwards and retest it
We have a bounce from the lower limit of the descending channel, this support is at a price of 0.650
We have a downtrend on the RSI indicator that is about to break and retest, which supports the rise
We have a trend to stabilize above the moving average 100
Entry price 0.671
First target 0.716
Second target 0.751
Third target 0.800

WIF Bulls Charge After Breakout – Can It Hit $2?SEED_WANDERIN_JIMZIP900:WIF has broken above the descending trendline, a key structure that had been capping price for several weeks. This breakout, paired with today’s nearly +10% surge, suggests bullish momentum is building.
The price is now approaching the 50 EMA, which may act as short-term resistance. A clean breakout and close above this level could trigger a strong upside move toward higher zones, as marked on the chart.
Targets remain open toward $0.80, $1.30, and possibly $1.97 if momentum holds.
DYOR, NFA

WIFUSDT 1WWIF ~ 1W Analysis
#WIF Buy back from here with a short-term target of at least 15%+.
This is a very strong support level for now.

WIFUSDT 2DWIF ~ 2D Analysis
#WIF If this support block is tested, This will be a very good place of buy. with a minimum target of 20%+.

WIF long term 300%+Now or never region for WIF around 0,9-1,3 usd. Very nice R:R. There is potential to see new ATH this year as volume is in place and smart money as well. Buy and hold.
THIS IS NOT A FINANCIAL ADVICE
MANAGE YOUR RISK AND ALWAYS USE STOPLOSS

WIFUSDT 2DWIF ~ 2D
#WIF So far it continues to maintain this support block. It looks like this support block is a very good Accumulation zone for now. with a minimum target of 20%+

WIFUSDT New ATH Soon!WIFUSDT Technical analysis update
BINANCE:WIFUSDT is moving towards its previous ATH level, which is expected to act as major resistance. High trading volume has been observed near this resistance over the past few days. The price has been confined within a range for the last 250 days, and after this ranging period, it is now approaching the resistance level. If a breakout occurs, a significant bullish move can be anticipated.

WIFUSDT: Brace Yourself for a Wild Ride!BINANCE:WIFUSDT.P has shown some serious bounce-back power, climbing up and breaking through important resistance levels. After a healthy correction back to the previous resistance, it’s now ready for another possible upward move. With the current meme coin craze driving up prices everywhere, BINANCE:WIFUSDT could follow a similar path and catch some bullish momentum. But remember, as always, be cautious and only invest a small part of your capital to manage risk effectively. Let’s see if BINANCE:WIFUSDT can ride the wave of the meme coin rally!
BINANCE:WIFUSDT Currently trading at $3
Buy level: Above $2.9
Stop loss: Below $2.4
TP1: $3.5
TP2: $4
TP3: $4.8
TP4: $6
Max Leverage 3x
Always keep Stop loss
Follow Our Tradingview Account for More Technical Analysis Updates, | Like, Share and Comment Your thoughts

#WIFUSDT Lucrative Futures Trade Setup!WIFUSDT Lucrative Trade Setup!
- Entry: $2.50 to $2.73
- Stop Loss: $2.18
- Targets:
- $2.95
- $3.15
- $3.44
- $3.78
- $3.92
- $4.03
- Leverage: Adjust based on your risk appetite; 3x leverage is recommended.
DYOR, NFA
If you want me to post more setups, follow me and please hit that like button.
Thank you
#PEACE

$WIFUSDT Set for Takeoff - Memecoin Momentum Building!BINANCE:WIFUSDT has taken a small correction after hitting resistance, but it’s now poised for an upward move. As a memecoin on the Solana blockchain, BINANCE:WIFUSDT is positioned well to capitalize on the current trend in the memecoin market. With growing interest and momentum, we can expect a boost in price soon. Keep an eye on this one for potential gains!
BINANCE:WIFUSDT Currently trading at $2.6
Buy level: Above $2.45
Stop loss: Below $1.95
TP1: $2.9
TP2: $3.5
TP3: $4
TP4: $5.5
Max Leverage 3x
Follow Our Tradingview Account for More Technical Analysis Updates, | Like, Share and Comment Your thoughts

$WIF Breakout Alert: Targeting 89% Gains!CRYPTOCAP:WIF is breaking out from a symmetrical triangle pattern on the 4H chart, which often indicates a potential continuation move.
📈 Entry Point: $1.55 - $1.60
🎯 Targets: $2.20, $2.60, $3.00
❗ Potential Gain: 90% to the upside.
🔄 Trading Strategy: Watch for a sustained breakout above the resistance line. A stop-loss of around $1.330 could be considered to limit downside risk.
📢 DYOR, NFA
#Crypto

WIFUSDT.P - LONGHuge amount of sell stops resting above am expecting to take these out first before heading our way down as am long on btc as well. lets see what happens here

WIFUSDT Double BottomWIFUSDT Technical analysis update
WIF price is breaking the double bottom neckline on the daily chart, and the price has broken above the 100 EMA. We can expect a strong bullish move in the coming days.
Buy zone : Below $2.45
Stop loss : $1.97
Take Profit 1: $2.85
Take Profit 2: $3.60
Take Profit 3: $4.85

#WIF/USDT#WIF
The price is moving within a bearish channel pattern on the 12-hour frame, which is a strong retracement pattern and was broken to the upside.
We have a bounce from a major support area in green at 1.50
We have a tendency to stabilize above the Moving Average 100
We have a downtrend on the RSI indicator that supports the rise and gives greater momentum, and the price is based on it to rise after it was broken upward.
Entry price is 1.90
The first goal is 2.32
Second goal 2.68
Third goal 3.10
