Daily AUD CAD fractal bounce trade. After price hit a resistance and it formed a fractal then it came back down bouncing off on the fractal zone giving us another chance to enter the market. We boxed the price in waiting for outside trading so we got in after indecision candle. First target we are shooting for is 1.03238 but we might get a bit ranging (Kijun is getting flat). On top of that there is volatility in the cloud.
Williams Fractal
11/16 TWTR Potential Long SetupIt's Wildcard Wednesday and TWTR is showing a potential turn for a low-risk, long entry either on the underlying stock or a set of call options with a .65 Delta or higher and 2 months until expiration. It has already tested the previous up fractal, but with a no-go on closing above. Once a market close occurs above that level, we'll look to submit a buy order. Otherwise, we're prepared for a smaller turn to the downside or a range.
Again, we need a market close above the $19.35 mark, with our trailing stop starting ~7% and closing. Happy Wednesdays everyone!
NZDUSD: Daily possibly Ending CorrectionNZDUSD has been in correction on the weekly since August 2015 after a major downtrend unfolded until then. This correction did not run up, instead it moved sideways with the Momentum indicator crossing above 0 on the weekly (indicating a major correction.) The daily chart didn't prove to trade well while this correction has been going on, many breakouts fail in this market phase and the trend trader needs to stay away until the next possible breakout tirggering a new trend shows up.
This could be the case now, after we saw prices trying to breakout of the upper resistance of this weekly sidemove and failed two weeks ago, we saw increasing weakness coming into this market with a new fractal sell signal forming. If price hits the low of that fractal a short position would be triggered and new lows could be possibly. Let's see if that is the one already...
SPX500 4h: Divergence Indicating WeaknessThe SPX500 has been rising ever since the worst start of the year in history. This bullish movement could come to an end now as we don't only see a divergence and prices starting to trade inside of the balance zone on the daily chart.
This four hour chart shows price already tried to break through a fractal and is now sitting just on top of what looks like pretty strong support. As this market keeps trading below the balance zone an eventual break of support is possible, which would end the daily uptrend for now.
AUDCAD possibly about to break out to UpsideAfter a short breakout has failed on the higher timeframes in Sep 2015, an immediate reversal occured and this FX pair went all the way from 0,92 to 1,02. Ever since it hit that high it retraced, but never went as low as the previous low in Sep 2015. A possible trend continuation could follow if the indicated fractal buy signal is hit. It would mean the break of important resistance and therefore following the move further to the upside is a possiblity.
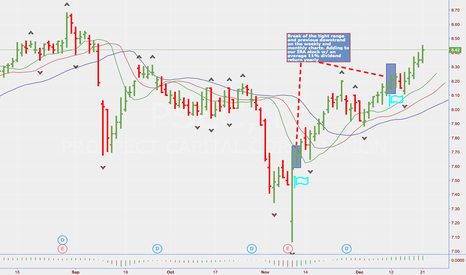
How I Trend Trade Using Fractals and Moving AveragesUP Fractal = Resistance, buy on breakout
DOWN Fractal = Support, sell on breakout
If Trend gets going, hold on to position until price closes above/below purple line.
Watch for divergences in Momentum indicator vs. price.
Watch for major and minor corrections that could indicate a new entry point or a slowing price.
After a trend is done, prices will always retrace back into the balance zone, marked by the three colored moving averages. As long as it is trading inside of it, stay out of the market.
Once a fractal up or down gets hit after price was breathing in the balance zone, put in a pending order and wait for whatever the market tells you.
Repeat.
Repeat.
Repeat.
Short ETH/BTC due to failed breakoutWe couldn't break 300 and the reason is clear. Volume is low af.
If that was leg one of a new wave it was hella weak. Where are all the buyers at? Waiting or shorting.
The Eye of Sauron looks down upon us and forces us into the nether worlds of the 200 zone. When we reach that level buyers will rush like mad at those prices. then we get exhausted, but people saw what happened on the first leg and they want in on the party and so we get another drive, etc, etc. It's quite simple. But there are rules to these streets. One cannot simply call an irregular elliott wave retracement a new rally when it is no such thing at all.
Two possible bullish scenariosBitcoin's free fall below the 600 area has been pretty intense, but the selloff's reaching exhaustion.
We're trading inside a channel, with clearly defined areas of brief consolidation over time, which act as support and resistance levels.
I'm fairly confident that if Bitcoin manages to climb over 550-580 it can hit 754 by the end of the month.


