WMT
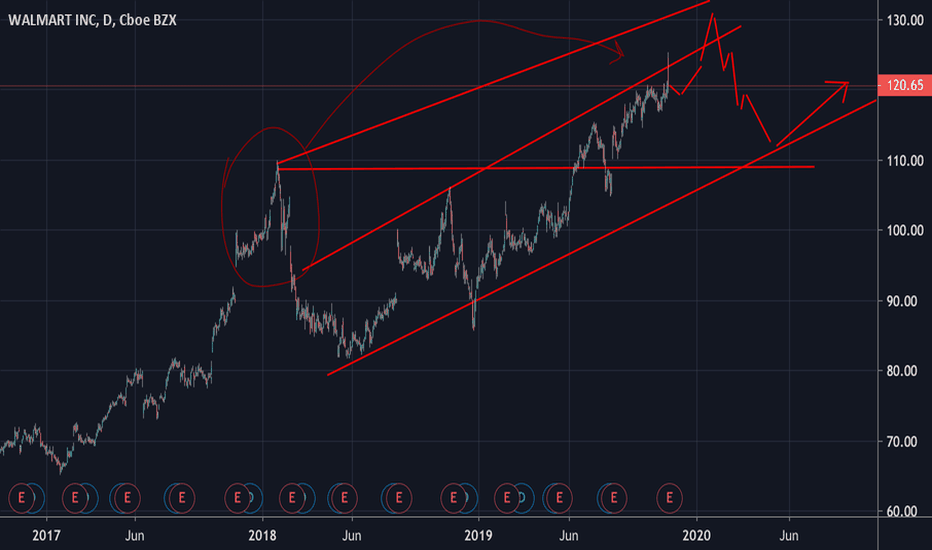
WALMART (WMT): Expecting Bearish Impulse
Walmart has recently reached a resistance line of a rising channel on a daily.
on 4H the market has formed a head and shoulders and broken below the neckline.
I believe that now we can expect bearish continuation.
initial target level is 110.0
second target is 104.0
WMT Walmart Distribution Sell SignalWalmart is a strong stock that has painted fresh ATH's in the past couple weeks. However, this recent price action has shown considerable weakness: lowered volume, bearish RSI divergences, and an inability to strongly breakout much higher. It seems to be sputtering and in danger of turning over in a rounded top fashion. Candlesticks and wicks on the daily, weekly, and monthly bars look like we're at a top.
WMT Nasdaq running on steam while fusion is available WMT has been on a parabolic bull run, yet no trend can be observed it seems to be ‘running on steam’ This is supported by the CVI, with less money flowing into the nasdaq composite, hence momentum decreasing. OBV shorts and longs both increasing and volume RSI seemly absent for the past 46 years. The fusion I talk about comes in the form of digital currencies and their ability to alter the industry. Gold can be seen to be steadily increasing which is historically strong within a recession.
Attention shopper ..WMT it does about go on heavy , everyone knows this is a pig , but pigs can fly .. (never seen one personally ) , easy daily #trade for a couple hundreds + daily added up quickly for a weekly budget minded trader just sit there and check current balance in the bank .. (have shares long)
Looking Exhausted, Step off the Bike and Cool DownPeloton has miraculously revitalized the Trend of In-Home Aerobics crap
You all remember the 80s-90s when Mom and Dad spent a fortune on crap they only used for a year or less?
Yep we are seeing it again, This time its with the Credit Card everything generations.
Very big bubble, could inflate much higher - like Pot Stocks or Impossible Meat
Walmart detailed chart for a friend 2hr & daily channelAfter checking out some potential price levels on the short term over the next few months we can see that wal-mart has broke into a wave 2 trend continuation uptrend holding inside the bullish channel zone.
106.70 shows strong bullish reversal momentum with an impulse telling us "up is still in effect" and instantly took us above the 50% channel dashed line.
A common bearish harmonic crab pattern was displaced giving us this consolidation 3 drive accumulation concept. We do not have a complete 2 and 3 drive yet so this is a "speculative guess." We could make a 1hr INV head n shoulder or dble bottom support at 119.30 / 118.50 zone instead and continue to a new high touching the top of blue zoned range in our trending channel. This zone is a signal zone for seller pressure inside this channel.
***** It does not mean it will be a sell; it means it can be a potential sell opportunity since this would be the end of wave 2 of the trend breakout. In turn, this would create a new daily high zone and new daily low pattern******
Take notice that the 106.70 impulse was also a bearish harmonic crab and we got around a 50% pullback flag to 110.45 from 114.42
I see this same concept happening here with a 50% - 78% pullback to 117.80 - 117.24 price zone for a trend continuation up to 122.70 - 123.00 seller pressure zone.
Quarters theory will try to push us to 125 if we break 120.50 and hold 120.00 support giving us micro trend pullback opportunities until then.
Overall.....
Buyers sit around 117.85 - 118.10
Sellers are weak and currently sit at 120.50. More pressure for a corrective ABCD move to the bottom of the range will begin the closer we get to 125.00 and most def. if we touch 130 - 131
Momentum plays a role here. This is why timing plays a role but cannot have an absolute calculation to a date and price. This is why it is important to always have an alarm signal set at price zones when you can confirm a solid trading channel that is printed for us as traders.
Any bullish impulse can take us up to the top of the grey range. This is our expanding flat top zone consolidation area. I have highlighted it with a trajectory tool red to green fade.
I expect to see a distribution and re-supply pinch/ or expanding pattern somewhere around 123-125.
WMT is bullish until we lose hourly momentum and fall below the 50% degree of this channel.
Patterns only help us represent possibilities not guarantees. The most important thing about patterns is that it helps show us STRUCTURE and what is happening in the market during large and smaller time scales. Learn the patterns and learn how they work in the structure of the charts.
ABCD
12345
all these patterns numbers harmonics etc etc are just geometric guidelines for us to see where the market finds best to go up and go down based of historical measurement and current market influence (which ranges from a lot of things...)
As I always like to say...history doesn't repeat itself but it sure does rhyme! Use the melody into your favor.
As always traders. Manage risk. Thank you for following. Please comment and like for support!
Peace. Love. Trade
EQUITY UWT & WMT SEP19 WK4 Wkly. (Expires. Sep 27th)EQUITY UWT & WMT
SEP19 WK4 Wkly. (Expires. Sep 27th)
Become a Member & find more ideas
signalclub.io/signals
For Expired Signals
signalclub.io/expiredsignals
www.signalclub.io
Cara, the Cannabis Pharma Sector leaderLight weight company with a strong cannabis product niche. Technical bullflag setup, needs macro bull trend to hold up, and then a company specific catalyst to breakout for new ATHs


