Get High Returns: Long PsycheMedicscompany with a few decades of history, niche product/ market, remains fairly innovative
debt vs. cash +cash flow is net positive. low share count float
Buyout Target
WMT

TGT shorts could pay offTarget had big earnings boost with big gap up play. RSI getting way over extended, and its pulled away from the EMA's a good deal. I like this as a short position as well. Also looking for entry confirmation off 30m chart for a short swing as well as walmart. Keep on eye on what SPY is doing for these two.

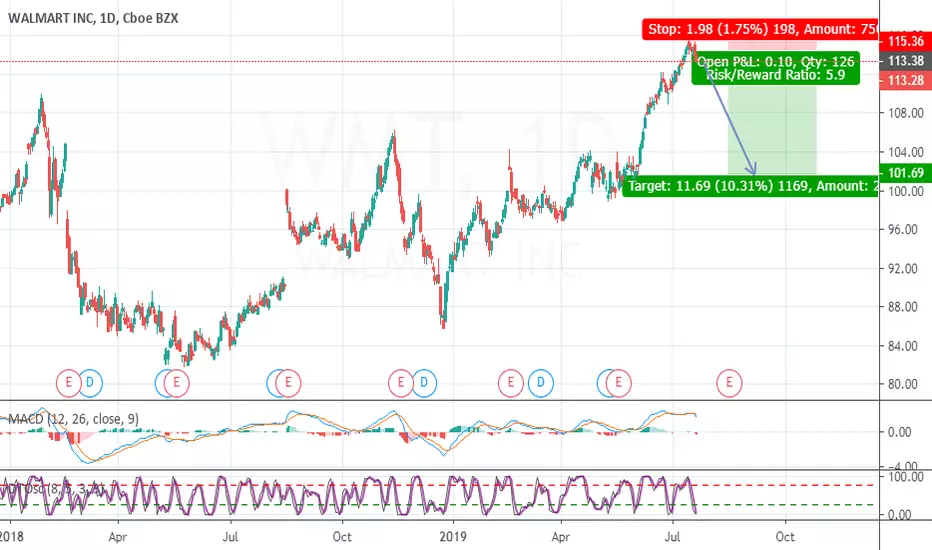
WMT short postionWalmart broke our trendline to the short side. I like this one with a first target of $110 short intrest is low so watch out for that come monday. Looking for entry confirmation off 30m chart for possible short swing. If we see walmart drop can keep and eye on target as well.

WMT approaching resistance, look out for potential reversal!
WMT is approaching its resistance at 114.85 where it is could reverse down to its support at 103.80.
Trading CFDs on margin carries high risk.
Losses can exceed the initial investment so please ensure you fully
understand the risks.

Short Opened - Puts 3.20.20 $6.00GE vulnerable to suffer from macro contraction, lots of lingering pension obligations, innovation R&D burn, shrinking moat

WMT long setupWMT going up with trend line. possibly buy. wait for retracement. I also watching this one .


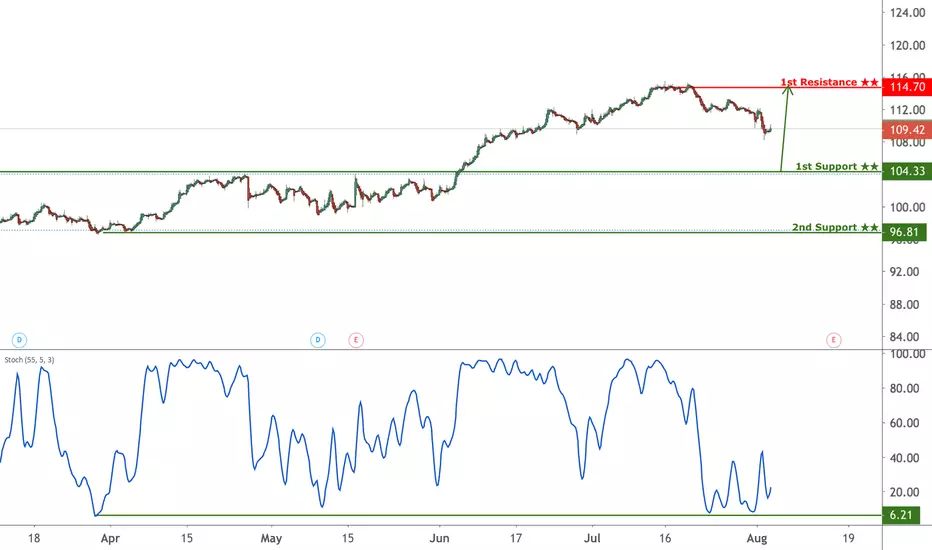
WMT approaching support, potential for a bounce!
WMT is expected to drop to 1st support at 104.33 where it could potentially react off and up to 1st resistance at 114.70.
Trading CFDs on margin carries high risk.
Losses can exceed the initial investment so please ensure you fully
understand the risks.
Shorting WMT SharesOn the hourly chart of WMT shares, with high probability, the price has fished the 1-5 Elliott cycle with multiple AO divergencies between wave 3 and 5. This gives me an idea that there is a good chance to make money on ABC corrective zigzag. Going short with good RR ration using trading levels that are marked on the chart. What do you think?


BYND Strong IPOBYND is in a strong and tight bull channel since the IPO. This bull trend from the open is what a trader wants to see when buying for long term investments. Last week formed a reversal attempt. When the market is strong, first reversal attempts fail 80% of the time and instead create the start of a second leg up. The bears will likely need some form of second reversal attempt like a large low 2 or failed bull breakout (they act the same), in order to increase the likelihood of reversing the bull spike. Even if there is a good bear reversal, the bulls will likely look to buy again around the 50 open. If the bear pressure is not strong, the bulls will look to form a spike and bull channel which usually forms after two legs sideways to down, and generally stem from a high 2 or wedge bull flag.
If you found this helpful please like and share! Feel free to comment or ask questions.

Daily WMT forecast timing analysis by Supply-Demand strength21-Jun
Investing strategies by pretiming
Investing position about Supply-Demand(S&D) strength: In Rising section of high profit & low risk
Supply-Demand(S&D) strength Trend Analysis: In the midst of an upward trend of strong upward momentum price flow marked by the temporary falls and strong rises.
Today's S&D strength Flow: Supply-Demand(S&D) strength flow appropriate to the current trend.
View a Forecast Candlestick Shape Analysis of 10 days in the future: www.pretiming.com
(You can easily create a trading plan.)
D+1 Candlestick Color forecast: GREEN Candlestick
%D+1 Range forecast: 0.3% (HIGH) ~ -0.2% (LOW), 0.1% (CLOSE)
%AVG in case of rising: 1.2% (HIGH) ~ -0.2% (LOW), 0.8% (CLOSE)
%AVG in case of falling: 0.5% (HIGH) ~ -1.0% (LOW), -0.4% (CLOSE)
Price Forecast Timing Criteria: Price forecast timing is analyzed based on pretiming algorithm of Supply-Demand(S&D) strength.

WMT - 15min long bounce off supportwmt strong uptrend. has been holding relativly strong all day during this fade. if market turns around here, wmt will bounce hard. stop just below red line

WMT to continue it's channel up to $111.50-$113.00 this weekWMT is likely to continue it's channel up to $111.50-$113.00 this week. (Calls are cheap.)

WMT -long until prior ATH retest at $110 R/R= 7.5WMT is trending up, creating higher highs and higher lows while respecting the black trend line. "looking left", i dont see much resistance until a retest of the all time highs at $110. R/R = 7.5. tight stop loss a new low thats also below support.


$TGT 15% gain incoming? Major support 100/200/260ma WEEKLY? $TGT100/200/260ma WEEKLY? MASSIVE GAIN INCOMING?

$WMT Uptrend channelWal-Mart Stores Inc $WMT shares are gapping higher, lifting up and is moving towards of the uptrend channel.

WMT Rolling Over AgainCould not sustain its H&S breakout, and looks to go lower to build momentum for another move up. Target 97-100.

Always Be Against Your IdeasThere is no doubt you should belive in your analysis but it doesn't mean to have no Plan B
in Ew method u can count waves in different views depends to big market indices,volumes,market sentiments,multiple timeframes and ...
in this chart i show you two models of counting
1.I counted 4th wave as a contracting triangle and its telling us to go short
2.the 4th wave ends at A in this chart and if it breaks the top of triangle it can continue as an ending Diagonal
Probilities can be even more like counting 4th wave as a WYX Combo or ...
Thank u for reading , Be Profitable

WMT - Long if above 100.53. it has been nice with profit WMT - Long if above 100.53. it has been nice with profit and now at resistance making flag. I would continue to long this one if above 100.53

WMT My other position that is not in weed stocks, expiry of March 15th. Only 2 weeks out position if profit is made then I will roll up into the next expiry, WMT loves to play opposite of the market in which is a little shaky at the moment. Goodluck and have fun my great value shoppers :)
