WMT

Walmart (WMT) - Flipping The Cart ! - 5/18/2018Unfortunately Walmart is not Amazon and nobody should expect its stock to rise by buying a loss making company in the name of growing market share. Walmart's acquisition of Flipcart ( Indian online seller like Amazon ) is a lottery for Flipcart's owners and headache for Walmart's share holders. Important question is how can one compete with a company which really doesn't want to make profit !! So as the things were standing, in coming years, Flipcart might have gone bankrupt after fighting with Amazon.
In this scenario, WMT can be sucked back to its previous boring range of $60 +/-10. In fact boring ranges of good companies are more easy and lucrative to trade. Can't wait for that !

Walmart Bull + $85 TargetWalmart's earning reports are due within a week and they are coming up as close competitors to Amazon. They recently acquired Flipkart in a needy but brilliant move to try taking more control in the emerging e-commerce market. Given that they were positively skewed to the left and are now facing a negative correlation, it may not look good. However, the recent acquisition of Flipkart, the market share they already owned in the retail industry and the fact that many of their retail competitors are losing ground looks like positive market potential. However, some analyst could claim these as assumptions or informational bias in looking at the outcome of the data. That being said, given the recent trend-lines in price with medium risk, an $85 short call seems imminent and highly likely.

Wal-Mart $2 Bucks from Strong Support, Entry into India. . .Many believe India and China are the future of retail.
Wal-Mart seems to agree, and on 5/9 announced a $16 billion USD bid for a 77% stake in Flipkart, India's premier online retailer.
Wal-Mart paid up to beat out Amazon for this exposure to Asian retail. Will it be worth it?
Luxury retail is in great demand but everyday retail is struggling, especially in the United States. Wages remain stagnant, consumers are turning more and more to debt, and western countries don't offer much in the way of growth for retailers (indeed, several retailers have been driven to bankruptcy in recent years). Wal-Mart provides a place for the everyday consumer to buy everyday products, but margins can only continue to compress as: 1. the cost of goods rises with a consumer that can't handle increased costs passed onto them, and 2. WMT fights to reorganize to take market share in attractive online and Asian markets.
Wal-Mart needs to catch up to compete with Alibaba and Amazon in markets with growth potential, and seems to be taking the right steps to do so. In the short-term, that could be bad for share price - or is the "bad" already baked in, and are traders\investors ready to pay up for Wal-Mart stock?
Wal-Mart has to compete for its share of fruitful markets, even if it means margin compression.
Looking at the technicals, Wal-Mart has abruptly fallen to near strong support in and around $81 USD. WMT reports Q1 2018 earnings on 5\17, and it's conceivable the numbers can't come in much worse than the downside upset from Q4 2017's earnings call back in February. Is disappointing news baked in to the price already, with Wall Street already expecting a little pain as Wal-Mart transitions into the company it needs to be to take on Amazon and Alibaba in shifting online and global markets?
WMT paid up to jump in to growing East Indian (and Chinese) retail - it more or less had to, and "had to" isn't a good place to be when negotiating deals - but will an exploding Asian retail scene lead to explosive moves upward in the price of WMT shares? The move up may or may not be today or tomorrow, but presently, the company's decisionmaking seems to bode well for Wal-Mart's future.
Please like, follow, and share, and maybe we can have fun and do great things together.
Thanks again!
See it on the site: holsturr.com/category/markets/charts/
** For speculative and research purposes only - good luck! **

WMT | Short Straddle Case12:43:25 May11 short 92 - 84 WMT straddle for 1.50 credit
No catalysts (earnings May 17)
Uncertainty about competition w/ Amazon is stifling trading volume
No sign of strong recovery after earnings miss paired w/ selloff
Wide strike spread leaves 5% margin of error

WMT- Is the Bottom in?? WMT looking like a good longer term buy from this area. Sitting at pretty significant price action support but technicals may have more downside left in them, although they could just as easily fire to the upside from here. Long with a stop around the $82 area if which broken I would look for another long entry in the mid 70's.

WMT - Bullish Swing TradeThis is a riskier trade, I am betting that the 200 SMA will hold and that Walmart will move higher. WMT has already bounced off of the 200 SMA several times before. My target is $92.75.

WMT - great buying opportunity off the 200SMAPerfect 618 retracement, bounce off the 200 SMA..... All i can say is Be bullish at this level! Buy this Dip!


Wal-Mart WMT looks like it presents an opportunity to buy in at heavily discounted prices. To the tune of 20% off. Normally I would be interested in buying nearly anything that is 20% off.
Pull up this chart and look at it on the Weekly time frame. It appears as though our bearish trend might not be over and is just beginning.
Fundamentally I like Wal-Mart and I think that their entry into the meal kit service will present a great opportunity to increase store traffic.
Noticed large institutional buying of WMT in Q4 2017, and although positions are starting drown this likely appears to be a buy and hold opportunity.
I think the retail market will continue to grow in 2018 as we saw the highest retail sales growth in more than a decade (Q3 2017).

Walmart (WMT) Walmart looks to be on the downside of it's market cycle. Be prepared for bull trap then a
"return to normal" before bearish continuation.
Just my opinion.

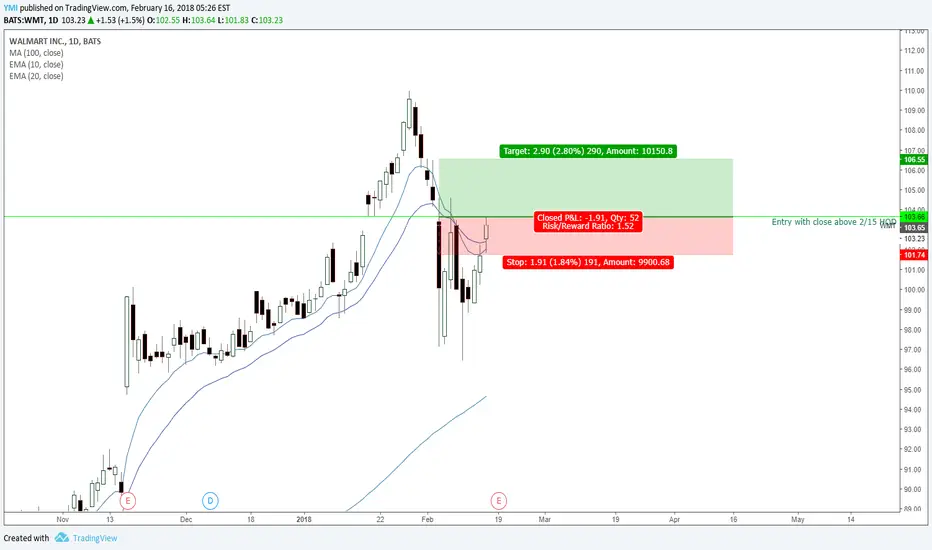
WMT Swing TradeWith either a close above today's 2/15 HOD or a retest if we gap up, i will look to enter this quick swing trade. WMT looks strong sitting on the 10/20 EMA's
Short WMT positionPlease read the description on the chart. As always, trade with good risk management and patience.

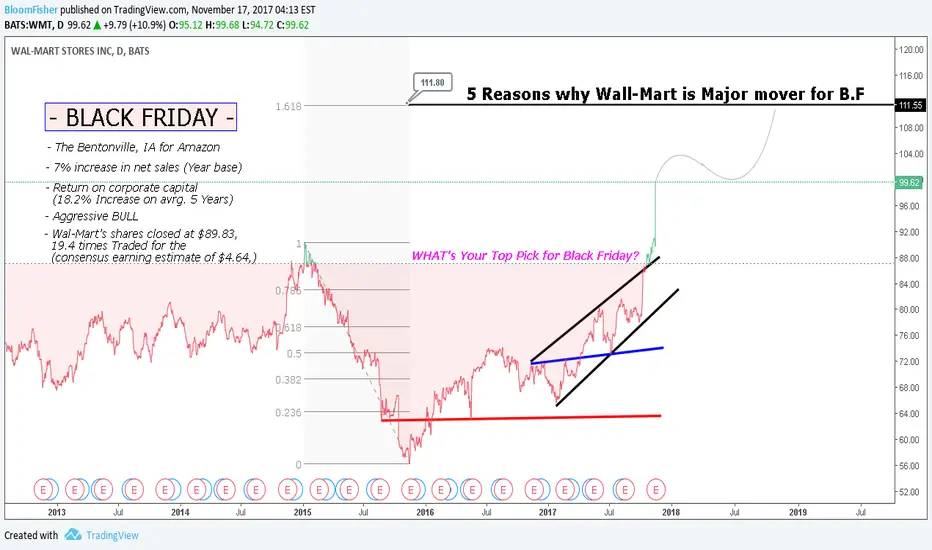
WMT | 5 REASONS WHY WALMART is First PICK for BLACK FRIDAYHere's why WALMART is First PICK for BLACK FRIDAY
__________________________________
let us know what you think by commenting down below
make sure to give a Like if this analysis clear your thoughts!
THE WEEK AHEAD: HD, CSCO, TGT, BBY, WMT, GPS, AMAT EARNINGSWe have bevvy of retail earnings announcements next week as the full season tapers off:
HD announces earnings on Tuesday before market open with a background implied volatility of 23% (top quarter of 52-week range).
CSCO -- Wednesday before market open with a background of 27 (near 52-week high).
TGT -- Wednesday before market open, at 36 (top quarter of 52-week range).
BBY -- Thursday, before market open, at 53 (near 52-week high).
WMT -- Thursday, before market open, at 25 (near 52-week high).
GPS -- Thursday, after market close, at 44 (above middle, but below top quarter of 52-week range).
AMAT -- Thursday, after market close, at 41 (near 52-week high).
I generally prefer playing earnings where the background volatility exceeds 50%, and it's in the top-quarter of its 52-week range, implying that the best candidate for an earnings contraction play would be BBY with AMAT close behind/worth watching for an increase in implied volatility running into the announcement.
Broad-market exchange-traded fund-wise, there isn't much to play: the Brazilian exchange-traded fund continues to print implied volatility percentages at or above 30% (currently, 35-ish), followed by the petro exchange-traded fund, XOP (34).
For non-earnings individuals, TEVA (72/upper end of its 52-week range) continues to garner my attention, along with CTL (56), which -- post-earnings -- maintains high volatility.
The majors -- well, there isn't much to look at. IWM leads with a background implied of 16, which is basically tied with the QQQ's at 16. SPY comes in at a paltry 13 ... .
On the volatility product front, the first /VX future trading at or above 16 is out in May (184 DTE), meaning that a <90 DTE VIX Term Structure trade isn't in the offing for me. However, the VXST/VIX ratio finished Friday's session somewhat elevated (.92), so it's worth keeping an eye out for any >1.00 pops in which to consider Contango Drift trades, particularly as we wind into a rollover with VIX spot trading at 11.29 relative to the Nov contract's 11.60 (2 DTE).

Good BreakoutIt's been an impressive 2 days for $WMT. Now we'll see if it decides to fill the gap or consolidate above it.


WMT - Short from $77.53 to $72.53; $77.50 September Puts WMT is going down after its recent earnings release. It has huge insider selling & overall looks very good as short. We think it has good downside potential, and to play this we would consider September $77.50 Puts which are $0.85
* Trade Criteria *
Date First Found- August 24, 2017
Pattern/Why- downward momentum short
Entry Target Criteria- Break of $77.63
Exit Target Criteria- $72.53
Stop Loss Criteria- $81.07
Please check back for Trade updates. (Note: Trade update is little delayed here.)

WMT - Earnings option play, $79.50 August Puts, currently $0.87 WMT is potential earnings play. Its looking choppy in the top & seems forming a H&S formation. Moneyflow is getting weaker. It also has some insider selling. We think it has good downside potential with earnings. To play this We would look at $79.50 August Puts, currently $0.87.
* Trade Criteria *
Date First Found- August 15, 2017
Pattern/Why- Earnings Play; Potential H&S formation
Entry Target Criteria- Looking at $79.50 August Puts, currently $0.87
Exit Target Criteria- N/A
Stop Loss Criteria- N/A
Please check back for Trade updates. (Note: Trade update is little delayed here.)

WMT overvalued & ripe for pullback?WMT completed a head and shoulder pattern without any substantial pullback in July. WMT is currently at the average analysts 12 months target of $81. However, according to Trefis and CFRA, the fair value of WMT is approximately 5% to 7% lower. A meaningful pullback of 10% to the 200 day moving average would not be unreasonable should investors be displeased with the next earnings report on August 17. Investors have not seen any meaningful increase in earnings during the past 5 years.
Earnings estimates for 2017 are 4.32 with the 2018 estimate of 4.36 giving minimal increase. Based on an average PE ratio over the last 5 years of 15.15 a share price of $66 is not unreasonable and would return the stock back to the lows seen earlier this year.
Long term earnings growth projections for WMT are 5.8% annually over the next 5 years. Valueline suggests long term investors can expect this as a minimum 3-5 year annual total return projection.

$wmt pullback first then back down!waiting for corrective move to complete on higher time frame retrace back to .382 area resistance and resume downtrend move
quick clean swing moves with negative momentum and weak volume pressure
monitoring price action for continuation trade to downside
WMT. Short on Fibo confluence and possible pattern cascadeChart shows that price is being bewered in a strong resistance zone, which is trying to break once again. A 75.90 per share has an interesting Fibo confluence which may be considered as a "do-or-die" level as it is a level which validates or invalidates two Cypher patterns.
Only a bigger one is shown, which would complete at 60.60 per share, while a smaller one points towards an eventual return to below 70 per share. Will open a short position aiming 67 as a first target and then watch on how the price behaves. My SL will be placed at 78 per share
