xrp updatexrp is making wave 2 of its impulsive downward waves .its final target is 0.23
please see how structure will come out
Wolfe Wave

Possible Wolfe Wave on DXY5th wave is in progress. RSI & MACD Divergence. Ideally shoud break above 109.85 resistance to perform channel fake out in the sweet zone.

WOLF - Horizontal Resistance Breakout WOLF has broken out of long horizontal resistance
It has formed a sort of Ascending Broadening Wedge structure that looks quite bullish above the resistance which is now a support for price

first 111 then 106wave count of the pair is seen on the chart and the pair is trying to complete its 5 impulse wave toward 111 and then retreating toward 106 or even 103
now the pair is making its 5th wave
target are getting from ichimikou overlapped tenkensen and kijensen on 4H and 30 minute
a wolfe wave is also seen that helps us better understand wave structure
please see and share your comments

Russia seaborne crude ban on December5th,1.4 mbpd off the marketRussia side:
As the European Union prepares to implement a ban on Russian seaborne crude in December, the market will have to prepare itself for a loss of 2.4 million bpd, according to the International Energy Agency
The ban on Russian crude imports by sea will take 1.4 million bpd of oil off the market, along with 1 million bpd of petroleum products.
This is in line with the ban on Russian seaborne crude that goes into effect on December 5th, and the embargo on petroleum products, which goes into effect on February 5, 2023.
The oil market attempts to determine whether fears of declining demand–particularly coming out of China’s COVID lockdowns–or tight supply will rule fundamentals. The IEA highlighted decelerating growth in global oil demand in its latest monthly report, but also noted that due to significant gas-to-oil switching, total demand growth was actually only slightly lower.
Iran Side:
Oil prices are also seeing support from the dim prospects for a nuclear deal with Iran that would lift sanctions against Iran and allow its crude back onto the global markets. The International Atomic Energy Agency (IAEA) on Monday said that "the information gap is bigger and bigger" on Iran's recent nuclear activities. Also, the European Union's chief negotiator said Saturday that "in light of Iran's failure to conclude the agreement on the table, we will consult with our international partners on how best to deal with Iran's continued nuclear escalation."
supply outlook is gloomy ,it seems that market have two week to continue its bear move due to strong US dollar and China weak demand but after that due to possible supply disruptions oil rally will initiate

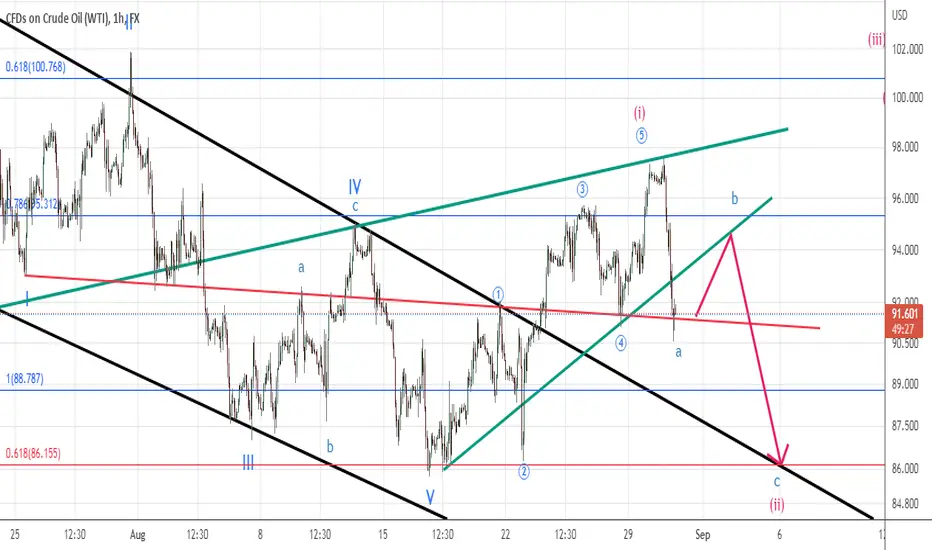
USOIL 1 hour wave count udpate we are in wave 2 of a bigger wave 3 for downward move toward target of 75 $
wave count are seen on the chart and with strong CPI yesterday ,bearish move resumed
Recent data showed China’s economy lost further momentum in August, with factory activity extending declines and export growth slowing.
The world’s second-largest economy narrowly avoided contracting in the second quarter amid widespread COVID-19 lockdowns and weakness in the property market which have dented consumption and factory activity.
Recent hawkish comments from Federal Reserve and European Central Bank (ECB) officials have put investors on alert for possible recessions in the U.S. and Europe. Energy demand worries weighed on crude prices as Tuesday's stronger-than-expected U.S Aug CPI report may push the Fed to keep aggressively hiking interest rates, which risks sending the economy into recession and reducing energy demand, so as crude oil is a dollar-denominated commodity. A stronger dollar tends to be bearish for crude.
please see DXY Chart as key factor for crude price

dxy wave countdxy is short for a while then resume its upward move
so it seems that dollar index is down to 107 and then it is going up for 114 and 116
please see my previous analysis as follows

doge wave count please see wave count of the coin as seen on the chart .we are now in 5th wave to complete bigger 3rd wave .
for get better view please see big picture link
please also see my previous analysis as well

xrp target is 0.23xrp is completed its first leg of 5th impulsive downtrend and now it is in correction and sooner or later it will resume downward move toward 0.23
. our wave count is seen on the chart and after wxy correction we have seen bear move resumption.
for better view please see big picture on daily time frame
as requested by @s_hers

bulls delayed for aggressive interest rate hikes & China’s COVIDbullish scenario delayed for a while due to aggressive interest rate hikes and China’s COVID-19 curbs and invalidated our upward wave count.
now with ichimikou overlapped tenkensen and kijensen on daily timeframe we understood that bearish move continuation is imminent toward 75$.
Despite the market’s strong performance the past two sessions, crude oil is still poised to post a second consecutive weekly loss. This week’s losses are being fueled by a bleak demand outlook due to a number of aggressive interest rate hikes and China’s COVID-19 curbs.
On the bullish side of the equation, Russian President Vladimir Putin is threatening to halt oil and gas exports to Europe if price caps are imposed and a small cut to OPEC+ oil output plans announced this week also supported prices.
In bearish news that could have an impact on demand, the city of Chengdu is extending a lockdown for most of its more than 21 million residents on Thursday while millions more in other parts of China were told to shun travel during upcoming holidays.

eur usd Din Daily time Fram I think wave 3 is finish correct now will go to wave 4 and also in wolf wave at the same time is give me price action to inter buy

cxy is bullish for a while Canadian dollar index is within its correctional wave and a wolfe wave pattern is seen there indicating final leg of WXY will be completed
this week BOC will announce new interest rate which predicted to be hawkish

Fawaz is temporary corrective to gain some momentum. Fawaz is very promising and has just formed a bullish flag as highlighted in yellow to continue his impulsive wave 5 of Wolfe.

a clear pullback on daily timeframe trendline with MACD div.price clearly pullback on daily timeframe trendline along with MACD divergence are signs of bullish move despite heavy fall down of previous week .
so the lower line of the two channels could play a role of strong support to up the price
European Commission president calls for price cap on Russian oil so this could interrupt supply from one hand and from other hand Iran JCPOA will be revived as French source announced that it will be concluded within two weeks to strengthen the supply .it seems that major European powers along with USA are planning to cap the price of Russian oil which is exporting 7.7 mbpd and if Russia stop export they replaced it with Iran oil which is full capacity is 3.5 mbpd to balance the market but not completely so if this happen we will see a possible supply weakening.
we have also new interest rate hike hawkish announcement on September 20-21 which could be outweigh oil price
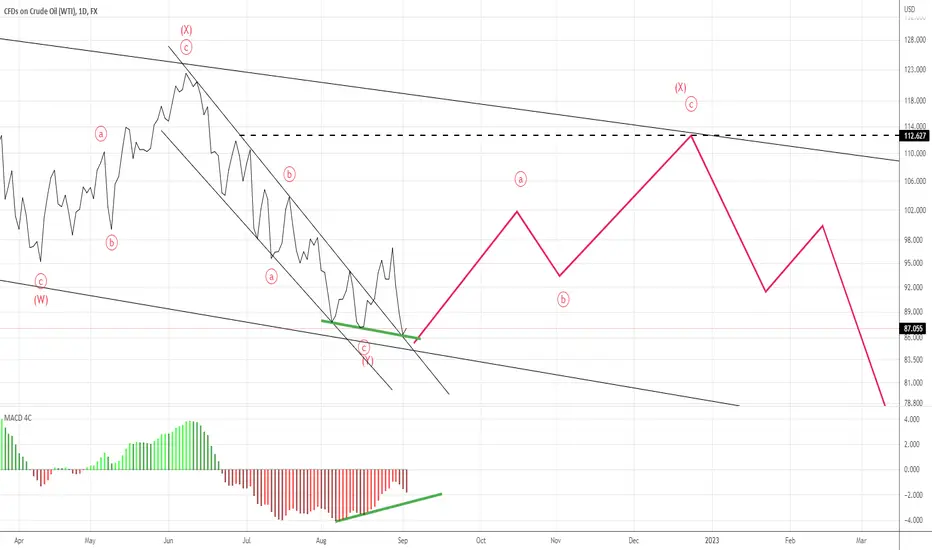
WTI big picture wave structure,first 112 then 75 $ in long run daily time frame wave count is a big picture of usoil wave sturcture as depicted on the chart indicating upward move toward 112-115 $ then going down for 75$ as these two numbers is taken from Kijensen and Tenkensen overlapped target and also our wolfe wave pattern and is in coincidence with USDCAD wave structure as below
if you have any comments about how you think for this analysis please share
thanks
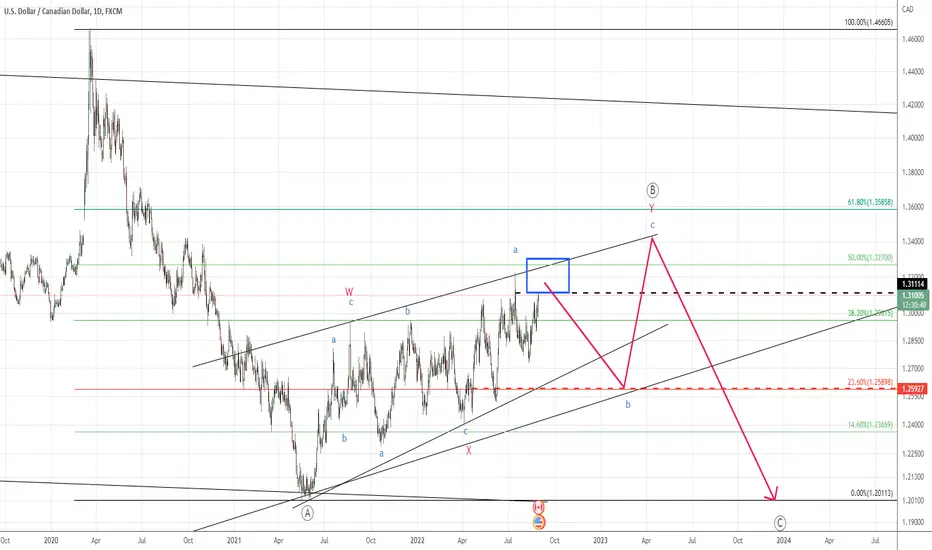
daily correction wave count wave structure of USDCAD is crucial as it will give us an idea how USOIL will move
these two pair and commodity is intensely and inversely correlated . USOIL is directly affected by USD and CAD so this USDCAD pair is always under scrutiny as some traders talked for it inversely
now pair is in a huge WXY to complete its B bigger wave .
there is a blue rectangle from which we are expecting that pair will start its bear move.so we will keep an eye on blue rectangle to follow waves.
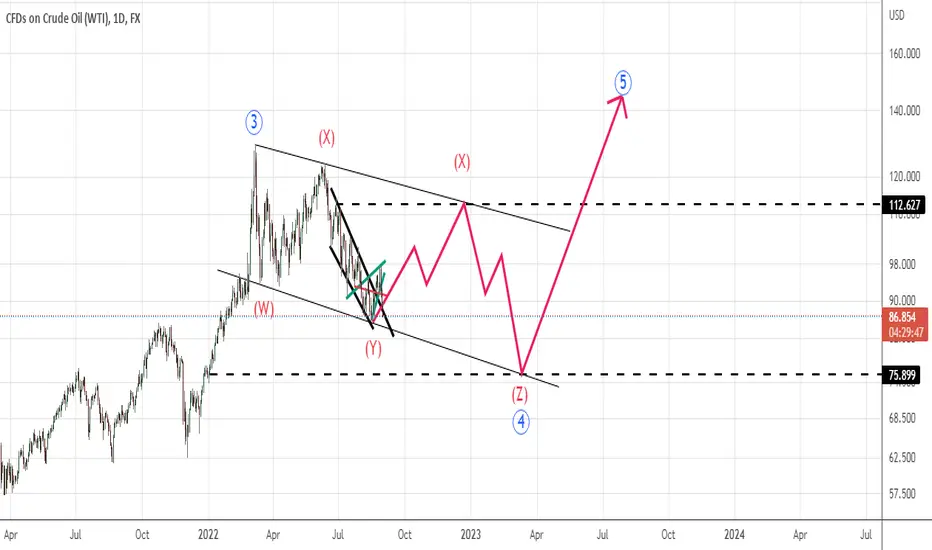
keep this scenario in my mind we get an idea for future WTI going ahead . i think that USOIL will make a WXYXZ correction for wave 4 according to USDCAD wave structure so we think that usoil will go up near 110-115 $ and then go down for 75 $
please share you comments
thanks
TORNUSDT +40%Long idea for TORNUSDT
stick to entry at 9.91
TP1 12.5 (~40%)
TP2 16 (~60%)
SL 8.7
Supported by Wolfe Wave analysis

oil is in correction phase after completing 5 impulse waveoil is now in correction phase as it is making wave 2 of its bigger 5 wave impulsive wave
fears of recession and lower demand due to aggressive central bank interest rate hikes are mentioned for the sudden shift to the downside as well as reports that Iraqi crude exports have been unaffected by domestic skirmishes. These events push prices higher the previous session.
there is a lot of noise out there that comes into the picture when you start looking at the Iranian deal possibly allowing for more oil into the market, a slowdown in production, but at the same time we have OPEC suggesting they may cut. In other words, expect more back-and-forth volatility
xrp is making wave 5 xrp is making wave 5 and its final destination is 0.2
we analysed using wave count and wolfe wave
please see my previous analysis as below
any comments please share
tnx

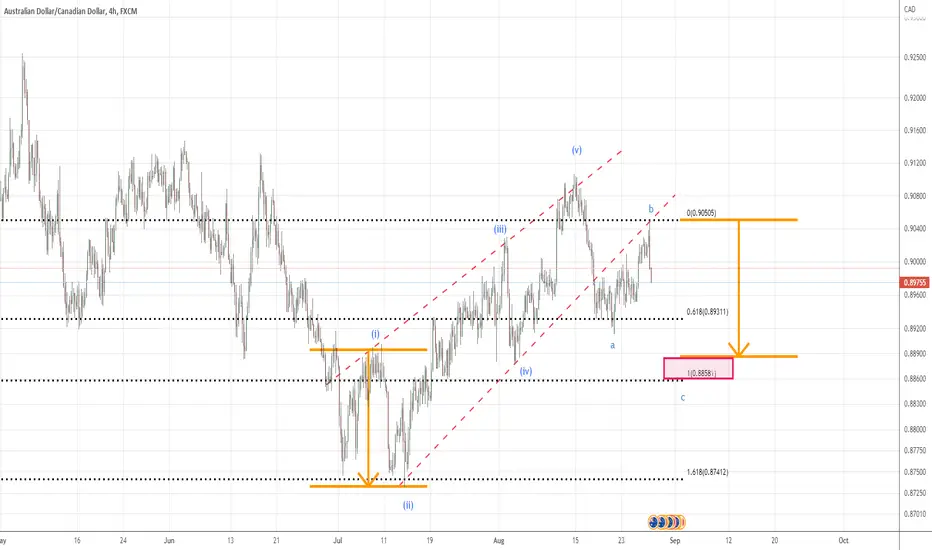
Audcad is seeking for 0.88581audcad is seeking for 0.88581 as its target
fibo level and wolfe wave pattern along with wave count used in this analysis
any comments please share
tnx
Yet another bullish Wolfe Waves appearance on Bitcoin's chartsI will position myself in a long order on Bitcoin after the equal lows are taken out. Closure below H4 demand invalidates the idea as we'd sink much lower in price if supply beat the demand here imo (and that is where I will be placing my stop loss orders and possible a short stop-limit order if I see fir by then). I will be taking profits at the three H2 bearish order blocks above (with the third highest supply point having the least probability) and trailing my stop loss below the price as we move up.
Use adequate risk management and position sizing please!
Please check linked ideas for my longer term sentiments.

Fed Chair Jerome Powell has just delivered his speechFed Chair Jerome Powell has just delivered his speech at the Jackson Hole Symposium. In his speech, Powell highlighted the importance of the current fight against inflation.
He noted that central banks must deliver low and stable inflation, aiming for price stability. Powell added that public’s expectations were an important factor.
Powell added that the Fed would make forceful and rapid steps to moderate demand. However, he also said that it might be appropriate to slow the pace of rate hikes in the future. As usual, the Fed’s decisions will depend on the data.

usoil will be completing its impulsive wave then retraces >78.6%usoil is waiting for its final leg upward to complete its 5 wave and then will start its correction which could be more than 78.6%
market seems to be shrugging off global recession talk this week with the focus primarily on supply issues. But the upside momentum seems to be stalling. The charts indicate there is plenty of room for the upside before the market reaches strong resistance, but it may take heightened supply disruption news to spike prices higher.
These events include disruptions to Russian exports, the potential for major producers to cut output, and the partial shutdown of a U.S. refinery.
Worries about a nuclear deal between Iran and Western powerhouses could also be limiting gains.If signed, Iran will bring upwards of about 1 million barrels per day of crude to the market. Prices could be pressured over the short-run, but over the long-term, it won’t be enough to offset the loss of Russian output.
also we are keeping eye on USDCAD wave structure to get better view how oil will move
any comments please share
tnx
