usoil is bullish based on USDCAD wave analysishello traders
as USOIL and USDCAD is correlated heavily and inversely we can get an idea about how usoil will move based on usdcad wave structure
based on the wave prediction below for loonie it is too hard to believe that at least for some while see bearish move .
i think that we should change our mind about continuation of downwad move for wti if we look loonie
Canada is one of the largest oil producers in the world with substantial oil reserves contained within its oil sands. According to the Oil and Gas Journal, Canada has around 173 billion barrels of proven oil reserves and at the start of 2015, these reserves were ranked third largest in the world. According to the Visual Capitalist, Canada has around 10% of the world’s global oil reserves.
Canada is also the third-largest exporter of oil with around 99% of its exports going straight to its gas-guzzling neighbour, the US. So, the price of oil has a big impact on CAD. When oil prices are rising, the Canadian dollar is rising. When oil prices are falling, the Canadian dollar is falling. The correlation between the Canadian dollar tends to ebb and flow, but at times the correlation between oil and the USDCAD can be over 95%.
Wolfe Wave

USDCAD is in a WXY correction so first upward 1.3111 then 1.2592usdcad is in a huge correction as WXY before its rally starts
as this pair is so correlated with usoil so we are keeping eye on it to get better view on WTI
for now usdcad is moving up to complete X leg around 1.3111 and then will head south for completing Y leg towards 1.2592
any comments please share

TotalTotal
Entry : 1.3 T
TP1 : 1,6 T
TP2 : 1,8
TP3 : 2 T
Last TP : 3 T
Stop : 980 B Close One Candle Weekly

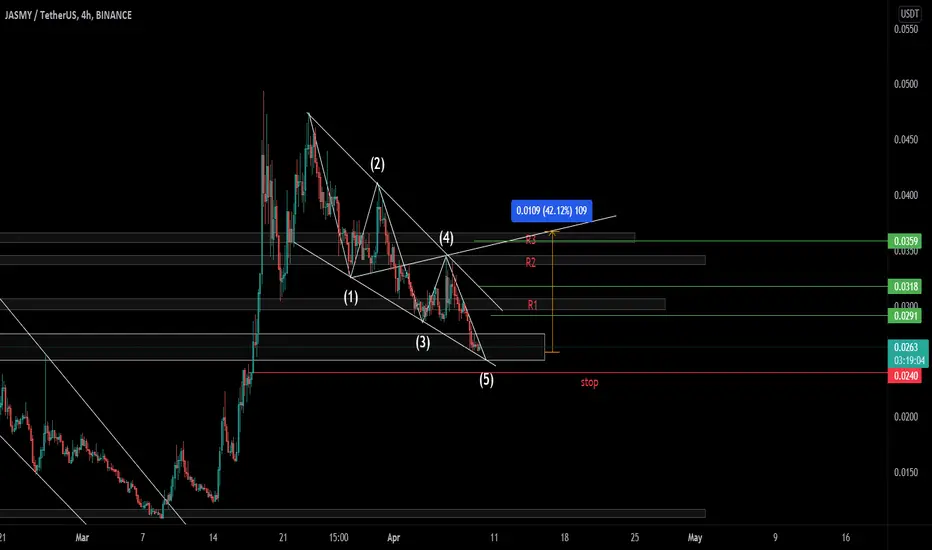
wave 2 is finished after retraces exactly 61.8% or notwave 2 of wave V of wave C of wave Y seems to be finished after retraces 61.8% fibo level of its previous wave 1.
i changed slightly wave count today after the rally happened yesterday made wave 2.
Crude oil prices jumped higher yesterday after hitting a six-month low on a steeper-than-expected drawdown in U.S. crude stocks. Additionally, in a sign of strong demand, gasoline stocks drew 4.6 million barrels, much higher than the expected 1.1 million barrel draw.
More importantly, U.S. crude exports hit 5 million barrels per day, the highest on record, EIA data showed, as WTI has traded at a steep discount to Brent, making purchases of U.S. crude more attractive to foreign buyers.
While strong U.S. exports and domestic gasoline demand are providing a little support, worries over China demand and rising Russia production are capping gains.China’s refining output remained sluggish in July as strict COVID-19 lockdowns and fuel controls curbed production.
Meanwhile, Russia has started to gradually increase oil production after sanctions-related curbs as Asian buyers have increased purchases, leading Moscow to raise its forecasts for output and exports until the end of 2025

🥈Silver (XAGUSD):Long-Term Elliott Waves●● Preferred count
● XAGUSD (SAXO) , 🕐TF: 1W
Fig.1
You can read a detailed commentary on the counting of the wave structure of long-term waves in the previous review . At the moment, long-term growth is expected to resume within wave Ⓒ of III , which has the right to take the form of an impulse or a ending diagonal .
_______________________________________
● XAGUSD (SAXO) , 🕐TF: 8h
Fig.2
It is assumed that the correction within the primary wave Ⓑ formed an expanded flat . I also want to draw attention to the formed pattern of technical analysis "Bullish Wolfe Wave". The model is indicated by two blue dotted lines, the upper line acts as a target for the expected upward wave.
_______________________________________
● XAGUSD (SAXO) , 🕐TF: 45min.
Fig. 3
_______________________________________
🕐TF: 8h
Fig.4
Locally, an alternative wave count suggests considering the probability of expanding the boundaries of the wave Ⓐ , complicating its structure to a diagonal consisting of zigzags. The markup is somewhat more harmonious, but has a number of controversial sections, for example, in the triangle X , in my subjective opinion, two subwaves are multiple zigzags , which is prohibited by the rules.
Anyway, the double zigzag in wave (2) is most likely completed. An upward wave is expected, based on the depth and structure of which we will distribute the options.
_______________________________________
_______________________________________
●● Alternative count
● XAGUSD (OANDA) , 🕐TF: 1W
Fig.5
The globally alternative count, within which a large triangle (IV) is formed (more details here ), along with the local alternative, suggests the development of an ascending diagonal, but in this context - as the final wave (C) of Ⓑ .
_______________________________________
Disclaimer:
— The owner of the TradeWaves-EWA © community is not responsible and has no direct or indirect obligations to the User/Customer in connection with any possible losses or financial damages related to any content of this community.

VERY RISKY TRADE IDEA SINCE BTC IS PUMPING. SHORT ON OPUSDTPERPBearish Wolfe waves - nothing much to explain! Very risky trade, and I am only risking some profits on it.
Targets in green (stick to your own stop loss / leverage).
Thought we could make use of $BTC's imbalance through impulse and the overbought RSI on the 15m timeframe diving below its RSI's MA for some quick gains.
Use proper risk management and position sizing please.

The usual gig - Wolfe Waves on BitcoinBullish Wolfe Waves forming on Bitcoin. 4 -> 5 broke the wedge with decent volume. Being conservative, I would expect wave 5 to reach the green rectangle.
Using leverage is up to you.

usoil 1hour wave count update Crude oil was under pressure at the start of the week as bleak economic data from top crude buyer China renewed concerns of a global recession and the market monitored talks on a reviving deal that would allow more Iranian oil exports.
The early weakness was compounded after disappointing Chinese economic data renewed concerns of a global recession that would be expected to reduce fuel demand. Also in China, the country’s refinery output slipped to 12.53 million barrels per day (bpd), its lowest since March 2020, government data showed.
A stronger U.S. Dollar also weighed on foreign demand for dollar-denominated crude. Talks to revive the 2015 Iran nuclear deal, which will lead to increased supply was another excuse to sell crude.
Crude oil could have a hard time mounting a reasonable rally over the short-run unless there is an unexpected supply disruption. Although there could be a bounce if Iran rejects the latest Nuclear Deal proposal.


bitcoin Scenariobitcoin have two Scenario
there is harmonic pattern bat if it successfully than Be careful from are 50K
there is wolfe wave
---------------------------------
another Scenario if bitcoin go under 40K then there is nice wyckoff


Saudi Telecom Company ScalpingStop loss and targets are in the chart,
DYOR, this is not a financial advice,
Good luck..

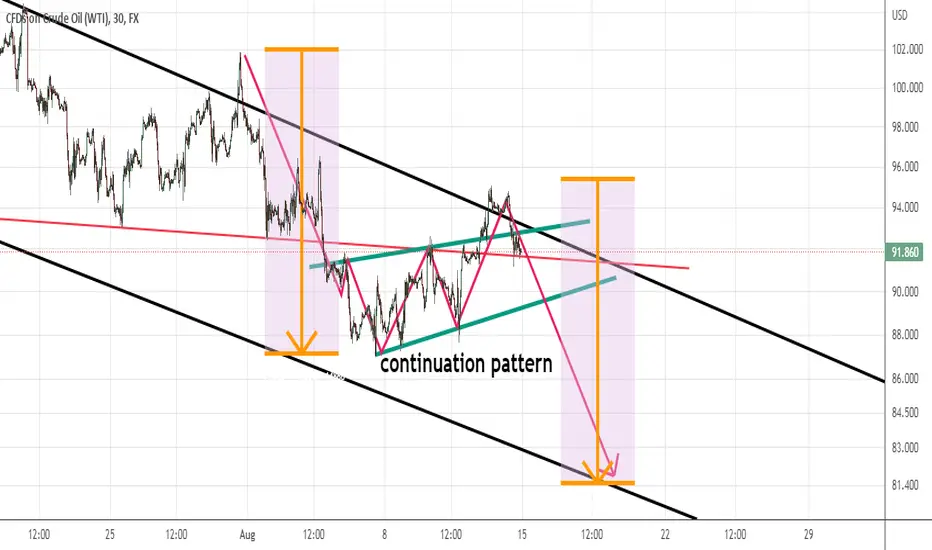
continuation pattern is indicating for bearish movea continuation pattern is seen on the chart for bearish move for oil dip toward the bottom of the channel .price came back into channel after false breakout that is coincides with our elliot wave count .
out targets for this bearish move is as follows
tp1 :90$ tp2 :87$ tp3: 82.5$
Oil prices plunged around 2% on Friday, on expectations that supply disruptions in the U.S. Gulf of Mexico would be short-term, while recession fears clouded the demand outlook.
Oil have had confusing signals this week on the outlook for oil demand. For example, this week’s US oil inventory report was an odd one, showing a massive, unexpected rise in headline stocks (bearish), but a large drop in gasoline stocks (bullish). Meanwhile, in its latest monthly report, International Energy Agency raised its 2022 oil demand growth forecast this week, citing increased demand for oil amid “switching” from gas, as prices surge. Meanwhile, in its monthly report also released this week, OPEC lowered its 2022 demand growth forecast.
1 hour wave count update of USOILLast week, crude oil prices fell sharply on fears that rising inflation and interest rates will hit economic growth and demand for fuel.
The playing field changed this week to the better, however, after softer-than-expected U.S. inflation data drove down the odds of a super-sized Fed rate hike in September and the IEA released a report that called for higher demand.
An unexpected drop in gasoline inventories was another supportive catalyst while a sharp rise in crude oil inventories and the possibility of an Iran Nuclear deal weighed on prices.
some thought the IEA’s stronger demand expectations would do the trick, but today’s price action suggests it may have not been enough to erase recessionary fears.
Experts expect to see an economic downturn but the size and duration are unpredictable at this time. Additionally, evidence this week suggests inflation may be slowing. However, Fed comments indicate that policymakers are likely to remain hawkish while calling for aggressive rate hikes until inflation is subdued.
That being said, we’re expecting to see a choppy trade over the near-term until there is clarity about the demand outlook, or unless there is a major supply disruption.

VERY RISKY. $MASK scalp. Bullish Wolfe Wave formation.Targets in green.
Risky trade, just trying out Wolfe on smaller time frames. If you take a look at the 1m chart things might make more sense. :D
Use proper position sizing (and leverage) considering the risk!

$ATA prime for a movement to the upsideBullish Wolfe Waves can be seen on $ATA enclosed within a triangle which is always exciting.
I expect to breakout of this triangle through the fifth wave, retest the broken trend, then bounce up from there to continue the movement to the upside targeting the supply point at $0.2580. Wouldn't be a bad idea to also book some profits along the way at the top of the big inverted hammer at $0.2487.
RSI does not looking too bad but it also doesn't look bullish enough to include it as part of the analysis behind this bias.
What a shame that I've thought that I had posted this idea before executing my trade, but turned out I didn't. Still not too late to punt in for a long at the retest.

" EURJPY " Buy Trade ScalpingHi Trader's ,, How Area You Today ,, Hope U Be Fine
Now We Have New Trade On " EURJPY " Let's Explain The Chart Together ,,
1 - What Is the Main Trend For EURJPY ? Down Trend
2 - Why We Will Buy From This Area ? Because This Area Is ( Order Block Area - Golden Zone - Support Area )
3- What The Price We Can Enter From It ? 136.25 - 136.100
Target And Stop Lose On Chart ,, Don't Forget To Like And Comment

wave count update 1 hour hello traders
a new update of usoil one hour chart is here as a technical view but as fundamental view
fed rate hikes tend to drive down demand. And its worries about lower demand that are weighing on crude oil prices. However, the selling pressure is likely to be limited because the supply outlook is still tight. The key support area on the September WTI crude oil chart that must hold is $89.54 to $82.80.
Any supply disruption especially in Europe due to the war could turn this market higher easily. However, there is factor that could put additional pressure on prices. That is the Iran Nuclear Agreement. This will bring new supply to the market.

BTCUSDTPERPThis is not sure for 80 % and do your search before you enter in this position and you can do with your money whatever you want to do dont forget to follow me. Go with 0X leverage and the stop loss is less than 2% so if this trade loss we will nit less so much but if this trade going right we will take so much

" US30 " Sell Trade With 1500 Pips TargetGood Morning Trader's ,, Let's Explain Together " US30 " Sell Trade With 99% Accurate Area ,,
1 - Why US30 Will Down From This Area ? Because This IS Golden Area In Our Strategy And That's Order Block Area
2- How Many Pips For Target ? 1500 Pips
3- How Many Pips For Stop ? 350 Pips
4- When We Will Enter Sell ? 33000 - 33250
Don't Forget To Put Like And Comment

" GBPJPY " Buy Trade With 300 Pips Target Hi Trader's Good Morning ,, And Hope To Be This Day IS Profit Day For All Of You !!
Let's Explain Together The " GBPJPY " Next Move !!
We Waiting For Break Out The Area In Chart ,, And Test It To Long To Target
Suggest Break Out Point 163.950
Target 166.400
Please If You Like My Chart Make Like And Comment
