GMTUSDTPERP/BINANECThis is not sure for 80 % and do your search before you enter in this position and you can do with your money whatever you want to do dont forget to follow me. Go with 0X leverage and the stop loss is less than 2% so if this trade loss we will nit less so much but if this trade going right we will take so much
Wolfe Wave


BTCUSDT short to 22400Based on a beta Wolfe wave indicator
Use it for more precise entries for your day trading


TFUELUSDT 9%Based on a beta Wolfe wave indicator. Not trading this specifically- but already have an investment in this coin

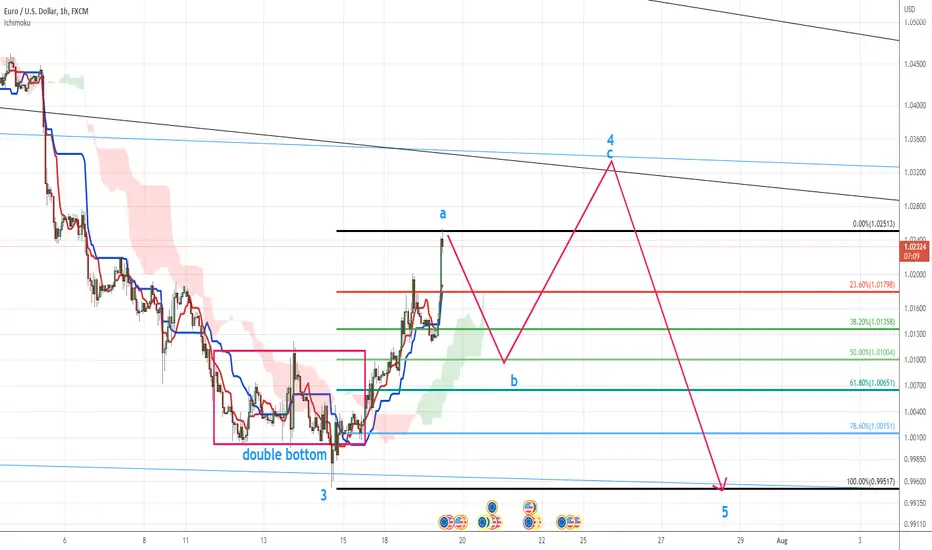
as i see in the chart as i see on the chart using wave count and ichi target
for ichi target we are looking for flat ks and overlapping ks and ts
please share your comments
tnx
ICPUSDT Wolfe+Based on a Wolfe wave indicator.
Personally investing in this coin to reach at least a price of 25

BTCUSDT SHORT Based on a Wolfe wave indicator in beta that I’m testing out. Let’s see if it holds up


a react to neck line of h&s pattern to continue its bear movewe are waiting for the pair to go up toward its head and shoulder pattern nech touch and then will continue going down to its ichi target and also head and shoulder target as depicted on the chart
please see my previous analysis as below
tnx

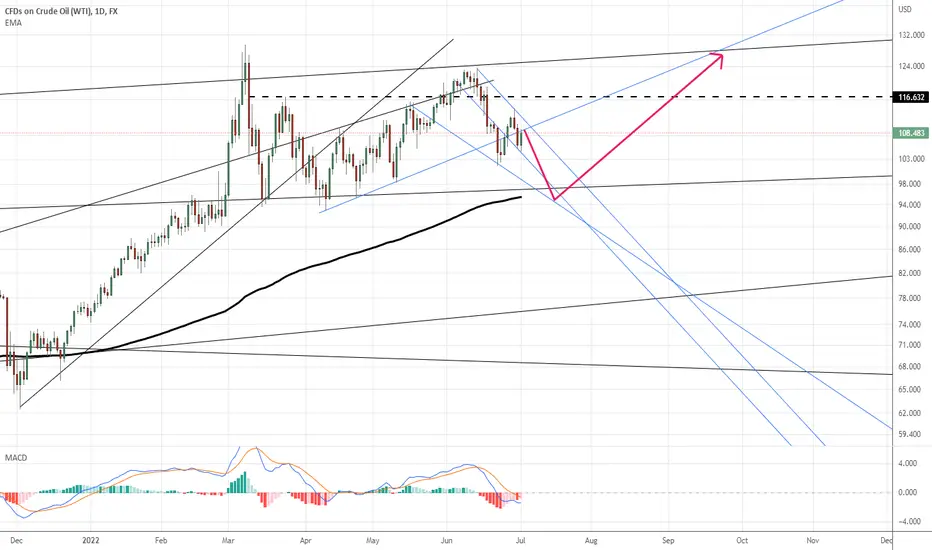
oil is bearish for a while then will continue its rallyoil is reacting to its previous WW pattern to complete it and will go downward around 100
when oil goes downward and complete its new WW then will rally toward its target around 120
you can see my previous analysis as below
any comments please share
" GBPJPY " Sell Trade With 200 Pips TargetPair Name : GBPJPY
Time Frame : 15 Min
Analysis Type : Scalping Trade
--------------------------------------
➡️ Main Support Level : 164.60
➡️ Main Resistance Level : 167.80
➡️ Time To Entry :166.750 -- 167.00
➡️ Target : 165.000 - 163.000
➡️ Stop Lose : 167.600

Blackberry RebornBlackberry has very nice upside potential but considering the timing of the historical swings, waiting 5-6 years for a 30X move is not something I'm personally interested in. The Digital Surf Community has outlined numerous other stocks/cryptos with high trajectory that are likely due for completion at a much earlier timeframe.
Blackberry is a bit of nostalgic company for me however and I am very much rooting for their future success. I bought a Blackberry Sidekick with my first military check, well over a decade ago. Its a bit refreshing to see how they've rebranded themselves and made a transition from cellular services to now working in the Cybersecurity spectrum (which is now a professional field for me as well).
I am not entirely sure what news is to come for BB but over the next few years but it shall be the beneficial/good kind. If you have 4-6 years to wait on such a 30X move, now is the best time to enter your positions. Personally, I don't have that much patience and honestly, the anticipated 30X move pales in comparison to some of the other items we're currently monitoring at Digital Surf Trading Community.
If you're a Blackberry fanatic, die hard investor, this is for you. Share, comment and like this post if you find it helpful at all.
Surf well and don't drown.

BTC possible 5th wave BTC possible massive Wolfe wave is forming on a weekly timeframe. The 5th wave is aiming at 200EMA
There came gray stretches of volcanic plains,
Bare, lone and treeless, then a bleak lone hill
Like to the dolorous hill that Dobell saw.
Around were heaps of ruins piled between
The Burn o’ Sorrow and the Water o’ Care;
And from the stillness of the down-crushed walls
One pillar rose up dark against the moon.
There was a nameless Presence everywhere;
In the gray soil there was a purple stain,
And the gray reticent rocks were dyed with blood—
Blood of a vast unknown Calamity.
It was the mark of some ancestral grief—
Grief that began before the ancient Flood.

BTCUSD expected Path (bigger picture)Recently I was following BTCUSD through its consolidation up until break of structure last Friday 6/10. That series was a local analysis/predictive tool using continuous-time markov chain (CTMC). This is a bigger picture analysis using charting techniques centered around supply/demand trendlines and a statistical method I developed in R studio that measures proportional range w.r.t. a displacement control chart (based on price action relative to the 9 and 20 day moving averages (as well as the relationship between those moving averages)).
There is a post from someone I follow that has what I think is the most accurate Elliot Wave coverage of BTCs count, which has some levels that align in the neighborhood what I am getting using this method. Here is a link to that post (@Nailed_it, hope you don't mind if I link this idea - if so lmk and I'll obliterate my post):
If you want the details follow that ^
Below is more of a general idea for upcoming path to expect using my method:
Black 2pt line is most likely path from here (dashed 1pt black line is alternative) - i.e. bounce to low 30ks (point target 31616.3) to test recent channel {the decision at low 30ks will differentiate which path is taken}:
- If rejected in low 30ks, which is higher probability, expect more downside to around 12-17k (point target 14278). This should mark the end of the corrective wave. From there my initial target to spark a rally is 41k by October 2022
- If continues after testing low 30ks, flip the expectation above (i.e. 41k first near term, then drop to ~14278k to complete the correction by October)
*Max downside risk I see is 6396, but notice I included 0 in this analysis chart (that's right, don't plan on it but don't count it out either hah)
**Upside point target, longer term, is 84799. This probably wouldn't be realized until 2023? We're not there yet but I'll update once I see which (if either) of these 2 paths play out... 2 roads diverged in a yellow wood, and BTC did what it wanted to ("BTC stay on the path"... "No way I'm not scared of the SPYDER, I control the SPYDER").
The images posted in the chart are interesting. Not going to go into details but as I mentioned above I essentially use average daily price w.r.t. control charts to obtain estimated ranges. The trajectories are generally pretty stochastic/random, but sometimes interesting patterns unfold at the end of price cycles that give insight into breakouts and breakdowns.. for BTC, back in July 2021 an Expanding Triangle emerged on the proportional range chart and then it took off to 60k. Currently, as of this morning, an Expanding Triangle just completed on BTCs proportional range chart... just something to think about, that's all I am saying. I am not saying it will breakout today because of this lol... but the setup for such a breakout is in the works (i.e. corrective cycle nearing the end).
Best to All

Wolfe Wave - one more down before upI'm looking at a possible Wolfe Wave pattern. I have entered a short position at $31.500 with a target of mid 27k levels.
If this indeed follows the Wolfe Wave, I'm looking to buy below 27-25k levels for a move up to 35-37k.
For educational purposes. Always do your own research.

Bitcoin, Determined to Test Low $20Ks | Digital Surf TradingAfter finishing a time-killing move within its recent Expanded Flat formation, Bitcoin has now entered what seems to be an Extended Diagonal/Wedge/Wyckoff/Wolfe Wave pattern down to the lows between $21K-$25K.
The internal Wolfe Wave in the pending Wave 5 is not shown on this chart however waves have confirmed that this is already in motion (the DSTC will deliver updates on this internal action).
The pending fractal will not allow for new entries to remain profitable for too much time as the waves are due to overlap in volatile fashion. For traders who are determined to jump in on the waves, its best to get in and get out relatively quick. An even better idea would be to use the near real-time analysis which I'll be sharing within the DSTC.
As for macro moves, this should be the main takeaway, "Bitcoin has not bottomed out until it reaches the levels of $21-$25K.
Lastly, Wyckoff and Wolfe Waves are both knockoffs as the great Ralph Nelson Elliott first outlined this concept :)
