STMXUSDT profits from 80% to 100% This is my idea,, and analysis about STMX.
There so no confirmation to inter until now , but we need to see divergence + also RSI above 45 with strong movement up , if the price go down this is will be good to buy from the bottom, don’t Rush to buy , wait from confirmation from other indicators that your using always .
Keep your eye on it , there is no signal to buy now , but soon will be.
This is my first analysis here i hope you like it and good luck.
I will update it later if i saw some interesting people and followers.
Wolfe Wave

EUR/USD parity is possible in the next 30 daysEUR/USD parity is possible in the next 30 days. When EURUSD reaches the price of 1.06 during the week, the target of EURUSD will be the price of 1.00. (parity)

XAU/USD $$$
XAU is strongly bullish in all TF. the zones that i specified is valid just take LTF CONFIRMATION IN IT
FOLLOW FOR MORE DAILY ANALYSIS

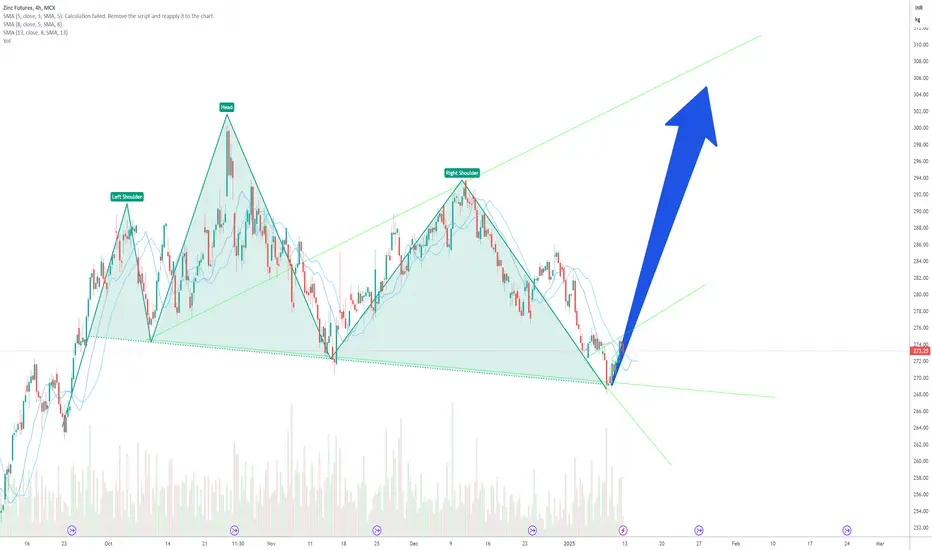
Zinc is 80-90% likely to reach $300 by the end of January.Zinc is 80-90% likely to reach $300 by the end of January.
Tata Power has possibility to correct till 300Tata Power has formed "Bearish Wolfe wave - Three drive pattern"
This has potential to bring down tata power to following targets.
360 - 335 - 300

Bullish Wolfe .. Low risk, nice areaHi,
As you can see, we are finishing a Wolfe wave pattern to be up-trend soon inshallah
I don't think it will breakdown 30,
Have a nice trading :)

es1! retests 5kes1! appears poised for a larger move down, based on the smaller timeframe count .
this leads me to believe that es1! has entered a larger fourth wave. historically, these waves take an average of 2 months to play out and typically result in a 12% decrease from the high before completing.
wave 4's often retrace back into the territory of the prior degree's wave 4, and i expect this one to follow suit.
pay attention to the green trendline i've drawn on the chart,,, it serves as a solid guide for where i anticipate es1! to find a bottom. dipping below the trendline is acceptable, provided we don't see any weekly candle closes beneath it. even if a weekly candle does close below, a strong recovery the following week, such as a gap-up scenario , could invalidate the breakdown.
there’s not much else to add here, as the chart is fairly straightforward. keep an eye on the trendline and monitor weekly closes for confirmation.
💸

Bullish Wolfe Wave on XRXWave Structure: The chart displays a 5-point structure typical of a Wolfe Wave:
Points 1, 2, 3, 4, and 5 align with the criteria for the pattern.
The line connecting points 1 and 4 represents the Potential Target Line (PTL), which forecasts the future price target.
Point 5 is crucial as it marks a potential reversal area, signaling a buy opportunity in bullish Wolfe Waves.
Key Levels:
Support: The price near the 5th point aligns with strong support within the trend channel.
Resistance: Key resistance zones are observed near $12.99 and $22.50, acting as medium- and long-term targets.
Indicators:
RSI (shown below the price chart) suggest divergence, where momentum weakens on a downtrend, indicating a potential reversal.
The green EMA200 represents dynamic resistance, and a break above it could confirm the bullish reversal.
Trade Idea
Entry Point: Near the current price of $9.17, where Point 5 of the Wolfe Wave is forming. This area serves as the optimal entry zone for a potential long trade.
Profit Targets:
First Target: $12.99 (intermediate resistance).
Second Target: $22.50 (aligned with the Wolfe Wave's PTL).
Stop Loss: Place the stop below the low of Point 5 (approximately $7.50) to limit downside risk.
Risk-Reward Ratio: Aiming for a ratio of at least 3:1, with upside potential significantly outweighing the downside.
Scenario Validation
If the price breaks above the moving average and sustains, it confirms the Wolfe Wave setup.
Failure to hold support near Point 5 invalidates the pattern, triggering the stop-loss level.

If in the next 2-3 days we go to the 1.05 area according EURUSDIf in the next 2-3 days we go to the 1.05 area according to EURUSD, then with a 90% probability we will then adjust to 1.035 according to Wolfe waves.

2060 last bottom? As you can see we seem in last words before go uptrend start when we hit and breakout Top2 and stay above it to hit all targets above inshallah!

$Wolf #landwolf on $avaxWolf as well as Avax and most other projects on the Avax chain/ecosystem continue to look strong and show resilience.
IMO NYSE:WOLF is still an easy 3-5x play this cycle and without much hopium is an 8-12x
based on mkt. cap and how well i think Avax does this cycle this could end up being a MUCH BIGGER play then anything I've said so far in this post.
IF we get a retrace back to the box marker below, I'll be buying again and anything lower than that is a GIFT IMO.
I look at this as a leverage play on Avax which i expect to still have a LOT of upward targets left to hit by the end of this cycle.

Bullish Wolfe-Wave pattern Alternative Currencies (others)Hi,
I'm BoSary and this what I see clearly for next move,,
Green lines mean targets 🎯
but now it reached strong Fibo resistance levels for last down trend, so we have to breakout these levels or maybe there a new small down trend

In the 4-hour periodIn the 4-hour period, it will most likely hit its previous ceiling
BITFINEX:SHIBBTC BINANCE:SHIBUSDT

$WOLF on Solana UpdateABC Pattern reversal could form with the upswing movement of BTC. Wolf on Solana is a meme token that has gained traction from being the third installment character from Matt Furie's famous Boy's Club series that already features CRYPTOCAP:PEPE and $BRETT; both characters have respectfully achieved market cap evaluations over $1 billion on their respected blockchains. It seems as if NYSE:WOLF is striving to achieve the same. The token recently took a massive retracement in search of a floor and it looks like the core supporters have been found. I expect a lot of momentum from this project and team moving forward as they continue to push the narrative with their aggressive marketing into this crypto bull run.

61200-61700 before a dump to double bottomEverything is on chart but it seem we progressing this 4HR bearish wave nicely. Upper channel sits at 61200-61700 range.
Monday is no major event day, Wednesday is D DAY (interest decision) - I don’t think major change in price or direction before decision - move will likely come after the news

Bullish Wolfe wave As you can see We've a bullish Wolfe Wave pattern that's nearly complete, and it looks like we're about to see an upward move.

GOLD: Bearish: WOLFE Wave detected + DivergencesGOLD: Bearish: WOLFE Wave detected + Divergences
The Wolf of Zurich has detected a Wolfe Wave on the XAUUSD.
The price could reach 242 then 2291
In addition, there are two divergences with the price: The ROC Rate of Change and the RSI.
To watch the exponential moving averages 50 and 20, as well as the Fibonacci levels
We have reached the price of 2520 that I will indicate
The maximum can be 3000. So be careful!!

Bullish Wolfe Wave for BTCHi,
I'm BoSary and I do wolfe waves and fractal analyses ,,
So as You can see we have clear Wolfe targets with 🟢 lines and above we may be attention to blue Targets 🔵
Thanks
I also will publish (Others) chart ,, (alternative currencies)

ZCASH - A Sleeping Giant or A Ghost Coin?Zcash has recently formed an all time low. But the reaction it made from there was perfect so far.
A bullish wolfe wave seems to be formed on the all time chart. With setting the recent all time low as a stoploss; the sky is the limit.

CrowdStrike (CRWD) ... Short term top??CrowdStrike (CRWD) Based on an overall softer overall broad market and/or increased threat of lawsuits could make shorting CRWD a winner.
This is short term play. (30m) based on a short term Wolfe Wave setup.
Ideally the area to sell/short would be a failure around $259 area. and momentum rolls over.
This is not investment advice.
Do your own due diligence and research and be nimble.
S.

$WOLF on SolanaA simple chart layout of $WOLFS on MEXC
$ WOLF on Solana. Although this is a newer token I still believe that it has much more room to grow. The potential stems from the boy's club narrative, if you're not familiar with it already, it entails the characters designed by Matt Furie. There's Pepe who had an amazing launch and quickly became the new rising star in the meme coin space due to the already-known meme culture that surrounds him; but there's also Brett, Andy, & Landwolf. When Brett was launched on base, it had a similar explosion to Pepe and almost grew just as rapidly to a $1 Billion market cap. Since no other Landwolf coin has reached this fate yet, it very may be time that one does. I feel like this WOLF token is lightyears ahead of the rest and expect it to flip them very soon.

4HR Wave Breaking DownSorry I am traveling so don’t have access to laptop to get better chart, let’s do this from phone
This is continuing our last “delusional bulls” idea - finally the 4HR wave broke down - target remain under 55k - that’s deep and sound impossible but this is 3rd time this wave pulled the price down and broke
See how the price never stayed above the upper channel for long, strong sign of weakness on upside.
Let’s continue to short all the way to 65k and keep stop at 71k - under 65k idea is to hold shorts but refrain for adding new shorts as the swing move can be strong if the idea was to go in trash for some reason

Delusional Bulls will say 100k coming, I will say good luckDelusional Bulls Will Say 100k Coming, I Will Say Good Luck
As we step into another week in the crypto market, it's essential to remain grounded and analytical, rather than getting swept up in the bullish hype. Over the weekend, we've seen a perfect bearish Wolfe Wave pattern emerging, and this is something that savvy traders should pay close attention to.
The Bearish Wolfe Wave Pattern
A Wolfe Wave pattern is a naturally occurring trading pattern that can predict either a bullish or bearish trend. The pattern we're currently seeing is a bearish Wolfe Wave, indicating potential downside ahead. This pattern is characterized by five points, and crucially, Point 5 has just formed.
Lack of Volume and the Trump Rally
One of the critical indicators of a market's strength or weakness is volume. Over the weekend, the market reacted to the news of a Trump rally, but this reaction came with notably low trading volume. This lack of volume indicates that the upward price movements are not supported by strong buying interest.
Critical Levels to Watch: 63500-63800
For those who are still bullish, there's a key level to keep an eye on: the 63500-63800 range. Unless Bitcoin can break and sustain above this range, the bearish Wolfe Wave pattern suggests we are likely to retest the lower 50000 range before any further upside can be considered.
Conclusion
While some may remain delusionally bullish, expecting Bitcoin to hit 100k soon, it's crucial to approach the market with caution and a clear head. The bearish Wolfe Wave pattern, combined with the lack of volume and recent price action, suggests that we should be prepared for a potential downside retest. Unless we see a significant breakout above the 63500-63800 range, the path ahead looks bearish, and a retest of the lower 50000 range seems likely. Stay vigilant and trade wisely.
Disclaimer: Always do your own research before making any trading decisions.
