Wolfe Wave

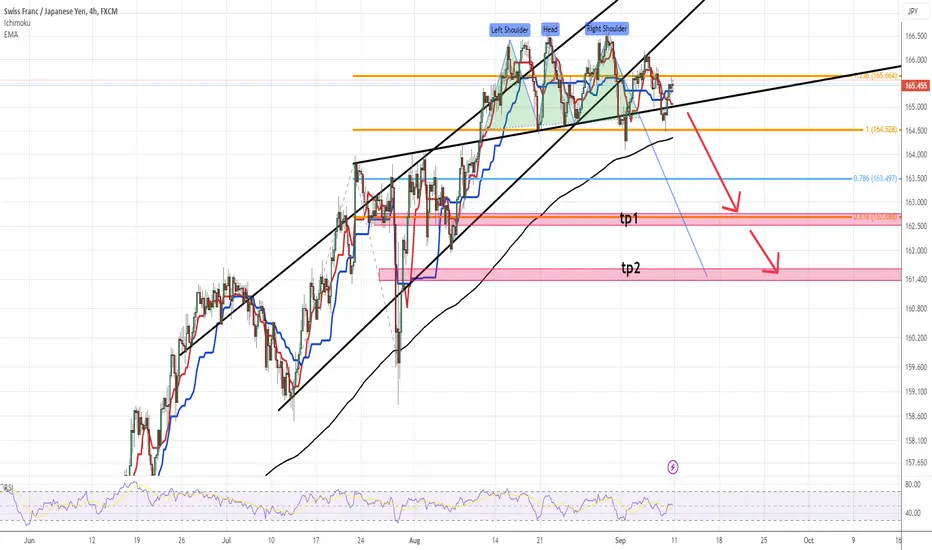
chfjpy udpateThe CHF/JPY is a major cross-currency pair and is most widely traded during the Asian and European sessions. With the Swiss economic and political environment considered stable, demand for the Swissie spikes during periods of geopolitical and economic uncertainty in Japan and beyond. The pair closely follows the EURJPY pairing. While a liquid paring, total transactions account for less than 2% of total transactions across the FX market.
Japan Switzerland
Interest Rate -0.10% 1.75%
23-Aug 23-Aug
Inflation Rate 3.30% 1.60%
23-Jul 23-Aug
Credit Ratings MOODY'S S&P MOODY'S S&P
A1Stable A+Stable AaaStable AAAStable
sp500 update:the Quasimodo patterntechnical view:the Quasimodo pattern formed as targets of this pattern are depicted on the chart
fundamental view: Given the current economic landscape, mixed signals from major corporations, the looming rate hike uncertainty, and the escalating U.S.-China tech feud, markets are poised for heightened volatility. The overall sentiment leans bearish, with investors advised to exercise caution and closely monitor forthcoming data releases, particularly those that could influence the Federal Reserve’s decisions.

usoil update
Brent futures and WTI crude surge, echoing OPEC’s bullish demand outlook and tighter global oil inventory projections.
Tightening supply concerns remain at the forefront of the oil price surge. Libya, an OPEC member, recently closed four eastern oil export terminals due to a severe storm. Additionally, Saudi Arabia and Russia have extended their voluntary supply cuts until the end of the year, further limiting the market supply. Russia expects its oil production to decline by 1.5% this year, as per statements from Energy Minister Nikolai Shulginov.
concerns about weaker demand, especially from China, are tempering further gains. OPEC remains optimistic about global oil demand growth for the coming years, downplaying macroeconomic challenges like high interest rates and inflation. Market participants are also keenly awaiting U.S. inflation data, specifically watching for cues that could influence the Federal Reserve’s interest rate decisions.
Considering the supply restrictions, bullish demand outlook, and recent inventory data, the short-term forecast for oil prices leans bullish. However, broader macroeconomic factors, especially regarding China’s demand and U.S. economic data, may introduce volatility.
Presently, the price is near the main resistance zone of 90.10 to 93.74 and comfortably above the main support zone of 84.89 to 83.81. With these indicators, the market sentiment for Light Crude Oil Futures leans bullish, but caution is advised due to the overbought RSI reading.

VIX: “BUTTERFLY” was detected in (H4)-A bullish harmonic pattern “BUTTERFLY” was detected in (H4)
-On the downside, 11.82 should be watched.
-But the probabilities are stronger on the rise.
-The ECB’s speech will perhaps “change the situation”.
-Don't forget that Volatility lives up to its name VERY well!
-Be careful and “stay covered!” » ;-)

gold updateAmid China’s promising economic data, XAU/USD spot values surged, though gold faces challenges with rising global rates.
-----Highlights
Gold prices rise as dollar weakens against the yuan, fueled by strong Chinese economic data.
Potential U.S. rate hikes cast a shadow, making investors wary despite positive signs.
Robust U.S. economic data may delay anticipated rate cuts, with hikes more likely.
Gold (XAU/USD) prices experienced a surge as Friday saw the dollar declining against the yuan, following encouraging economic figures from China. The latter ignited hopes of economic rejuvenation in the premier gold consumer. Nevertheless, the looming potential of more interest rate hikes in the U.S. has left investors cautious.

DAX: Bearish BUTTERFLY DAX: Bearish BUTTERFLY - Beyond the technical aspect, we can see that the DAX will spark a huge bullish rally following Madame Lagarde's interest rate hike announcement. As far as I remember, interest rate increases rarely increase 1% at the same time. Today's excuses for "buying rising rates" include: “We buy because we feel the upward cycle is over, and this makes stakeholders happy.”
But no one brings up the fact that we didn't expect this raise. Because we had the same feeling at the previous ECB meeting - that there would be no more rate hikes - and today we share the same story and everyone believes it. There is something rotten in the merchant kingdom, and if they realize it, the sanctions will be terrible.

wti updare :wolfe wave and dip-down confluence Despite major crude oil supply cuts, U.S. dollar resurgence and China’s recovery fears curtailed bullish trends.
Short-term Forecast
While the extended supply cuts and the recent U.S. inventory draw provide some bullish sentiments, the evolving economic landscape, especially in China, and possible Russian export boosts due to seasonal refinery maintenance, present a mixed short-term outlook. It remains cautiously bearish until clear signs of sustained global demand emerge.
Price-wise, it’s nestled above the main support zone (from $84.89 to $83.81) and is edging towards the primary resistance area (from $88.68 to $90.10). Based on the data, the market sentiment for Light Crude Oil Futures on the 4-hour chart is predominantly bullish.


WOLF Wolfspeed Options Ahead of EarningsAnalyzing the options chain and the chart patterns of WOLF Wolfspeed prior to the earnings report this week,
I would consider purchasing the 45usd strike price Puts with
an expiration date of 2023-11-17,
for a premium of approximately $3.05.
If these options prove to be profitable prior to the earnings release, I would sell at least half of them.
Looking forward to read your opinion about it.

ADANI ENTERPRISES - NSE INDIAN STOCKAdani crashed close to 80 % from its peak before it bounce. 1st bounce is impulsive, which generally considered as fake bounce. The geniality of the bounce will will be tested with series of whipsaw movements which we are presently witnessing in this script.
Also in this script we have seen GAP's. GAPS are generally get filled but not necessary, confirmation GAPS take long time to get filled, some time it doesn't fill also. NOTE - A fundamentally robust company GAP's get filled but not all GAP's.
This script is very interesting. one observation is for sure that, after 1st bounce it will come down, Here in this case also, after 1st bounce expecting to comes down and the down target is around 1600 levels.

CRUDE OIL - Continuation.Expecting crude to go short below, down side swing #1, once it breaks then the fall is impulsive.

CRUDEOILCrude Oil is just started downside. expecting to start moving down below swing#1. If it starts moving down below 1, then it will start moving impulsively.

CrudeOilCrude Oil is just started downside. expecting to start moving down below swing#1. If it starts moving down below 1, then it will start moving implusively.

CRUDE OILCRUDE OIL expecting to go down from here. Wolfe wave is going get triggered around this levels and is going to go down impulsive to touch around 78 levels.

WOLFEWAVE FORMATION IN CRUDECrude created wolfe-wave formation, expecting to touch 78 and the after confirmation, the fall is real impulsive!

The nearest target is $52.If we hold the level of 33, a short-term growth of $ 52 is possible. If we go higher, we can reach $70. Perhaps we are working out the Wyckoff method.

SBINSBIN
This is 2hr chart of SBIN...
Negative WW pattern developed in it ...
As long as price stays below red line...
it would be looking to touch blue and black lines respectively
Just a View!!
Vedang :)
Chart is for study purpose only!!

Gold Idea....
AronnoFX will not accept any liability for loss or damage as a result of
reliance on the information contained within this channel including
data, quotes, charts and buy/sell signals.
If you like this idea, do not forget to support with a like and follow.
Traders, if you like this idea or have your own opinion about it,
write in the comments. I will be glad.


Wolfe Pattern + AB=CD Reversal ZoneTaking note of a few items on the ETH/BTC chart.
After the SEC Binance and Coinbase legal complaint there has been a noticeable drop of in ETH/BTC's performance. This deviation from the trendline might mark a shift in the trajectory for eth for a while. OR, it was a fake-out, and can be seen as such.
On a higher timeframe the chart has been correcting. If elliott waves can be counted, perhaps this is near the end of a corrective wave 2.
There are noticeable pivots to identify a rather clean 0.618 AB = CD.
I've also indicated the path/plan for a wolfe pattern trade setup.
Worst case scenario might result in eth revisiting lows near 0.04 BTC, to complete a higher time frame Gartley pattern.

Nifty forming wolfe wave Nifty mafe wolfewave and it might give a fake out to trap buyers. 19103 is crucial level as per harmonic also. lets see how to react . Traget is very deep .

DXY to crash soon?Please read entire description!
Bearish Wolfe waves forming inside an ascending wedge on the daily timeframe charts of the dollar currency index.
We have entered the monthly resistance band of the ascending parallel channel on the monthly charts and we have reached the top of a channel that we have been trading inside on the daily chart. We are approaching the top formed right before the "dotcom" bubble burst causing all markets to crash (late 90's - early 00's) as well.
I think a decent correction is overdue especially with The Federal Reserve hiking interest rates steadily and with CPI (and inflation rates) reaching high numbers that haven't been seen for over 40 years.
I don't think is it really possible to pinpoint the top for this run but we are certainly getting closer imo.
We could start the downtrend from the top of the daily channel, monthly channel, or reach all the way to the top of the dotcom crash (which relatively isn't too far away).
--
Monthly chart channel (resistance band marked in red):
Daily chart channel:
The bigger picture (daily support levels marked in teal):
--
Thoughts and opinions appreciated.
