Decoding Wedge PatternsThere is a strong bias about chart patterns and their interpretation in the technical analysis space. It is a very common belief that a rising wedge forms bearish sentiment and a falling wedge forms bullish sentiment. Is that really true and how much we can rely on such bias?
In order to understand this, we need to dig a little bit about how such concepts could have come into the picture. The best I could get on the internet is an article from Investopedia that explains few technical reasons and constraints of using these patterns.
Through the Lens of Diagonal Waves
But, when I was studying the concepts of waves, this is what I found from one of the sources I referred to about diagonal waves:
ewtaf.com
Details are summarised and explained in the below diagram
The summary here is, Diagonal waves of contracting types are the same as that of Contracting Wedge patterns. And the diagonal waves of Expanding types represent expanding wedge chart patterns.
Diagonal Waves can appear as sub-waves in multiple parts of the entire Elliott Wave. And here are our scenarios
Leading Diagonals
Leading diagonals are diagonal waves that can appear towards the start of a trend. This can be
Wave 1 of an Impulse Wave - This is the start of a new trend. Avoid trading these wedges as they can be short pullbacks. Or better look for pullback and trading opportunities in the direction of the wedge.
Wave A of a Zigzag Wave - This can lead to a possible bull trap or bear trap. The corrective wave is likely to continue after a small pullback
Ending Diagonals
Both expanding and contracting types can be ending diagonals. Can appear as
Wave 5 of an Impulse Wave - Meaning the trend is coming towards possible exhaustion.
Wave C of zigzag or flat - Correction or pullback is coming to an end and the trend is likely to continue
Wolfe Wave
Wolfe wave is a rule built on top of wedge patterns to identify time-bound targets. The idea of generating targets and stops based on the Wolfe Wave is as shown below:
Further, here are a few indicators developed in Pinescript that can help do them automatically.
Wolfe Scanner
Wolfe Strategy
Takeaways
Here are a few things we learnt from our study.
When you are looking for wedge patterns on the chart, look for wedge formations created by 5 pivots. You can learn more about this from this post Fitting Patterns To Your Bias?
Before trading a wedge pattern, try to identify if the pattern fits in a bigger scheme of things. Check if they are towards the end/start of a trend or pullback
Concepts such as Wolfe Wave can help setup rules for trading wedge patterns for pullbacks.
Wolfe Wave

EUR/USD Short London Session - May 15th '23Trade setup on EUR/USD. Price filled the H1 Imbalance / Supply and confirmed our trade by breaking the short term structure with an engulfing candle. Holding the trade until the low of the structure. Good Luck traders

UNG 1D wolfe wave bullish 5/11UNG 1D wolfe wave bullish 5/11
UNG 1D wolfe wave bullish 5/11
UNG 1D wolfe wave bullish 5/11
UNG 1D wolfe wave bullish 5/11

QGM2023 1D wolfe wave bullish 5/11QGM2023 1D wolfe wave bullish 5/11
QGM2023 1D wolfe wave bullish 5/11
QGM2023 1D wolfe wave bullish 5/11
QGM2023 1D wolfe wave bullish 5/11

NGM2023 1D wolfe wave bullish 5/11NGM2023 1D wolfe wave bullish 5/11
NGM2023 1D wolfe wave bullish 5/11
NGM2023 1D wolfe wave bullish 5/11
NGM2023 1D wolfe wave bullish 5/11

gbpnzd updateit seems that corrective waves are unfolding as ABCDE in which each minor wave inside this expanding triangle is in ABC format .you can see on the chart .please share your comments and like if u re interested .tnx

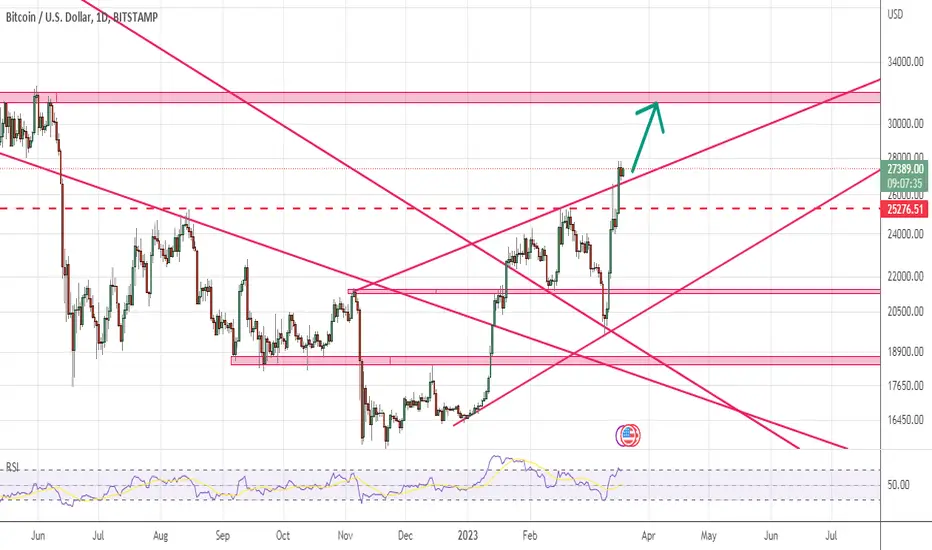
bitcoin updatebreaking trendline indicating upward move continuation.we are predicting reaching to 31500 .after that we will update our analysis .
gold updategold is seeking another low to reach relevant fibo levels and complete pattern of wolfe wave and then starts for another rally
please see my previous analysis as below
please share your comments if you are interested .

eurnzd updatethe pair broke down trandeline on daily timeframe .we are waiting for short setup to enter .a good opportunity to be considered .please comment if you like


Bearish Wolfe WaveExpecting distribution around the 398-401 level through the FOMC and then begin drop Thursday.
Downside target is 375 by March 31st.


Bullish Wolf Wave PatternFormation:-First let market go below 17171, And revert back above 17200.
Go Long for minimum 500points.

STC create Wolfe Wave Stop loss and targets are in the chart,
DYOR, this is not a financial advice,
Good luck..

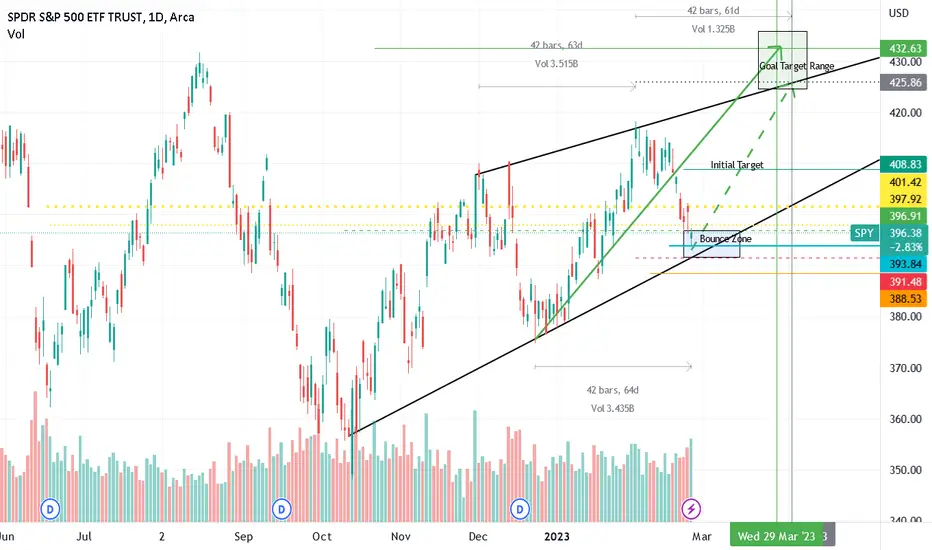
Its More Straight-Forward Than You ThinkThis is an Update to my previous SPY idea - same target/time to target, just more simplified. After the last 2 weeks there is a lot of bearish sentiment but its really just finding support at wave 4 of a leading diagonal.
The initial target is 408 in the next week or 2, and then goal target is 425-432 by late March-Early April.
The symmetry in the waves indicates this is a leading diagonal (or bearish wolfe wave that is about to complete the final wave). Either way its still bullish near-term. After 425-432 there will be significant downside risk, but for now expect a nice rally through March.
We are in the bounce zone, there is still risk to 388-391 early this week, but if any of the following occur we won't see the 388-391:
- retest and hold 393
- close above 397.92
- Intraday breach of 401.42 (above 401.42 it will turn into explosive upside)
TUSDT ScalpingStop loss and targets are in the chart,
DYOR, this is not a financial advice,
Good luck..

wti updateonce again head and shoulder setup came to my mind and drew new neckline .
we are waiting for price and know how it will treat with neckline (red line) and also its above trend line as depicted on the chart with a purple rectangle .
upon breaking or not we will have different bearish or bullish scenario
please share your comments and or anything about this analysis .
please see my previous bullish and bearish analysis :

theoretical path of dodgecoindodge coin theoretical path is shown on the chart .we have drawn this path based on elliot wave and wolfe wave .please see my previous analysis as below and share your comments if you have any idea

cadchf updateloonie is in a downtrend against CHF for a long time and now the pair is in a rectangle and consolidate inside from 2016 and it may be broken downward . keep an eye on the pair in lower time frame for breakout .
weekly timeframe :


TCSTCS CMP 3520
chart speaks for itself ...
staying below red line,
Price can move towards blue line...
Just my small view!!
Vedang :)

dji updateOn February 7, traders focused on Fed Chair Powell’s comments on the monetary policy at The Economic Club of Washington.
Powell noted that the disinflationary process had begun, but there was a long way to go before Fed’s inflation target would be reached. Importantly, Powell stated that Fed would not change its 2% inflation target, which remained the global standard.
According to Powell, the road to the 2% inflation will be bumpy. The recent job market data was much stronger than expected, and the Fed must continue to raise rates to reach a sufficiently restrictive level. Powell also noted that he expected significant progress in the fight against inflation.
Speaking about the potential for a rate cut in 2023, Powell said that Fed’s decisions would depend on economic data. The Fed continues to reduce the size of the balance sheet and has no target for this reduction. As in the case of interest rates, the decision to stop the reduction of the size of Fed’s balance sheet would be data-dependent.
previous analysis :
