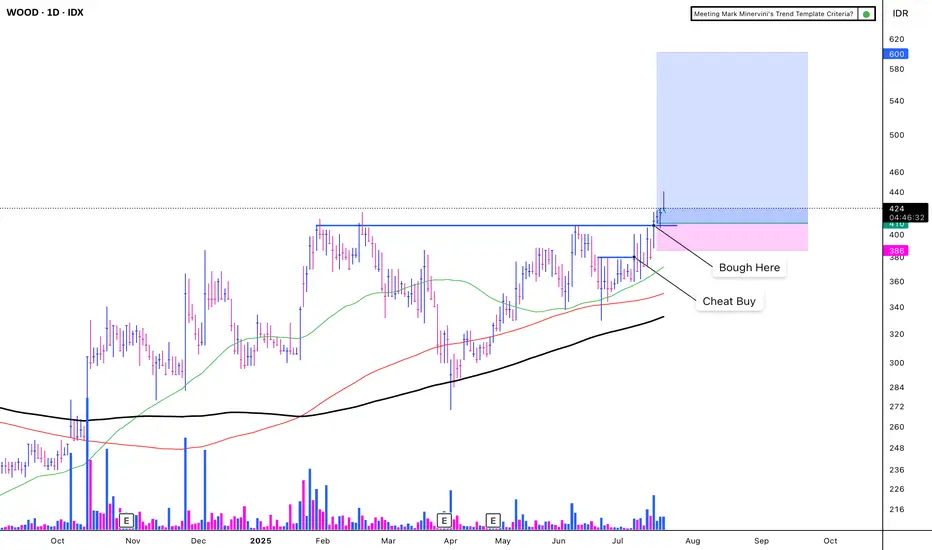
WOOD - CUP WITH HANDLEIDX:WOOD - CUP WITH HANDLE
(+):
1. Low risk entry point
2. Volume dries up.
3. Price has been above the MA 50 for over 10 weeks, with values exceeding 150, 200, and 300.
4. Price is within 25% of its 52-week high.
5. Price is over 30% of its 52-week low.
6. The 200-day MA has been trending upwards for over a month.
7. The RS Rating is above 70 (85).
8. Carbon sales increase 503%
9. Price breakout with VCP criteria
EPS Growth:
a. Quarterly QoQ: -13.24%.
b. Quarterly YoY: +68.81%.
c. TTM YoY: +49.09%.
d. Annual YoY: +33.27%.
(-)
Trump Implements a 32% Increase in Tariffs on Indonesia
The market is volatile due to the ongoing war
WOOD
#WOO/USDT#WOO
The price is moving within a descending channel on the 1-hour frame, adhering well to it, and is heading for a strong breakout and retest.
We are seeing a bounce from the lower boundary of the descending channel, which is support at 0.0870.
We have a downtrend on the RSI indicator that is about to be broken and retested, supporting the upward trend.
We are looking for stability above the 100 moving average.
Entry price: 0.0880
First target: 0.0892
Second target: 0.0905
Third target: 0.0922

#WOO/USDT#WOO
The price has broken the descending channel on the 12-hour frame upwards and is expected to continue
We have a trend to stabilize above the moving average 100 again
We have an upward trend on the RSI indicator that supports the rise by breaking it upwards
We have a support area at the lower limit of the channel at a price of 0.1350
Entry price 0.1700
First target 0.1870
Second target 0.2324
Third target 0.2746

LOEWS, ARE WE ABOUT TO SEE A LIMBO WORLD RECORD? (EARNINGS)And do you want to buy the dip
These trends are not looking good.
if earnings can't get over 74 and maintain good momentum, it's going to get pushed down to the support trends. Which are quite strong overall.
The downside is huge.
But it's not like there isn't upside.
I'm just not certain the upside to 80 will occur sooner rather than later.
Personally, I see a bearish looking stock, but I'm also not as confident as I sometimes am because there is a possibility it holds support at 69 and really starts to move.
However, I'm fairly certain we'll see $20 at some point within the next year or two. IMO, sooner.
Attaching CAT and APD

#WOO/USDT#WOO/USDT
The price is moving in a head and shoulders pattern from February 2022
We are now at the right shoulder of the model
As well as another bearish triangle pattern that is about to break
Current price 0.2838
The first goal is 0.3542
The second goal is 0.4291
The third goal is 0.5012
Which represents 190% of the current price
Down triangle

ARK: $22 | Cathy getting CAPITULATION 101 lessosif youre an up an coming FundManager that made it Big in the Industry
maybe keep quiet as the Big Bear may teach you a lesson by SHORTiNG your Picks
Discrediting Cathy week after week ..
towards CAPITULATION
==
note:
when a price of a STOCK PUMPS to 4x & 8x (+800%) from it's recent base (eye on Volume Spike)
that's discounting the 5-8year price ...
smart money sells and move on to the next CIRCUS
easier said than done

$ARKK: Another Dip Through 40I'm curious if in the short term ARKK may underperform at the 40 handle. I believe some growth names like DASH, DOCU and SNOW may have gotten ahead of themselves and are worthy of another pullback at least for now..best of luck traders

19/06/2023 Weekly Idea SOXL/WOODWeekly idea of this week is to long SOXL, short WOOD.
With Apple's announcement of vision pro in early June, I expect a rise in demand of semiconductors in the supply chain (and also in upstream industries such as metal mining/battery making). WOOD is least correlated to the upstream industries while also reported being shrinking in the latest ISM report.
Price spread is currently 0.34. We would stop loss at 10% (ie 0.31) and looking for soft 30% profit target at 0.447 (which was in Mar 2022).

DBM is a buy under $6TSX:DBM pays a quarterly dividend of 0.14, which is 9.3% yield.
It has fallen back to its September 2021 low, after retracing 50% of its bearish leg.
It has heavy support (14 weeks worth) at $5.81
Could it fall further than that? Sure, anything can happen.
But I think it is unlikely in the next week, as the ex-dividend date is the end of this week.
Perhaps the dividend will be the catalyst to push it lower.
I will probably accumulate a position if I can get it sub-$6 on Monday or Tuesday.

What is Lumber Signalling?Lumber has been decimated over the last 3 weeks.
With housing data coming out tomorrow along with PCE. Is this weak lumber chart signaling a continuation of yield strength moving up?
Does the market interpret the housing data as negative?
One thing is for sure interest rates should make a move tomorrow off of the data sets.

Lumber & Stocks DivergeLumber is signalling disinflation.
Stocks are signaling inflation.
There has bee a high correlation with stocks and lumber for about 18 months. Is this correlation officially breaking or does it imply we will see some weakness in stocks?
Right now lumber is showing weakness.

Is lumber Spiking?This Lumber Weekly chart clearly shows the unique parallell range that confirmed a breakdown.
Now to determine what likely happens next we wait to see if we get a close above or below the weekly key channel Resistance line.
If rates remain soft we will likely get a continuation move to the upside.

ROKU, a descending triangle for breakout, LONGNASDAQ:ROKU
As seen on the daily chart, ROKU is in a brief uptrend within a descending triangle. Oscillating indicators show the MACD with
the K and D lines crossing underneath the histogram and the RSI candles big and bullish with rising strength towards crossing through
the Ichimoku cloud. I see this as price action consolidating towards a breakout with 30-40% upside in the intermediate term.
Accordingly, a decent long swing setup or a call options contract. Cathie Wood seems to agree.

WOO Network (WOO) formed bullish Cypher for upto 12% pumpHi dear friends, hope you are well and welcome to the new update on WOO Network (WOO) with US Dollar pair.
On a 4-hr frame, WOO has formed a bullish Cypher pattern.
Note: Above idea is for educational purpose only. It is advised to diversify and strictly follow the stop loss, and don't get stuck with trade.

WOO NetworkWOO/USDT look at this coin what do you think it will Follow trend like Last support downdraw we are looking to make retest on Support updraw and buy it
Disclamer:
We are not financial advisors. The content that we share on this website are for educational purposes and are our own personal opinions

WOO NetworkWOO/USDT we have 15min Supply Zone waiting for retest on Suply zone and we will SELL IT
Disclamer:
We are not financial advisors. The content that we share on this website are for educational purposes and are our own personal opinions.

#WOO/USDT 3HOUR UPDATE BY CRYPTOSANDERS Welcome to this quick WOO/USDT analysis.
I have tried my best to bring the best possible outcome in this chart.
Reason for trade:-WOO/USDT symmetrical triangle pattern conforms and break the upper trend line and retest buy the green zone.
Entry:-$0.20,$0.22
Traget:- 50%
Stoploss:- $0.19
with laverage 5x to 10x
Remember:-This is not a piece of financial advice. All investment made by me is at my own risk and I am held responsible for my own profit and losses. So, do your own research before investing in this trade.
Sorry for my English it is not my native language.
Do hit the like button if you like it and share your charts in the comments section.
Thank you...

#WOO/USDT 1HOUR UPDATE BY CRYPTOSANDERS Hello community members welcome to WOO/USDT 1hr chart analysis by CRYPTOSANDERS
I have tried my best to bring the best possible outcome to this chart.
As we can see from the above-mentioned chart that WOO/USDT broke the triangle pattern and retested well.
According to the current scenario, it can move up by almost 20% from the green zone which is also a support zone.
So, here we can take a long position for some short-term profit gains.
Entry:- $0.4757,$0.4863
Traget:- 20%
Stoploss:- $0.4590
Remember:-This is not a piece of financial advice. All investment made by me is at my own risk and I am held responsible for my own profit and losses. So, do your own research before investing in this trade.
Happy trading.
Sorry for my English it is not my native language.
Do hit the like button if you like it and share your charts in the comments section.
Thank you...


Leader of the wood industry $UFPI is giving bullish signsUFP Industries, which makes lumber and other building products has 216 locations in eight countries making wood and wood-alternative products for retail, construction and industrial customers.
After making an ATH at $94 in January, has formed a good cup & handle pattern with a pivot buy above $88.10. The handle shows a good volatility contraction as it has low volume. This is a very good sign and could help the price to have an explosive move up. Also the MACD is been trending up since mid February.
In IBD, NASDAQ:UFPI ranks No. 1 in its building-wood group, with a 89 Relative Strength rating. As you can see above the chart, while the AMEX:SPY has been trending down while NASDAQ:UFPI is making higher lows.
With lumber prices in an uptrend, this leader could give a really good bull run.

$PLTR: Have we finally found our inflection point? (Do or Die)ARKK making a strong name for itself after the Jackson Hole meeting. Are we nearing the breakout point or will we continue to see more waiting and what will ultimately happen with the ARKK index at this juncture? We will see! Good luck traders :)

$ARKK: Cathie vs Burry, Which Side Will You Choose?The 120 level on ARKK continues to act as a very prominent level. What would you do?
ARKK 120 features a prominent low volume node and now we have a chance to meet this level with the falling trendline that starts from the Feb high to the June 2021 lower high. Together these forces will meet and ultimately decision in the coming weeks. I'll let time tell me which way I'll play this one but will the Russell 2000 be a canary in the coal mine or will it successfully squeeze bears like it's been known to do. You may also look to the Fed and forex markets to see how the dollars role may play apart. Good luck traders!

#BTCUPDATE - 22.7.21 B-Word Was Bullish
Looks like some much needed bullish news came and really delivered and at a critical point too. The B-Word went well, as in it didn't sink the market further. Short of Jack Dorsey confirming accepting Crypto payments on Twitter.
We hit the $32.2k resistance and as predicted in the channel we saw a rejection there - ideally we want to get back above $32k to continue on to the next leg up. Long term it looks like a descending wedge and hopefully with a little further push we can see a big break out come.
My play with BTC is I am quite bullish and will wait to get above $32.2k and then long to $36k region.
