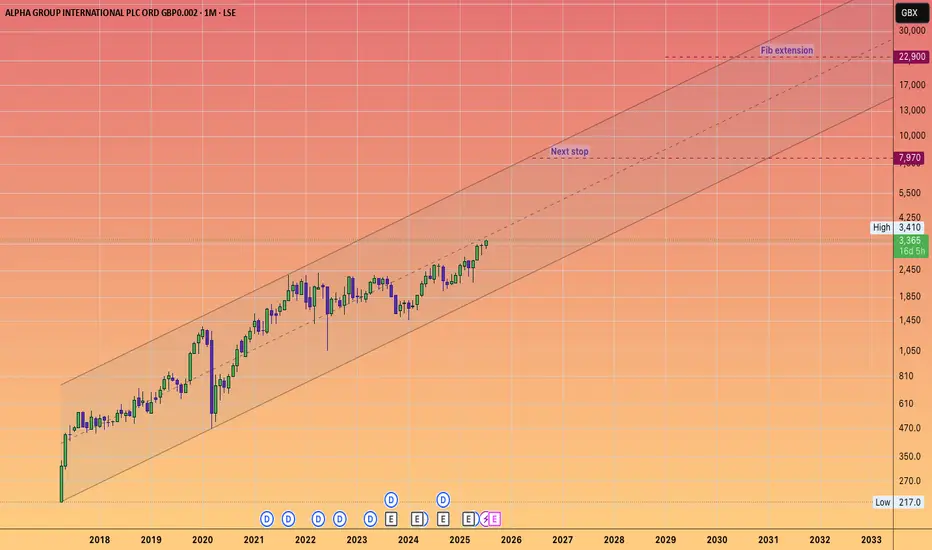
ALPHA GROUP INTERNATIONAL will keep its momentum going!#ALPHA is a fintech company that offers currency risk management and payment solutions.
With a price-to-earnings ratio of approximately 12,
it signifies a solid investment for a growth-oriented fintech firm that is increasing its earnings by about 20 to 25% annually.
In light of the #UKX breaking through and reaching new highs, and beginning to accelerate towards my long-standing projections that the FTSE would hit 5 figures, ALPHA appears to be a unique opportunity in the UK markets, which, as we know, are relatively sparse compared to the USA.
Given the inability to purchase shares of #Revolut, it is likely that capital will flow into this ticker.
Worldmarkets
Trump's Tariff Wars : What To Expect And How To Trade Them.I promised all of you I would create a Trump's Tariff Wars video and try to relate that is happening through the global economy into a rational explanation of HOW and WHY you need to be keenly away of the opportunities presented by the new Trump administration.
Like Trump or not. I don't care.
He is going to try to enact policies and efforts to move in a direction to support the US consumer, worker, business, and economy.
He made that very clear while campaigning and while running for office (again).
This video looks at the "free and fair" global tariffs imposed on US manufacturers and exports by global nations over the past 3+ decades.
For more than 30+ years, global nations have imposed extreme tariffs on US goods/exports in order to try to protect and grow their economies. The purpose of these tariffs on US good was to protect THEIR workers/population, to protect THEIR business/economy, to protect THEIR manufacturing/products.
Yes, the tariffs they imposed on US goods was directly responsible for THEIR economic growth over the past 30-50+ years and helped them build new manufacturing, distribution, consumer engagement, banking, wealth, and more.
The entire purpose of their tariffs on US goods was to create an unfair advantage for their population to BUILD, MANUFACTURE, and BUY locally made products - avoiding US products as much as possible.
As I suggested, that is why Apple, and many other US manufacturers moved to Asia and overseas. They could not compete in the US with China charging 67% tariffs on US goods. So they had to move to China to manufacture products because importing Chinese-made products into the US was cheaper than importing US-made products into China.
Get it?
The current foreign Tariffs create an incredibly unfair global marketplace/economy - and that has to STOP (or at least be re-negotiated so it is more fair for everyone).
And I believe THAT is why Trump is raising tariffs on foreign nations.
Ultimately, this will likely be resolved as I suggest in this video (unless many foreign nations continue to raise tariff levels trying to combat US tariffs).
If other foreign nation simply say, "I won't stand for this, I'm raising my tariff levels to combat the new US tariffs", then we end up where we started - a grossly unfair global marketplace.
This is the 21st century, not the 18th century.
Step up to the table and realize we are not in the 1850s or 1950s any longer.
We are in 2025. Many global economies are competing at levels nearly equal to the US economy in terms of population, GDP, manufacturing, and more.
It's time to create a FREE and FAIR global economy, not some tariff-driven false economy on the backs of the US consumers. That has to end.
Get some.
#trading #research #investing #tradingalgos #tradingsignals #cycles #fibonacci #elliotwave #modelingsystems #stocks #bitcoin #btcusd #cryptos #spy #gold #nq #investing #trading #spytrading #spymarket #tradingmarket #stockmarket #silver

UK HOUSE PRICES: RELENTLESS UPTRENDIn January 2025, the latest figures reveal that UK house prices have risen by 0.7%, pushing the average price to a staggering £299,238, a new all-time high. For the mainstream media, the narrative of an impending house price crash has been a constant refrain over the past two years, fueled by the belief that prolonged high interest rates would spell disaster for the housing market.
Indeed, these elevated interest rates have significantly hindered the natural upward trajectory of house prices, which typically rise in response to inflation, a growing population, and a persistent shortage of new housing construction.
The current stagnation in UK house prices resembles a pressure cooker, building up energy that is bound to release in a dramatic surge. The government’s ongoing strategy of printing money to appease voters will inevitably flow into asset prices, leading to inflation in these markets, much like the consumer price inflation we’ve already witnessed.
The government finds itself in a bind, compelled to continue this money printing to meet the electorate's demands for free money and to manage an ever-growing debt burden. As the debt increases, so does the need for borrowing to service it. This cycle makes it increasingly challenging for the UK to lower long-term borrowing rates, especially compared to the US, which still holds sway over the global financial landscape.
UK house prices are gradually regaining momentum following the fallout from the Liz Truss debacle, a situation she seems to remain blissfully unaware of, despite the havoc her brief six-week tenure as Prime Minister wreaked on the British economy.
The financial landscape was nearly sent tumbling into chaos, prompting the Bank of England to step in with an unprecedented commitment to purchase UK Government Bonds. The economy is so fragile that the UK is now compelled to invest in US government bonds to shore up its financial system against the spectre of another crisis reminiscent of the Truss era under Labour. We were perilously close to a financial meltdown!
Currently, UK house prices are inching towards a potential increase of around 10% per year, indicating a modest upward trend rather than a frenzied housing boom, while also avoiding the catastrophic price drop that the media seems to obsess over.
Ultimately, average house prices in the UK are set to rise, irrespective of government actions or economic conditions. Therefore, those considering the purchase of a standalone house should act without hesitation, as flats and new builds present more complicated challenges—flats can become a logistical nightmare, and new developments might be situated in flood-prone areas, among other concerns.

China's money supply explodes.China's revision of its M1 money supply calculation in January 2025, which now encompasses individual checking accounts and assets held in non-bank financial institutions, seeks to deliver a clearer understanding of liquidity within its economy. The reported surge from $67 trillion in December 2024 to $112 trillion in January 2025 has ignited discussions, with some viewing it as a strategy to obscure underlying economic issues, such as a potential deflationary debt spiral.
The People's Bank of China has declared a "moderately loose" monetary policy for 2025, aiming to boost the money supply and lower interest rates to foster economic growth, a move that may be connected to the M1 recalibration. This shift takes place against a backdrop of broader macroeconomic adjustments, including a 5% GDP growth target and initiatives to stabilize the real estate sector, as detailed in China's 14th Five-Year Plan for 2025.

BILI Projects to $100Bilibili Inc. is a leading provider of online entertainment tailored for the youth of the People's Republic of China. The company boasts a diverse array of digital offerings, including professionally produced user-generated videos, mobile gaming experiences, and enhanced services like live streaming, occupationally created videos, audio dramas on Maoer, and comics available through Bilibili Comic. Additionally, Bilibili offers advertising solutions, IP derivatives, and various other services. The company is also involved in business and technology development, e-commerce, and the distribution of videos, comics, and games. Established in 2009, Bilibili Inc. is based in Shanghai, China.
Bilibili is currently priced at $20.81, indicating it may be undervalued according to discounted cash flow analysis, which suggests a fair value of $28.84. Although there has been notable insider selling recently, the stock remains 28% below its estimated fair value and is projected to achieve profitability within the next three years, surpassing average market growth rates. While the anticipated revenue growth of 10.2% per year is not as robust as one might hope, it still outpaces the overall US market's growth rate of 8.9%.

The W1DOW maker is looming. BEAR MARKET watch.
Look at that August Monthly hammer candle after the Yen carry trade wobble.
The Global Dow jones index is at an all time new high
This rise is BASED on a wall of #FIAT capital that has been clicked and borrowed into existence.
And speculation of an AI revolution
But Money creation is not wealth creation.
An general AI will be deflationary, as more decisions outsourced from Humans to the "mainframe" :0
Most of my idea's I have shared on assets have been to the upside even after bearish down moves. Stocks, Gold & Crypto. Right Back in 2020 I shared a thesis of a Roaring 20's echo meltup and here we are melting up ...
Yet the party must end sometime
so we watch and have one foot in and foot out from this point.
Secular Bull markets have a lifespan of 15-18 years ...
and this one has required multiple rounds of QE (liquidity injections) to achieve this run.
So we will are looking for #BTC hit $100k the Russell 2000 to make new high's, before setting the stage for a bear market that could be quite extraordinary.

Massive US Growth Will Decouple Many Global MarketsPlease watch this video to learn my viewpoint on where real opportunities exist for traders.
For many months, I've suggested that the US markets could double or triple over the next 5 to 7+ years. Some people laugh at my expectations, but others seem to "get it."
In this video, I try to explain why my expectations are valid and why I believe the "crash-dummies" will continue to trap traders into believing each new high reached is a fantastic selling opportunity.
Please watch this video and listen to what I'm trying to share. I don't see the markets as a risk related to a massive financial or global crisis (although it could happen).
I see the markets as shifting/changing related to a post-COVID coupling/decoupling event - very similar to what happened, briefly, in the 1990s.
A decoupling event would shift global economics to a point where global assets move away from determined risk factors and towards safety/security. That means the US stock market, as long as the US Dollar & US economy stays relatively strong, would be the most logical in-demand asset for the next 2~5+ years.
It is straightforward when you consider what is happening.
I hope this helps you understand where opportunities exist and how important it is to rethink what is unfolding right now.
Get some.
#trading #research #investing #tradingalgos #tradingsignals #cycles #fibonacci #elliotwave #modelingsystems #stocks #bitcoin #btcusd #cryptos #spy #es #nq #gold

GBP USD Trade Setup on 4-Hour Timeframe
GBP/USD is currently in a downtrend, making lower lows and lower highs.
To execute our sell order, we need to see a break and retest pattern on the lower timeframe.

75: China Export Analysis - Fundamental and Technical OverviewThe European Union (EU) and the United States have increased scrutiny and imposed higher tariffs on Chinese imports, particularly electric vehicles and strategic materials like gallium and germanium. These measures are designed to protect domestic industries from what are perceived as unfair trade practices and subsidies by the Chinese government.
Additionally, the EU's new Critical Raw Material Act and battery regulations aim to reduce dependency on Chinese imports and secure supply chains for critical technologies. These regulatory changes have led to a noticeable decline in Chinese exports to the EU.
In response, China has imposed export restrictions on key materials, further straining trade relations. These geopolitical tensions and trade barriers have significantly impacted China's export figures.
Currently, China's export trend is showing a downward trajectory. The export figures have struggled to reach the $350 billion mark and are at risk of dropping significantly lower, potentially towards the $140 billion level.
Chart Overview:
Trend Line: A clear downtrend is visible on the chart, with lower highs and lower lows indicating sustained pressure.
Support and Resistance Levels:
Resistance: The $350 billion level is the upcoming resistance. That has not yet been reached.
Support: Immediate support is observed around $250 billion. A break below this level could accelerate the downward move towards $140 billion.
Will We Reach $350 Billion or Go Lower?
Given the current economic and geopolitical landscape, it seems still likely that China will reach the $350 billion export mark in the near term because there has not been a really corrective wave in the chart. But the downward pressure from increased tariffs, export restrictions, and the EU's push for supply chain independence are significant hurdles. If these conditions persist, a further decline is a plausible scenario.

FTSE 100 Can 2.5X versus the GBP In Dollar terms.
We have analysed the FTSE100 #UKX the GBPUSD and UK Housing on a big time frame scale before.
Here we have the FTSE 100 and the UK companies which have pricing power
versus #Sterling which we know is heading to sub $1
As we have expectations of the #GBPUSD to target 0.71 in a head and shoulders target close to a 50% drop from current levels!
British citizens are living in a inflationary nightmare.
A potential lifeboat is investing their way out.
NOT SAVING .. as saving in a ever worthless #Pound is only compounding your loss of purchasing power.

Borsa Italiana tp $48KA return move to previous high's
is what the inverse head 7 shoulders is forecasting.
Which is likely to happen in the next couple years.
30 years to get back to those levels!
An entire generation!
It's why deep capital markets , technology, having the reserve currency $, some financial doping, an entrepreneurial workforce, and degen investor base all combined to push the US market to dizzying heights.

Accumulation zone📊Analysis by AhmadArz:
Pay more attention to the pivot points because it is an accumulation zone.
🔗"Uncover new opportunities in the world of cryptocurrencies with AhmadArz.
💡Join us on TradingView and expand your investment knowledge with our five years of experience in financial markets."
🚀Please boost and💬 comment to share your thoughts with us!

FTSE 100 Targets reminder. As it starts it's big moveAs described before
one of the worst index's to have been exposed to for decades
WHILST during rampant #UK inflation
The FTSE did nothing to help you out.
Yet here we are about to see it get sent to 5 figures.

Has the Twilight Zone with the World Markets ended? -DOWN we go!If you've just been a position (swint trader) with shares this year.
You'll know it's been bvery difficult and challening.
We've seen world markets move in a sideways motion which I like to call the Twilight Zone.
FTSE 100 - UK-
DAX 30 - Germany
CAC 40 - France
ASX 200 - Australia
It breaks down, it goes back up into the range.
It breaks up and it goes back down into the range.
The only semblance of hope right now is that the price has broken BELOW the range and has remained below the 200MA Blue LIne.
This means, the markets are more likely to be and stay in the downtrend for the next couple of weeks and months.
And we might need to look to short (sell) more than we go long and buy.
The overall trend is down right now, but for how long?
We as traders can only react and anticipate based on what we see in front of our eyes.
It's all we can do really with strict money management principles to preserve and protect.

S&P 500 Daily Chart Analysis For Week of September 29, 2023Technical Analysis and Outlook:
Based on this week's trading action, the Inner Index Dip 4212 seems to be experiencing a bias to a continued downward side pattern. The Mean Sup 4246 is playing a crucial role in holding the price. But, there's a chance that the market could rebound to Mean Res 4340 and even extend to Mean Res 4400 on the upside potential.

MSCI World Index Fund WCA - Possible INV H&SIndex: MSCI World Index Fund
Introduction:
Hello everyone! Today, we are looking at the MSCI World Index Fund to gain a broader perspective on the global equity market environment. Based on our current analysis, we can see the formation of a classic technical pattern, signaling a potential reversal from the preceding downtrend.
Analysis:
Over the past 371 days, the index has seemingly been forming an inverted head and shoulders pattern, a well-known reversal pattern suggesting a change from a downtrend to an uptrend. The horizontal neckline of this pattern lies at 120$. While the symmetry between the shoulders isn't perfect, it's worth noting that when the right shoulder is slightly higher than the left one, this is often seen as a bullish sign.
Furthermore, the right shoulder has formed distinctly above the 200 EMA, adding weight to the potential bullish reversal. Currently, the price appears to have broken out above the neckline, paving the way for a calculation of a possible price target upon the successful closing of the weekly candle. However, it's crucial to remember that the weekly candle must close above the neckline; otherwise, we could be dealing with a premature breakout.
Assuming a valid breakout, our calculated price target would be 142, equating to a potential price increase of approximately 18.5%. This provides a favorable opportunity to explore long setups in general.
Conclusion:
The MSCI World Index Fund's technical analysis points to a potentially bullish reversal. Should the current breakout confirm, the ensuing uptrend could present opportunities for investors looking for long positions.
As always, remember to conduct your own due diligence and implement appropriate risk management strategies when investing.
Thank you for tuning into this analysis. Please like, share, and follow for more insights into the market. Happy trading!
Best regards,
Karim Subhieh

GOLD 12/5: Keep watching SELL to the price area around 2000Gold prices remained pressured on Thursday for the second straight day despite a weaker US economy. The reason may be related to the market rushing into the US Dollar amid concerns about the expiration of the US debt ceiling and the collapse of the banking system.
The news becomes even more important and negatively impacts risk appetite as the US Treasury has signaled the possibility that the Federal Government could default on its debt as soon as June 1 unless the debt ceiling is raised.
Gold prices confirmed the pennant break on Thursday, indicating a bearish bias in the metal. The metal's downtrend break also justifies the upbeat signals from the Moving Averages Convergence and Divergence (MACD) indicator, as well as the steady Relative Strength Index (RSI) line, is set at 14. TVC:GOLD
SELL GOLD zone 2020 - 2023
Stoploss: 2027
Take profit 1: 2015
Take profit 2: 2010
Take profit 3: 2005
BUY GOLD zone 2005 - 2000
Stoploss: 1995
Take profit 1: 2015
Take profit 2: 2030
Take profit 3: 2040

NZD/USD STILL IN COMPLEX SELL CORRECTION FACE NZD/USD is still in sell correction face, but complex correction can occur, or a simple correction. Let the market give a clear move next week.
According to the ELLIOT WAVES RULES after an impulse you expect correction

BTC DOMINION COULD BE ON SELL NEXT BTC DOMINION OPTION
Hello traders this market could be facing selling part to Bull alt market next
According to wave counting, wave 1 and 2 is done and now Wave 3 and 4 is the following plans if it is going to work out for me, I think we are in a complex correction for the next wave. If we look at the corrections A and B is done, Wave C is forming an ending diagonal ( WEDGE.
Let us wait till it is complete and see if the bearish can continue

eur/jpy SELL SLASH BUYEUR/JPY needs a fully complete correction for the sell option before starting another bull run. Think about it

Has the news of the Queen affected the Pound? GBP/USD It was announced today that the Queen has passed away today after a 70 year reign. We look at whether this has affected the pound. For GBP/USD the market has not been affected as significantly as traders may have thought, considering the overall negative market sentiment.
The pound dollar continues to consolidate within the range indicated with the daily RSI beaten down into oversold territory.
Will there be breakouts in the coming days?

BTC BULLISH BIASBTC/USDT
Day trading, short term traders should be very careful to go long, because of the bearish flag pattern setting up. DOO we are expecting a correction to complete WAVE 5 according to ELLIOT WAVES count. Investors can start buying, but day traders should be careful. Wait to buy at the support or sell at the resistance, because the market is ranging

(Tutorial) World Markets & their affect on Indian Stock Market!Hello Traders/Investors,
Lets learn World Stock Markets and How it affect us in India on Daily/Weekly and even on long-term basis.
Note: this topic is specifically for Traders (specially Day traders) and also Investors might find it interesting read.
- US is called mother market and we're (i.e. Indian stock market) child market.
- US market gives a queue on how world and our market would perform based on it.
- Sectors like Banks (Dow Jones Bank index) n Tech/IT (NASDAQ) work pretty hand in hand with rest of world in terms of giving us a idea of direction towards which sector can have chances of moving by how much %age today.
- - SGX Nifty , its a Nifty's Future contract which is traded in Singapore Exchange and gives a good idea on start of our markets. SGX Nifty timings : 6.30 AM to 11.30 PM
- Asian markets specially South Korea, Hang Seng n Japan market we should watch carefully in morning to track the direction of markets. We belong to pretty much similar basket.
- European Markets, CAC, DAX and FTSE we should get a median of these 3 exchanges to know how much %age they're moving. Just an observation here, our Indian markets usually stay closer to DAX movement.
- Emerging markets (short form : EMs) : Emerging markets generally do not have as highly developed market and regulatory institutions as those found in developed nations. Market efficiency and strict standards in accounting and securities regulation are generally not on par with advanced economies (such as those of the United States, Europe, and Japan).
- Some of the most rapidly emerging countries include Brazil, Turkey, Russia, India, and China. Also some oil rich nations are also part of this list.
- To get a holistic picture of world markets.. get a queue from yesterday's closing of world markets specially US alongwith US futures which are very important.
- Then, in mornings look at Asian Markets n SGX Nifty to understand where our markets might open. Around afternoon when European markets open you get an idea where our Indian market might stabilise n close. Also, we can look at European futures to get idea on where Euro markets might open.
- Lastly macro economic data like Commodity prices specially Crude oil , USD INR n Dollar Index give a clarity on the markets. Higher Dollar n lower Rupee would cause panic in stock markets usually. Similarly, higher crude oil prices indirectly reduces countries foreign reserves n also affect business due to rising transport costs causing more expenses n less income.
- Cryptos movements can also affect markets now days, a big downmove on cryptos n hit many stop losses n cause for margin calls n hence companies might have to liquidate other assets of individuals like stocks etc. go get back their money.
- Honest mentions: Sometimes some macros are in news, then in those days stock markets start mimicking their charts.. it can b currency pair USDINR , US 10yrd BOND yield, Crude OIL sudden surge or drop in prices and most recently, NIFTY is pretty closely mimicking the US30 futures chart trend on day trades.
- My personal hack: I do all my Technical Analysis on these charts n not just on NIFTY and BANKNIFTY etc. I draw all the Supply n Demand zones, Channels, Trendlines etc. to get queues from them to implement it on my trading in Intraday in India. Usually it works like a charm!
World major stock markets timings in IST (i.e. Indian Standard Timings) :
North America Stock Exchange Timings:
Country Stock Exchange Opening Time (Indian Timing) Closing Time (Indian Timing)
US NASDAQ 7 : 00 PM 1 : 30 AM
US NYSE 7 : 00 PM 1 : 30 AM
Canada TMX Group 8:00 PM 2:30 AM
European Stock Exchange Timings:
Country Stock Exchange Opening Time (Indian Timing) Closing Time (Indian Timing)
UK London Stock Exchange 1 : 30 PM 10 : 00 PM
European Union Euronext 12:30 PM 9:00 PM
Germany Deutsche Borse 12:30 PM 2:30 AM
Switzerland SIX Swiss Exchange 1:30 PM 10:00 PM
Spain BME Spanish Exchange 1:30 PM 10:00 PM
Asia-Pacific Stock Exchange Timings
Country Stock Exchange Opening Time (Indian Timing) Closing Time (Indian Timing)
Australia Australian Security Exchange 5:30 AM 11:30 AM
Japan Japan Exchange Group 5:30 AM 11:30 AM
Hong Kong Hong Kong Stock Exchange 6:45 AM 1:30 PM
China Shanghai Stock Exchange 7:00 AM 12:30 PM
China Shenzhen Stock Exchange 7:00 AM 12:30 PM
Taiwan Taiwan Stock Exchange 6:30 AM 11:00 AM
South Korea KRX Korean Exchange 5:30 AM 11:30 AM
India NSE and BSE 9:15 AM 3:30 PM
You can google n find most of Live market details on many websites, I usually enjoy Investing .com for their simple UI and charts.
Please take all positions at your own risks and these are my personal views on analyzing markets. I'm not responsible for any losses incurred by you!
Regards,
Anshul
