$WTC Buy Bottom, Sell High. Easy Money on Random Pump!The truth about trading is as simple as knowing when you wanted to make entry and where is the level to get out. Plus, preparing for something unexpected with money management and controlling your emotion. I've been learning about this and still learning a lot even until today.
Less talk about fundamental of trading and apply it on Walton Chain.
Remember when WTC was one of the most early Binance pump shitcoin. WTC attracts a lot of volumes that become stepping stone for Binance until today.
As we can see the chart is quite bottomed, people really not interested anymore on this, but I do. Charts looks real flat, looks like less circulate in the open market. That is why the best time to jump in. The sentiment about using Binance Telegram to AMA event is really shady, but also can be our opportunity. This one can be fruitful. Always do your own research!
**************************************************************************************************************************************************
If all of these ideas I posted helps you, give them thumbs up, shares, comments and follow me. If you have a suggestion, just fill in the comment sections or message me. Looking forward to hear from you all. Thanks a lot!
TIPS: PATIENCE & PERSISTENCE ARE KEY TO SUCCESS
RISK WARNING: Cryptocurrency investment is subject to high market risk. Please make your investments cautiously. I will make best efforts to bring profitable signals, but will not be responsible for your investment losses or profit.
--------------------------------------------------------------------------------------------------------------------------------------------------
www.tradingview.com Rules:
#1 Always obey tradingview.com house rules
#2 Always read the description
#3 Don't spam on the comment section
#4 If you wanted to request my opinions about a coin/token just give 10 likes on my published charts and I will do it the day or two after
#5 My opinions are not financial advice, follow it at your own will and your own risk
#6 Together, let's build a better community on this platform
WTCUSD

Walton [WTCBTC Binance] Might burst to 2x soonCup and handle on the WTCUSD and Descending Wedge on the WTCBTC and bullish divergence on the RSI.

Where is Waldo? Walton chain has disappeared off many peoples radar but a move back above resistance could change that
A possible retest of local highs could be on the cards only once we get back above and hold the S/R flip zone
MFI forming a bull div, which further proves our scenario of a bounce

There is a possibility for the beginning of an uptrend in WTCUSDTechnical analysis:
. Walton/Dollar is in a range bound and the beginning of uptrend is expected.
. The price is above the 21-Day WEMA which acts as a dynamic support.
. The RSI is at 56.
Trading suggestion:
. There is a possibility of temporary retracement to suggested support zone (1.839400 to 1.383800). if so, traders can set orders based on Price Action and expect to reach short-term targets.
Beginning of entry zone (1.839400)
Ending of entry zone (1.383800)
Entry signal:
Signal to enter the market occurs when the price comes to " Buy zone " then forms one of the reversal patterns, whether " Bullish Engulfing ", " Hammer " or " Valley " in other words,
NO entry signal when the price comes to the zone BUT after any of the reversal patterns is formed in the zone.
To learn more about " Entry signal " and the special version of our " Price Action " strategy FOLLOW our lessons:
Take Profits:
TP1= @ 2.721600
TP2= @ 3.505300
TP3= @ 5.105280
TP4= @ 6.346210
TP5= @ 7.629800
TP6= @ 10.05280
TP7= @ 11.80870
TP8= @ 18.58420
TP9= @ 29.54300
TP10= Free


WTC - Walton have a signal uptrend, go up soonWTC/BTC - Walton forecast
4H/ 1D - up and minor uptrend
Price move above support level --> positive situation
BUY around:
4250 - 4330
SELL target:
4655
5005
5441
5926
Stop loss:
Under 4200
#TrungVuz
News: ~ The crypto market warms and minor upward.
Waltonchain (WTC) is building an ecosystem that melds blockchain, RFID technology, and IoT (Internet of Things). The Walton team develops and produces Transaction ID-reading RFID chips, which can generate their own random ID hashes that are uploaded simultaneously to the blockchain via their RFID reader. This translates to enhanced operational efficiency, especially for supply chain use cases such high-end clothing identification, food & drug traceability, and logistics tracking.
#TrungVuz


WTC/BTC - 4 Hour - Potential 100%if you've found this useful, feel free to donate. thanks.
BTC: 1LCayhGfdzsNP9M5227LyE28FKed4thEsB
LTC: LaPLQ6JoiqrxYED9FBNVphyApAhpW4Yw3R
ETH: 0x1Ec59747Ff307FaA71de070A3914e9afFbac7424

WTC Challenging Upper RangeWaltonchain is a chart to watch over the next few days as we approach important resistance.
EMA's are acting as support on this uptrend and we've seen a bullish cross of the 12 and 26 day. Increasing volume. RSI is approaching oversold but if we pull back in the next couple of days before challenging that upper range resistance level it will likely bring it back under 70.
If that red resistance is broken there is a lot of room before hitting any areas of recent price action.
Certainly a coin I will be keeping an eye on over the next week or so.
There are a lot of alt coins with somewhat similar looking charts with many approaching upper range levels with a ton of room to fly. It pretty much comes down to what Btc does. If bitcoin can break that 4200ish level then we just may see a little alt season.
If Wtc fails to break resistance we can expect further consolidation. If btc drops we look at the bottom range level as support.

WaltonChain Breaking downtrendWTC has broken the downtrend line that has been pushing the price down for over a year
Volume is showing massive accumulation at current levels
Set up is very clear with stop loss and huge reward
You can also see my the WTCUSD chart i posted forthcoming this accumulation
Be safe


Walton - WTC vs BitcoinLongterm Projection for Walton -WTC/BTC
Full Cycle reset would be ideal for long term pick ups on Walton
A break back above our Monthly level would be a good sign as well. Keep an eye on this pair.

WTC/BTC potential around 1500% profitI love this coin, last year he gave a bunch of profit! I do not know how he will achieve this goal, but he will go to her.
Now we are seeing a classic and rather strong reversal pattern.
ITS NOT financial advice!

WTCBTC Monthly is setting up for 50% retracementWTCBTC Monthly stting up for 50% retracement on the monthly chart.

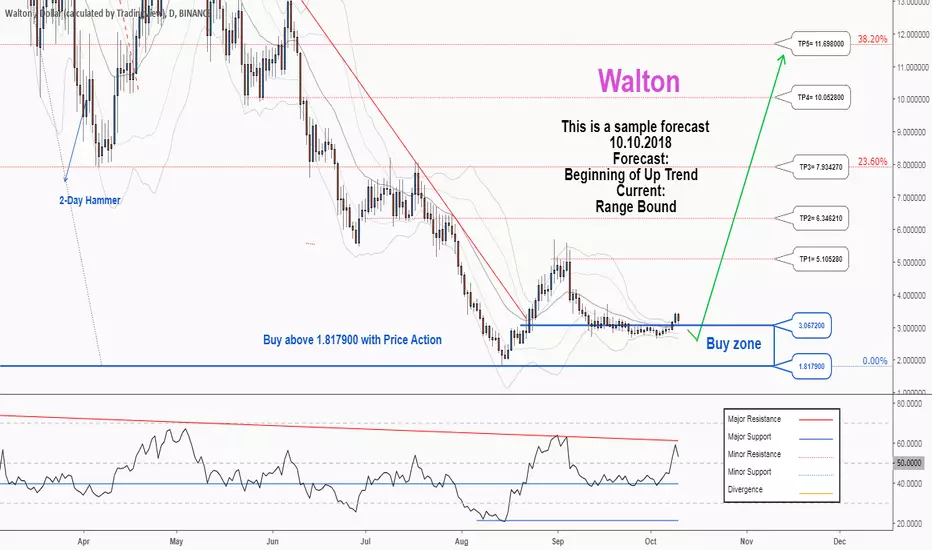
There is a possibility for the beginning of an uptrend in WTCUSDTechnical analysis:
. WALTON/DOLLAR is in a range bound and the beginning of uptrend is expected.
. The price is above the 21-Day WEMA which acts as a dynamic support.
. The RSI is at 54.
. The price downtrend in the daily chart is broken, so the probability of the resumption of an uptrend is increased.
Trading suggestion:
. There is a possibility of temporary retracement to suggested support zone (3.067200 to 1.817900). if so, traders can set orders based on Price Action and expect to reach short-term targets.
Beginning of entry zone (3.067200)
Ending of entry zone (1.817900)
Entry signal:
Signal to enter the market occurs when the price comes to " Buy zone " then forms one of the reversal patterns, whether " Bullish Engulfing ", " Hammer " or " Valley " in other words,
NO entry signal when the price comes to the zone BUT after any of the reversal patterns is formed in the zone.
To learn more about " Entry signal " and the special version of our " Price Action " strategy FOLLOW our lessons:
Take Profits:
TP1= @ 5.105280
TP2= @ 6.346210
TP3= @ 7.934270
TP4= @ 10.052800
TP5= @ 11.698000
TP6= @ 14.732200
TP7= @ 17.794500
TP8= @ 22.121000
TP9= @ 27.661900
TP10= @ 42.177100
TP11= Free
WTCBTC: one more attempt One more attempt to break the falling wedge. The volume recently is not bad, so we shall wait for the confirmation, holding the price above the resistance line.
Not a financial advice.

WTCBTC: simpleThe breakout of the wedge didn't work. Still crawling below the resistance line. A previous (global) support is a very tempting level to bounce off from. The reversal at that price is too obvious to believe in, but often the simplest way of price evolution is the most possible.
Not a financial advice.

WTC LONGWTC in the 1 day on the (BB) Bullinger bands shows upward movement with plenty of room for retracement in the upward channel still! Its a risk but a calculated one in my opinion!

WTC Could x3-x4 Against BTC#WTC / BTC ( Binance )
Buy Range : 4500
Stop Loss : Closed Candle below 0.0004 - > Rebuy at Strong Support 0.00032
Target 1 : 9320
Target 2 : 12542
Target 3 : 16540
Pros :
- WTC price was around x10 ( 40k sats/40usd).
- Strong potential for huge grow when altcoin cycle starts
- Nice Risk/Reward because price are too cheap. Only get delisted or some real bad news could smash its price
Cons :
- Early to confirm bullish reversal on all timeframes, just some positive movements which could be a Start or maybe needs longer for recover
WEEKLY CHART
- Not much to say. SAR its going down and need some weeks sideways to touch our levels.
- EMA20 still above candles which is a bearish signal on that timeframe
DAILY CHART
- RSI downtrend has been broken and pointing up.
- Daily CCI turned into Green
- MACD crossing and rising.
- Good positive volume
- Some days on streak in SAR
- Moving averages still above over candles which is not positive
4H CHART
- Moving Averages crossed and being supported by them
- Stay above Ichimoku cloud since 19th August. Good signal.
- WTC need to stay Above MA200 to confirm good mommentum
CONCLUSION
WTC looks much better on short-term charts looks than longer timeframes. That's normal because it come from massive bloodbath and its recoverying good. If this coin is able to stay above moving averages on the Daily, im pretty sure it will rise much better.
However , we have to remind that market remains bearish and we should leave if this coin lose support of blue moving averages on short-timeframes.
For Long-term overview, this coin is pretty cheap and holders could x3-x4 easy if market turn into a new bullrun cycle
Good luck ,
Mike
PD : Tradeview deleted my last WTC idea and i had to upload again . Sorry!

WaltonChain - A Perfect Buying opportunity?WaltonChain today has reached strong support at $4.7, which is confirmed by two Fibonacci retracement levels. First is the 38.2% Fibs applied to the uptrend trendline breakout point. Second is the 127.2% Fibs applied to the last corrective wave up.
The $4-$4.7 area could be the turning point for the WTC/USD, yet its too early to say that with confidence. Further decline is possible, and $4 psychological support can be reached, even spikes below can be produced.
But all-in-all it is an interesting long term buying opportunity for the WaltonChain, that might result in huge gains over time. The uptrend confirmation could be the break above the $8 resistance, that only if price won't break below the $4 support. In that case first upside target is seen at $30, and if broken, new all-time high should be expected.

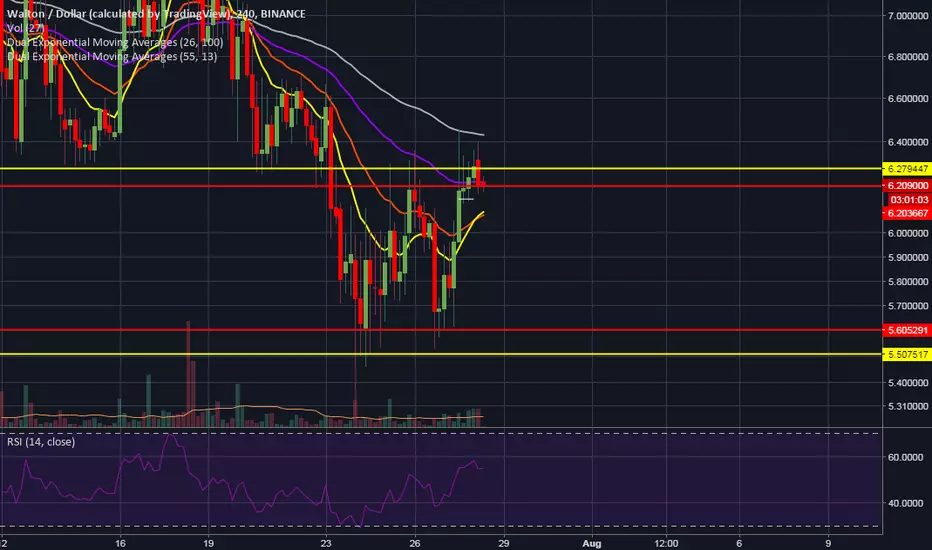
WTC (Waltonchain) breaks 4hr equilibriumWaltonchain broke the 4hr equilibrium and is now facing it's next resistance not much higher than that equilibrium at $6.35-6.40. A break in that resistance will result in a target in the high $7's along the trend line resistance visible on the daily time frame. The trend line and the daily chart resistance at $8.00 should be noted as strong resistance levels. Walton has appeared to double bottom at $5.50 and is gaining traction, this traction will be needed to break to higher highs and the optimism is increasing.