WTI - Will oil return to the upward trajectory?!WTI oil is located between EMA200 and EMA50 on the 4-hour timeframe and is moving in its medium-term descending channel. In case of a downward correction towards the support area, the next opportunity to buy oil with a reward at a reasonable risk will be provided to us. A valid break of the drawn downtrend line will pave the way for oil to reach the drawn areas.
Goldman Sachs has stated that even if hostilities in Ukraine cease and sanctions are eased, Russia’s oil exports are unlikely to see a significant increase. The bank believes that Russia’s crude oil production will remain capped at 9 million barrels per day, not primarily due to sanctions, but rather because of the country’s commitments under the OPEC+ agreement.
OPEC+, which is responsible for nearly half of the world’s oil production, has decided to delay its planned production increase, which was originally scheduled between April and July. Meanwhile, Trump has announced that additional negotiations with Russia are set to take place in an effort to bring an end to the war in Ukraine—an event that could impact the outlook of global energy markets.
Russia remains one of the key oil suppliers worldwide and plays a significant role in price fluctuations. Goldman Sachs predicts that the price of Brent crude will rise to $79 per barrel by the end of this month, while it is currently trading at around $76 per barrel.
Ukrainian President Volodymyr Zelensky stated that the United States has, in some ways, helped Vladimir Putin break out of his isolation. He emphasized that Trump’s team must gain a better understanding of Ukraine’s actual situation and made it clear that he has no intention of “selling” his country. Zelensky also highlighted the strength and resilience of the Ukrainian military and added that Trump’s envoy should ask ordinary Ukrainians how they perceive him following his recent statements.
Meanwhile, Vladimir Putin announced that the rapid reconstruction of the Caspian Pipeline is not feasible. He explained that Western-made equipment used in the Caspian Pipeline Consortium has sustained severe damage due to recent attacks.
Putin emphasized that the restoration of this pipeline would not be completed swiftly, as critical components rely on Western technology and have been significantly impaired.
The pipeline, which transports Kazakh oil to global markets, has experienced a 30-40% reduction in oil flow following a drone attack on one of its pumping stations in southern Russia. This reduction equates to approximately 380,000 barrels per day (bpd). This development was not entirely unexpected, as Russian Deputy Prime Minister Alexander Novak had previously stated that repairs to the pipeline could take several months.
WTI-OIL

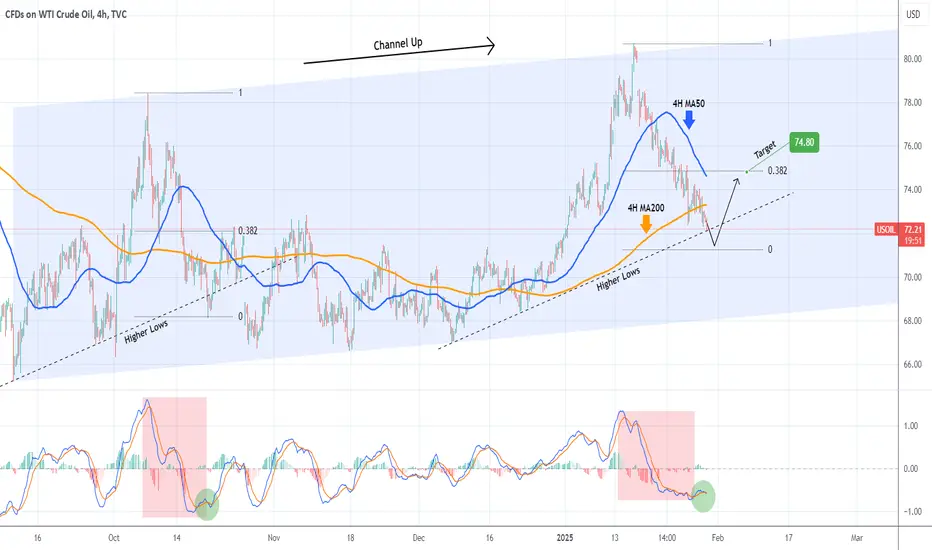
WTI OIL on a Bearish Leg but short-term rebound expected.WTI Oil (USOIL) has been trading within a Channel Up pattern that is unfolding its latest Bearish Leg. This Leg just hit the Higher Lows trend-line from the last bottom, which is so far no different than what took place during the previous Bearish Leg on October 18 2024.
The 4H MACD sequences among the two fractals are very similar so, as the October price action did, we expect a marginal breach of the Higher Lows followed by an instant rebound above the 4H MA50 (blue trend-line) and towards the 0.382 Fibonacci retracement level. As a result our short-term Target is $74.80.
-------------------------------------------------------------------------------
** Please LIKE 👍, FOLLOW ✅, SHARE 🙌 and COMMENT ✍ if you enjoy this idea! Also share your ideas and charts in the comments section below! This is best way to keep it relevant, support us, keep the content here free and allow the idea to reach as many people as possible. **
-------------------------------------------------------------------------------
💸💸💸💸💸💸
👇 👇 👇 👇 👇 👇
WTI: Will oil return to the upward trajectory?!WTI oil is located between EMA200 and EMA50 on the 4-hour timeframe and is moving in its ascending channel. In case of a downward correction towards the demand zone, the next opportunity to buy oil with a suitable reward for risk will be provided to us. A valid breakdown of the drawn downtrend line and preservation of the channel will pave the way for oil to reach the drawn ranges.
Under the pressure of imminent sanctions planned by the Trump administration and the debts Iran now owes to China, the country has begun offloading crude oil that had been stored in Chinese warehouses for years. This oil, shipped to China between 2018 and 2019 but not officially declared in Chinese customs records, was kept in isolated, pre-designated storage facilities. With storage costs reaching hundreds of millions of dollars, Iran is now obligated to cover these expenses. So far, 5.4 million barrels of oil have been removed from a Chinese port, transported by a total of four tankers.
According to a Bloomberg report, OPEC+ is likely to maintain its current supply policy in its meeting next week. This decision contradicts the request of U.S. President Donald Trump, who has urged oil producers to increase output to lower prices and exert more economic pressure on Russia to end the war in Ukraine. Under the current plan, oil supply restrictions will remain in place for this quarter and will gradually ease starting in April.
Donald Trump plans to sign an executive order to initiate the development of a “next-generation” missile defense system in the United States. This system, modeled after Israel’s Iron Dome, is designed to protect the U.S. from ballistic missile attacks, hypersonic missiles, advanced cruise missiles, and other modern aerial threats.
According to the released information, the executive order aims to establish an advanced space-based missile defense system capable of detecting and neutralizing missiles launched toward the U.S. Conceptually, this resembles Israel’s Iron Dome, which has been used for years to intercept and destroy rockets fired from Gaza. The U.S.government has already invested billions of dollars in developing Israel’s Iron Dome, and the American military possesses its own missile defense systems.
The order describes missile attacks as a “catastrophic threat,” but no details have been provided regarding the project’s costs or timeline. Developing a comprehensive missile defense system for a country as geographically vast as the U.S. is a highly complex and costly endeavor. Additionally, the emergence of next-generation missile threats, such as hypersonic missiles that travel at extremely high speeds, presents significant technical challenges. This indicates that the project will require substantial investment and time for completion.

Does WTI Oil have enough energy to travel back up?After an unsuccessful breakout in mid-January, MARKETSCOM:OIL made its move back down. That said, it's currently finding support near the 200-day EMA. On one hand, it may seem that this is the place for a potential rebound, however, the bulls should not get their hopes up, because there some indication for a possible drift further south. Take a look at the video idea.
TVC:USOIL
RISK DISCLAIMER
74.2% of retail investor accounts lose money when trading CFDs with this provider. You should consider whether you understand how CFDs work and whether you can afford to take the high risk of losing your money. Past performance is not necessarily indicative of future results. The value of investments may fall as well as rise and the investor may not get back the amount initially invested. This content is not intended for nor applicable to residents of the UK. Cryptocurrency CFDs and spread bets are restricted in the UK for all retail clients.

Brent - Peace returned to the Middle East?!Brent oil is above EMA200 and EMA50 in the 4-hour time frame and is moving in its upward channel. On the ceiling of the ascending channel, we will look for oil selling positions. In case of a valid break of the $80 range, we can see the continuation of the downward trend. On the other hand, within the demand zone, we can buy with a suitable risk reward.
Brent crude oil prices have surpassed $80 per barrel. This price increase continues to be supported by declining U.S. crude oil inventories and uncertainties surrounding Russian oil supplies following new U.S. sanctions.
The International Energy Agency (IEA) has stated that the latest U.S. sanctions have the potential to significantly disrupt Russia’s energy exports. These sanctions have blacklisted over one-fifth of the tanker fleet transporting Russian oil. Last week, 160 sanctioned tankers transported over 1.6 million barrels per day of Russian oil in 2024, accounting for approximately 22% of the country’s maritime exports. However, the IEA has maintained its current outlook on Russia’s oil supply and will update it based on future developments.
Meanwhile, reports indicate that Israel and Hamas have reached a ceasefire agreement, though Israel’s Prime Minister’s Office stated that details are yet to be finalized. Israeli Prime Minister Benjamin Netanyahu thanked U.S. President-elect Donald Trump for his role in the Gaza agreement and announced plans to meet him in Washington soon. Netanyahu also expressed gratitude to U.S. President Joe Biden for aiding in the hostage agreement. A senior Hamas official confirmed the group’s commitment to the ceasefire proposed by mediators.
In the oil market, attention remains focused on uncertainties surrounding Russian oil supply after the announcement of stricter U.S. sanctions. Additionally, declining U.S. crude oil inventories provide further support for prices. According to the Energy Information Administration (EIA), U.S. commercial crude oil inventories fell by 1.96 million barrels last week to under 413 million barrels, the lowest level since March 2022. This decline was primarily due to a decrease in crude oil imports by 304,000 barrels per day and an increase in exports by 1 million barrels per day. In refined products, despite a 1.6% drop in refinery utilization, gasoline and distillate inventories rose by 5.85 million barrels and 3.08 million barrels, respectively.
The Colonial Pipeline, which transports about 1.5 million barrels per day of gasoline from the U.S. Gulf Coast to the East Coast, is expected to remain closed until Friday following a leak earlier this week. This has provided limited upward support to gasoline prices.
The IEA and OPEC have both released their monthly oil market reports. The IEA warned that new U.S. sanctions on Russia’s energy sector could lead to supply disruptions. Additionally, the agency revised its global oil demand growth forecast upward due to colder weather in the Northern Hemisphere. The IEA estimates that global oil demand in 2024 will increase by 940,000 barrels per day, 90,000 barrels per day higher than the previous estimate. For 2025, demand is expected to grow by 1.05 million barrels per day.
OPEC, in its monthly report, maintained its 2025 oil demand growth estimate at 1.45 million barrels per day. For 2026, the group’s initial forecast predicts an increase of 1.43 million barrels per day. OPEC also kept its 2025 supply growth estimate for non-OPEC+ countries unchanged at 1.11 million barrels per day and expects a similar increase for 2026. OPEC’s production in December rose slightly to 26.74 million barrels per day, while overall OPEC+ output fell by 14,000 barrels per day to 40.65 million barrels per day due to reduced production in Kazakhstan. OPEC data indicates that demand for OPEC+ crude in 2025 will reach 42.5 million barrels per day and rise to 42.7 million barrels per day in 2026.
Iraq’s Oil Minister Hayan Abdul-Ghani told Reuters that Iraq plans to sign a major oil and gas deal in Kirkuk with BP by early February. He noted that this deal will surpass the scale of the major 2023 agreement with TotalEnergies.

WTI CRUDE OIL hit the 6 month Resistance Zone. Sell.WTI Crude Oil entered today the 6 month Resistance Zone of July 2024.
Even though the long term trend seems to have turned bullish by breaking critical levels, a short term pull back is possible on this Resistance.
Trading Plan:
1. Sell on the current market price.
Targets:
1. 74.50 (the 0.382 Fibonacci level).
Tips:
1. The RSI (4h) is overbought, justifying a short term pull back.
Please like, follow and comment!!

WTI/OIL Bullish Signal triggered7 days ago my bullish signal for oil triggered and I am now long.Now many new facts are being released that are align with my signals.
I have collected some very important and interpreted them.This will help you also t understand the backrounds. The bullish trend is currently at its weak phase where many false signals are ofcourse potentially possible.
In this phase of the trend I focuse just on risk management(tightenning stops,to breakeven etc.
But also increasing my positions in this phase and sizing them up are also possible.
Later in strong phase of the trend Iwont increase my positions, but I let the profits run.
I marked also Taking profits level for some of you who might are taking profits.
Generally I let the profits run and just cut the losses if necessary.
Important levels I marked in the chart.
Here Important catalysts why I believe Oil will climb up:
1
India Doubles Down on Refining Expansion. India’s state-controlled refiner Bharat Petroleum (NSE:BPCL) announced its plans to invest $11 billion in a new refinery in southern Andhra Pradesh state, adding 180,000 b/d of capacity and an integrated petrochemical plant to meet domestic demand.
France Launches First Reactor of 21st Century. 12 years overdue and four times the originally planned budget with a price tag of €13 billion, the Flamanville 3 nuclear reactor was finally connected to France’s power grid this week, marking the first addition of new nuclear capacity since Civaux-2 in 1999.
👉 Interpretation
France Launches First Reactor of the 21st Century
Key Details:
Flamanville 3 nuclear reactor, costing €13 billion and delayed by 12 years, is now operational.
First new nuclear capacity addition in France since 1999.
Implications for Oil Prices:
Reduced Dependence on Fossil Fuels: As nuclear energy replaces some fossil fuel-generated electricity, demand for oil (particularly fuel oil used for power generation in some regions) could decline slightly in Europe over the long term. However, this effect is minor since most oil demand comes from transportation rather than power generation.
Transition Signals: The operational reactor signals Europe's commitment to energy transition, which may influence long-term sentiment about reduced reliance on fossil fuels.
Neutral Short-Term Impact: Since the reactor serves a domestic market and does not affect global oil supply or demand immediately, the impact on oil prices is negligible in the short term.
India Doubles Down on Refining Expansion
Key Details:
Bharat Petroleum plans a $11 billion investment in a new refinery with a capacity of 180,000 b/d and an integrated petrochemical plant.
Focus is on meeting India’s growing domestic energy demand.
Implications for Oil Prices:
Increased Crude Demand: A new refinery requires crude oil as a feedstock, adding to global oil demand. Once operational, this expansion will support bullish trends in oil prices, especially as India becomes a larger importer of crude.
Focus on Domestic Market: The refinery aims to meet rising domestic consumption, particularly for transportation fuels and petrochemicals, reinforcing India’s growing importance as a driver of oil demand.
Positive Long-Term Outlook: While the refinery won't impact prices immediately, it highlights the bullish long-term demand trajectory for oil in emerging markets like India.
Overall Impact on Oil Prices
Bullish Factors:
India’s refinery expansion indicates long-term growth in oil demand, supporting bullish sentiment.
Emerging markets continue to drive global oil demand, balancing out declines in demand from developed regions.
Neutral or Bearish Factors:
France's new nuclear reactor reflects progress in the energy transition, potentially reducing oil demand in Europe. However, the short-term impact is negligible.
Conclusion
India's refinery expansion supports a bullish outlook for oil prices, complementing bullish signal. While France’s nuclear reactor signals a step toward alternative energy, its impact on global oil demand is minimal and overshadowed by growing energy needs in emerging markets like India. Overall, the developments reinforce a stable to slightly bullish environment for oil prices.
2
Turkey Eyes Maritime Delimitation with Syria. The Turkish government is readying to start negotiations with the new al-Julani government of Syria to delineate maritime boundaries in the Mediterranean Sea, a move that would allow Ankara to ‘increase its area of influence’ in energy exploration.
US to Finance Guyana’s Gas Power Buildout. The US Export-Import Bank approved a $526 million loan to Guyana for the construction of a 300 MW natural gas-fired power plant that would use ExxonMobil’s associated gas production from the Stabroek block, staving off intense Chinese competition.
👉 Interpretation of this news
Here's an analysis of how these developments might influence the oil market Turkey Eyes Maritime Delimitation with Syria
Key Details:
Turkey plans to negotiate maritime boundaries with the new Syrian government led by al-Julani.
The goal is to expand Turkey’s influence in Mediterranean energy exploration.
Implications for Oil Prices:
Energy Exploration Opportunities: If Turkey successfully delineates maritime boundaries, it could lead to new oil and gas exploration activities in the Mediterranean. This would increase the long-term potential for energy supply, but the impact on oil prices would be delayed and dependent on successful discoveries.
Geopolitical Risk Premium: Tensions surrounding maritime boundaries in the Eastern Mediterranean have previously caused geopolitical disputes (e.g., with Greece and Cyprus). The potential for disputes with other nations in the region could add a slight risk premium to oil prices.
No Immediate Impact: Since this development involves negotiations and potential future exploration, it does not have an immediate impact on oil supply or demand.
US to Finance Guyana’s Gas Power Buildout
Key Details:
The US Export-Import Bank approved a $526 million loan for a 300 MW natural gas-fired power plant in Guyana.
The plant will utilize ExxonMobil's associated gas from the Stabroek block, reducing flaring and tapping into a previously unused energy source.
Implications for Oil Prices:
Gas as an Alternative to Oil: Increased natural gas production in Guyana could slightly offset demand for oil in power generation over the long term. However, this is unlikely to significantly impact crude oil demand globally.
US vs. China Competition: The US financing reinforces its influence in Guyana, securing a foothold in the resource-rich region. This limits China's involvement but doesn't directly impact oil prices.
Neutral Impact on Crude Oil: Since this involves natural gas and not oil, the direct impact on crude prices is limited. However, the increased utilization of gas could eventually reduce the flare gas associated with oil production, slightly improving efficiency in Guyana's oil operations.
Overall Impact on Oil Prices
Bullish Factors:
Potential geopolitical disputes from Turkey’s maritime moves could introduce a risk premium into oil prices.
Long-term developments in Guyana's energy infrastructure reinforce stable energy supply, indirectly supporting efficient oil production.
Neutral or Limited Impact:
Both developments are longer-term in nature, with no immediate effect on crude oil supply or demand. The news leans more towards a neutral to slightly bullish influence on oil prices. Turkey’s maritime delimitation talks could introduce some geopolitical uncertainty in the Mediterranean, which may support a minor risk premium. However, neither of these developments directly counters or strongly amplifies your bullish oil signal, which remains supported by other recent market-moving news (e.g., Suez disruptions, Shell refinery shutdown).
3
Shell Shuts Singapore Refinery After Leak. UK-based energy major Shell (LON:SHEL) shut down one of its oil processing units at the 237,000 b/d Pulau Bukom refinery in Singapore after the nation’s Port Authority reported a leak of oil products together with the cooling water discharge.
Mongolia Walks Back France Uranium Deal. The government of Mongolia has retracted the announcement of reaching a $1.6 billion deal with France’s uranium mining giant Orano, marking another odd roadblock on the way towards launching the Zuuvch Ovoo mine, in development since 2013.
👉I nterpretation of this oil trading news:
Here’s how these developments could impact the oil market and your bullish signal on oil prices:
Shell Shuts Singapore Refinery After Leak
Key Details:
Shell has shut down an oil processing unit at the Pulau Bukom refinery (237,000 barrels per day capacity).
The shutdown was caused by a leak reported alongside cooling water discharge.
Implications for Oil Prices:
Tightened Refining Capacity: With one of Asia’s major refining facilities partially offline, there will be reduced supply of refined products like gasoline, diesel, and jet fuel in the region. This could support higher refined product prices, indirectly boosting crude oil demand as refineries aim to maintain supply levels.
Short-Term Supply Disruption: Depending on the duration of the shutdown, the disruption could lead to localized supply shortages and increased imports to meet demand, which is bullish for oil prices.
Environmental and Regulatory Fallout: If the shutdown is prolonged due to environmental regulations or extensive repairs, the market could factor in sustained supply tightness.
2. Mongolia Walks Back France Uranium Deal
Key Details:
Mongolia has retracted its announcement of a $1.6 billion deal with France’s Orano for developing the Zuuvch Ovoo uranium mine.
The project, in development since 2013, faces yet another delay.
Implications for Oil Prices:
Energy Diversification Delays: Delays in uranium mining projects hinder the global transition to nuclear energy, which is seen as a long-term competitor to oil and gas. This keeps oil demand relatively higher in the medium term.
Market Sentiment: Although this news doesn't directly affect oil supply or demand in the short term, it underscores uncertainties in alternative energy projects, potentially reinforcing the importance of fossil fuels for global energy security.
Overall Impact on Oil Prices
Bullish Factors:
The Shell refinery shutdown could tighten regional supply and indirectly boost crude oil demand to support refining operations.
Mongolia's uranium deal setback highlights delays in alternative energy development, indirectly supporting continued oil reliance.
Neutral or Limited Impact:
The uranium deal issue has no immediate bearing on oil markets but contributes to long-term energy security discussions.
Conclusion
The Shell refinery shutdown aligns well with bullish signal, as it adds a layer of supply disruption to the oil market. While the Mongolia news has less immediate impact, it reflects ongoing challenges in energy diversification, subtly reinforcing oil's role in the energy mix. Together, these developments lean towards a supportive outlook for higher oil prices in the short term.
4
All these news matter:
While we got early bullish signals during the last days,now more news are released.Houthi Warfare Drains Egypt Suez Revenue. Egypt reported that its Suez Canal revenues have plunged by 60% year-over-year in 2024 as Houthi maritime warfare cost the North African country at least $7 billion, worsening Cairo’s plight as the Egyptian pound slid to a record low over the past month.
Libya’s Two Governments to End Fuel Subsidies. Libya’s Benghazi government agreed to a proposal from the rival Tripoli government to end fuel subsidies in the war-torn country, with gasoline prices remaining artificially low at $0.11 per gallon, the second-cheapest in the world.
Interpretation of oil trading news today:
Here’s how the two developments could influence the oil market, particularly in light of your bullish signal on oil prices:
Houthi Warfare Drains Egypt Suez Revenue
Key Details:
Suez Canal revenues are down 60% year-over-year due to Houthi maritime attacks.
Losses of $7 billion exacerbate Egypt’s economic woes amid a record low for the Egyptian pound.
Implications for Oil Prices:
Supply Chain Disruption: The Suez Canal is a critical chokepoint for global oil and gas shipments. If Houthi attacks escalate or disrupt transit, it could delay shipments and increase transportation costs, creating upward pressure on oil prices.
Risk Premium: Geopolitical instability in the region adds a risk premium to oil prices, as traders factor in potential disruptions.
Currency Devaluation Impact: The weakening Egyptian pound might not directly influence oil prices, but it reflects economic instability that could worsen if the Suez remains compromised.
Libya’s Two Governments to End Fuel Subsidies
Key Details:
Rival governments in Libya are cooperating to end fuel subsidies.
Gasoline prices, currently at $0.11 per gallon (among the cheapest globally), are set to rise.
Implications for Oil Prices:
Higher Domestic Costs: Removing subsidies could reduce Libya’s domestic fuel consumption, leaving more oil and refined products for export.
Market Balance: Increased exports from Libya could counteract some supply tightness caused by other factors, potentially capping oil price increases.
Political Stability: This rare cooperation between Libya’s rival governments could indicate improving governance, which might increase Libya’s crude production and exports in the long term. This could have a bearish effect on oil prices if the market views it as a stabilizing factor.
Overall Impact on Oil Prices
Bullish Factors:
Suez Canal disruptions and geopolitical instability add to the risk premium on oil.
Supply chain concerns may tighten market sentiment.
Bearish or Neutralizing Factors:
Libya’s subsidy removal could lead to increased exports, easing supply pressures.
What to Watch For:
Suez Canal Traffic: Any further disruptions or escalations in Houthi maritime warfare could amplify bullish momentum in oil prices.
Libya’s Export Trends: Monitor whether Libya increases its crude oil and product exports following the subsidy removal.
In summary, the Suez Canal situation supports the bullish signal you've received, as it poses a significant risk to global oil logistics. Libya’s subsidy removal might introduce a balancing effect but seems less likely to fully offset the bullish momentum from Middle East instability.
More Tensions in the middle east in 2025 building Under Pressure, Iraq to Cut Gas Flaring. Amidst reports that Donald Trump might sanction Iraq’s imports of Iranian natural gas, Baghdad promised to cut flaring volumes by around 20% next year to meet rising demand, expecting to capture more than 85% of associated natural gas production.
Finland Seizes Suspicious Russian Tanker. Finland’s coast guard has boarded and seized the Eagle S tanker carrying Russian oil in the Baltic Sea on suspicion of having caused an outage of an undersea electricity cable connecting Finland and Estonia, investigating potential sabotage.
Beijing Issues 2025 Product Export Quotas. China’s Ministry of Commerce issued the first batch of refined product quotas for next year totaling 19 million tonnes, unchanged year-over-year, with recent changes to the country’s 13% export tax rebate making gasoline and diesel exports sub-commercial.
The news from Beijing about product export quotas and the export tax rebate has several potential implications for the oil market, particularly refined products like gasoline and diesel, which could indirectly influence crude oil prices. Here's a breakdown:
Key Points:
Unchanged Export Quotas (19 Million Tonnes):
The quota is the same as last year, suggesting that China isn't planning a significant increase or decrease in refined product exports.
A stable quota means China's refining capacity and crude oil import needs might not shift drastically in the near term.
Export Tax Rebate Adjustment:
China's 13% export tax rebate on refined products like gasoline and diesel has been adjusted, making exports less profitable or even "sub-commercial" (not economically viable).
This discourages the export of refined products, potentially keeping more supply within China for domestic consumption.
Implications for Oil Prices:
Domestic Market Focus:
If China prioritizes domestic consumption over exports, its domestic demand for crude oil (used to produce refined products) might stay strong. This can be bullish for crude oil prices as China's overall demand remains a key driver.
Global Supply Dynamics:
Reduced exports of gasoline and diesel from China could tighten global supply of these refined products, potentially driving up their prices.
Higher refined product prices could encourage refineries worldwide to increase crude oil processing, boosting crude oil demand.
Market Sentiment:
The market might interpret this as a sign of strong domestic demand in China, which is generally positive for oil prices.
However, if global economic concerns dominate, the muted export quotas might limit the bullish effect.
Oil Price Volatility:
Oil prices could see short-term bullish momentum due to perceived demand strength and tighter refined product supply globally.
Traders might also be cautious, monitoring other factors like global economic data, OPEC+ decisions, and geopolitical tensions.
Conclusion:
This news leans slightly bullish for crude oil, as it signals steady domestic demand in China and potentially tighter global supply for refined products. However, how oil prices react depends on broader market sentiment and other macroeconomic factors. Since you've received a bullish signal on oil, the news could support the signal, but always keep an eye on additional developments and technical confirmations in the market.

WTI OIL Will it hold the 4H MA200 and rebound?WTI Oil (USOIL) almost tested on yesterday's pull-back the 4H MA200 (orange trend-line), following Monday's rebound on the former Lower Highs trend-line. This technical shift from a Resistance level turning Support, signifies the emergence of a new Channel Up pattern, which needs to hold the 4H MA200 in order to materialize the new Bullish Leg to a new Higher High.
The pattern's first Higher High was priced on the 71.45 Resistance (1) and if the current Higher Low holds at the bottom of the Channel Up, we expect an equally powerful Bullish Leg for the next Higher High. However the 1D MA100 (red trend-line) needs to break as it currently poses the strongest Resistance, having rejected the uptrend not just on the Resistance 1 test (December 13) but also yesterday (December 26).
As a result, if this level breaks, we expect the trend to hit at least Resistance 2 with our Target being $72.80.
-------------------------------------------------------------------------------
** Please LIKE 👍, FOLLOW ✅, SHARE 🙌 and COMMENT ✍ if you enjoy this idea! Also share your ideas and charts in the comments section below! This is best way to keep it relevant, support us, keep the content here free and allow the idea to reach as many people as possible. **
-------------------------------------------------------------------------------
💸💸💸💸💸💸
👇 👇 👇 👇 👇 👇

TradeCityPro | WTI Analysis Fundamental and Technical Insights👋 Welcome to TradeCityPro Channel!
Let’s step away from the crypto space and analyze West Texas Intermediate (WTI) from both technical and fundamental perspectives.
🌍 Fundamental Overview
Supply Dynamics: U.S. shale oil production and OPEC+ decisions are key drivers. Escalating tensions in the Middle East, such as the Israel-Gaza conflict or Iran-related sanctions, pose significant risks to global oil supply.
Demand Trends : Economic growth and seasonal fluctuations influence demand, but the rise of renewables signals a gradual reduction in reliance on crude oil.
Geopolitical Factors : The Middle East, a hub for major oil producers, heavily impacts markets. Regional conflicts often lead to price spikes due to supply concerns.
Macroeconomic Trends : A stronger U.S. dollar and rising interest rates suppress oil demand, while inflationary pressures support higher prices.
Recent instability in the Middle East has heightened market volatility, underlining WTI's sensitivity to geopolitical events.
🕒 4-Hour Time Frame
In the 4-hour timeframe, WTI has been trending downward, nearing a key daily support level at 66.938, which has held multiple times and may attract buyers, shifting momentum.
📈 Long Position Trigger
wait for the 4-hour trendline breakout and trigger confirmations, such as RSI exceeding 73.48. The current 4-hour candle breaking the trendline could signal entry.
📉 Short Position Trigger
if the candle is rejected and turns red with strong bearish momentum or breaks below 66.938, it could trigger a sell opportunity in the market.
📝 Final Thoughts
This analysis reflects our opinions and is not financial advice.
Share your thoughts in the comments, and don’t forget to share this analysis with your friends! ❤️

WTI OIL 4H RSI Bullish Divergence sending a strong buy signal.WTI Oil (USOIL) stopped yesterday's rebound on the 4H MA50 (blue trend-line) and is now on a small pull-back. Technically that is the Resistance level it needs to break if it wants to break-out aggressively towards the long-term Resistance Zone.
There are high probabilities of doing so, as the 4H RSI formed Higher Lows, which is a Bullish Divergence against the Lower Lows of the price. In fact, it is the exact same formation as the October 01 Low that rebounded aggressively above the 0.786 Fibonacci retracement level.
As a result, we are bullish on this one, targeting $76.00 (the 0.786 Fib currently).
-------------------------------------------------------------------------------
** Please LIKE 👍, FOLLOW ✅, SHARE 🙌 and COMMENT ✍ if you enjoy this idea! Also share your ideas and charts in the comments section below! This is best way to keep it relevant, support us, keep the content here free and allow the idea to reach as many people as possible. **
-------------------------------------------------------------------------------
💸💸💸💸💸💸
👇 👇 👇 👇 👇 👇

WTI oil making its way to lowest point of this year?The commodity is near a key are of support right now, so let's see if today's US economic data can continue boosting the US dollar. If so, WTI oil may end up traveling further south.
EASYMARKETS:OILUSD TVC:USOIL
Disclaimer:
easyMarkets Account on TradingView allows you to combine easyMarkets industry leading conditions, regulated trading and tight fixed spreads with TradingView's powerful social network for traders, advanced charting and analytics. Access no slippage on limit orders, tight fixed spreads, negative balance protection, no hidden fees or commission, and seamless integration.
Any opinions, news, research, analyses, prices, other information, or links to third-party sites contained on this website are provided on an "as-is" basis, are intended only to be informative, is not an advice nor a recommendation, nor research, or a record of our trading prices, or an offer of, or solicitation for a transaction in any financial instrument and thus should not be treated as such. The information provided does not involve any specific investment objectives, financial situation and needs of any specific person who may receive it. Please be aware, that past performance is not a reliable indicator of future performance and/or results. Past Performance or Forward-looking scenarios based upon the reasonable beliefs of the third-party provider are not a guarantee of future performance. Actual results may differ materially from those anticipated in forward-looking or past performance statements. easyMarkets makes no representation or warranty and assumes no liability as to the accuracy or completeness of the information provided, nor any loss arising from any investment based on a recommendation, forecast or any information supplied by any third-party.

WTI - Oil waiting for stabilization of regional conditions?!WTI oil is below the EMA200 and EMA50 in the 4H time frame and is moving in its downward channel. If the correction process continues and the resistance range is broken, you can first look for buying positions and then look for oil selling positions in the ceiling of the channel.
The Wall Street Journal analysis indicates that Donald Trump, the U.S. President-elect, intends to impose severe sanctions on Iran and restrict its oil sales. This move is part of an aggressive strategy to reduce Tehran’s support for its affiliated groups in the Middle East and to curb its nuclear program. During his first term, Trump withdrew from the Iran nuclear deal (JCPOA) and implemented a “maximum pressure” strategy. This analysis is from The Wall Street Journal.
Senior commodity analysts at TDS suggest that risks related to the Middle East are significantly underpriced. TDS analysts point out that the resolution of the current round of Middle East tensions could lead to reduced supply risks in the energy market.
In this regard, OPEC’s recent decision to delay additional oil supply has had only a limited impact on increasing supply risk and may not be sufficient in the medium term. According to analyses, if geopolitical stability regarding oil supply continues, there remains a likelihood of price declines.
TDS analysts also caution that threats such as the potential intensification of oil sanctions against Iran by President-elect Donald Trump could disrupt regional oil flows severely, as he might return to the “maximum pressure” policy on Tehran.
The Israeli Foreign Minister has stated that Israel is prepared to continue the Gaza war until its objectives are fully achieved. Progress has been made in ceasefire talks with Lebanon, though the main challenge will be implementing the agreements. The most critical issue for the region’s future is preventing Iran from obtaining nuclear weapons.
An Israeli senior official mentioned, “If Hezbollah does not accept the ceasefire, stronger military and operational plans have been prepared, which could include expanding control over more areas in Lebanon.”
Meanwhile, Russia is reportedly considering merging its major oil companies, including Rosneft, Gazprom Neft, and Lukoil, to create the world’s second-largest oil producer after Aramco. This merger could provide greater control over global energy markets and support Russia’s economy amid wartime conditions. However, the proposal faces opposition from some Rosneft and Lukoil executives and challenges in securing financing for Lukoil shareholders. Kremlin officials and company executives have denied knowledge of such a plan, and details of the proposal remain unclear.

WTI, back at major order block support -- BOUNCE expectedWTI is currently sitting at below 0.5 FIB level on a weekly data -- a key area where most buyers converge.
$65-70 area has been quite a solid order block support. It has been tested many times and oil keeps bouncing up from this range.
A bounce is expected from current price range. Accumulation has notably started increasing at the present levels.
Spotted at 69.0
TAYOR.
Safeguard capital always.
--------
RELATED NEWS: Reuters
Oil prices settle more than 3% higher after China rate cut
By Stephanie Kelly
NEW YORK, June 13 (Reuters) - Oil prices climbed over 3% on Tuesday on hopes for growing fuel demand after China's central bank lowered a short-term lending rate for the first time in 10 months, boosting crude prices after steep losses the previous session.
The rate cut is aimed at adding momentum to a hesitant post-pandemic recovery in the world's second-largest economy and biggest crude importer.
Brent crude futures settled up $2.45, or 3.4%, to $74.29 a barrel. U.S. West Texas Intermediate (WTI) crude gained $2.30, or 3.4%, at $69.42 a barrel.

WTI CRUDE OIL Final Resistance test before $77.50WTI Crude Oil hit today the 7 day Falling Resistance. A break above it will be bullish as that has been the case on 2 similar patterns previously.
We are ahead of a Golden Cross (1h), which on the 2 previous patterns, has confirmed the uptrend.
Trading Plan:
1. Buy if the Falling Resistance breaks.
Targets:
1. 77.50 (Resistance 1).
Tips:
1. The RSI (1h) is printing a pattern similar to the September run.
Please like, follow and comment!!

WTI CRUDE OIL: Turned bullish again after the 1D MA50 rebound.WTI Crude Oil turned bullish again on its 1D technical outlook (RSI = 59.281, MACD = 0.570, ADX = 33.404) as even though it breached through the 1D MA50 yesterday intraday, it managed to close the day over it and extend today with a green candle. It was not ideal that the rejection on Tuesday took place on the 1D MA200 but yesterday's 1D MA50 rebound has restored the bullish sentiment. We turn bullish again (TP = 80.00) all the way to the one year LH trendline and the 0.786 Fib.
See how our prior idea has worked out:
## If you like our free content follow our profile to get more daily ideas. ##
## Comments and likes are greatly appreciated. ##

WTI OIL 1D MA200 rejection giving the perfect sell.WTI Oil (USOIL) hit our 76.00 Target as presented on our September 24 idea (see chart below):
Today even though the price breached the 1D MA200 (orange trend-line), it has since been forcefully rejected. This is not a surprise as all medium-term rallies coming off a Support level bounce since June 2023, were all rejected on the short-term on the 1D MA200. The July 13 2023 one got rejected back to its 0.382 Fibonacci retracement level, while the January 29 2024 one dived lower to the 0.618 Fib.
The 1D RSI (red circles) indicates that we are currently exactly on such a rejection sequence. As a result, we turn bearish on WTI, expecting at least a 1D MA50 (blue trend-line) breach at 72.50, which is a Target marginally below the 0.382 Fib.
-------------------------------------------------------------------------------
** Please LIKE 👍, FOLLOW ✅, SHARE 🙌 and COMMENT ✍ if you enjoy this idea! Also share your ideas and charts in the comments section below! This is best way to keep it relevant, support us, keep the content here free and allow the idea to reach as many people as possible. **
-------------------------------------------------------------------------------
💸💸💸💸💸💸
👇 👇 👇 👇 👇 👇

WTI CRUDE OIL: Last short term buy.WTI Crude Oil is neutral on the 4H technical outlook (RSI = 51.729, MACD = 0.500, ADX = 25.961) as it pulled back to the 4H MA50 intra day. The fact that it held, suggests that it remains the short term support of this uptrend that is targeting the 4H MA200 (TP = 72.50) where so far we have had three straight rejections since August.
## If you like our free content follow our profile to get more daily ideas. ##
## Comments and likes are greatly appreciated. ##

CRUDE OIL (WTI) Intraday Bearish Confirmation
Update for our yesterday's setup on WTI Crude Oil.
The price successfully retested a broken structure.
Our intraday bearish confirmation is a breakout of a support line
of a bearish flag pattern on an hourly time frame.
The fall will continue now at least to 72.1
❤️Please, support my work with like, thank you!❤️

Waiting for WTI rebound. H4 30.08.2024 Waiting for WTI rebound
Oil WTI has been flattening with pullbacks all week, which is exhausting. My top-up was knocked out together with the rest of the last buy. Although the total plus came out due to partial fixation. Now the price is back to the key support area, it went down to the buyers' zone 73.34-72.63 and near the specified 1/2 margin. There are no large volumes, which is confusing, but they can make a buyback. Therefore, you should look here for confirmations on your strategy. If pushed the zones below, then the price will go to 71.

WTI Oil - 4HWTI oil completed its second bullish leg and has now formed a reversal setup. The price action shows that WTI missed the ascending channel support and is currently consolidating below the previous support zone, which has now turned into a resistance level. This suggests a potential bearish outlook as the price struggles to regain upward momentum.
With the recent break of the ascending channel, it is expected that WTI may continue its downward trajectory. The consolidation under the new resistance zone indicates seller strength, and further declines could be seen if the price fails to break back above this resistance. Traders should watch for key support levels around $81 and $78 for potential buy signals or continuation of the bearish trend.

USOILOil analysis
Time frame 4 hours and 12 hours
Middle oil oil broke and stabilized its 12-hour trading range. Now it has formed a new 4-hour trading range, the supply and demand areas of which are clear in the picture. The price is expected to return to the limit of $80.7 and move towards the target of $84 by filling the FVG.

Can Oil soar on June 2 OPEC+ cut hopes? Can Oil soar on June 2 OPEC+ cut hopes?
WTI crude futures and Brent continue to recover from three-month lows. The rebound is potentially driven by expectations that OPEC+ will extend its output cuts of 2.2 million barrels per day into the second half of the year during its June 2 meeting.
Additional support for crude prices came from the start of the U.S. summer driving season and a weaker dollar.
Further data on the demand side will come from upcoming U.S. PCE to gauge the Federal Reserve's future monetary policy. A softer-than-expected reading on the PCE could increase the possibility of interest rate cuts, and potentially enhance the demand for energy.
Deutsche Bank has maintained its Brent forecast at $83 per barrel for the second quarter and $88 for the second half of the year, assuming OPEC+ will sustain its current production policy on Sunday.
Should prices move above the $80 level, WTI could test the 50-day moving average just above $81.1. The RSI suggests there is still room for prices to rise before reaching the overbought zone. Conversely, if prices fall below the $78 range, they might stabilize around the $76 mark.

Let's see if it can climb back above the 78-dollar markEASYMARKETS:OILUSD
Disclaimer:
easyMarkets Account on TradingView allows you to combine easyMarkets industry leading conditions, regulated trading and tight fixed spreads with TradingView's powerful social network for traders, advanced charting and analytics. Access no slippage on limit orders, tight fixed spreads, negative balance protection, no hidden fees or commission, and seamless integration.
Any opinions, news, research, analyses, prices, other information, or links to third-party sites contained on this website are provided on an "as-is" basis, are intended only to be informative, is not an advice nor a recommendation, nor research, or a record of our trading prices, or an offer of, or solicitation for a transaction in any financial instrument and thus should not be treated as such. The information provided does not involve any specific investment objectives, financial situation and needs of any specific person who may receive it. Please be aware, that past performance is not a reliable indicator of future performance and/or results. Past Performance or Forward-looking scenarios based upon the reasonable beliefs of the third-party provider are not a guarantee of future performance. Actual results may differ materially from those anticipated in forward-looking or past performance statements. easyMarkets makes no representation or warranty and assumes no liability as to the accuracy or completeness of the information provided, nor any loss arising from any investment based on a recommendation, forecast or any information supplied by any third-party.
