WTI Oil H4 | Rising into 50% Fibonacci retracementWTI oil (USOIL) is rising towards a pullback resistance and could potentially reverse off this level to drop lower.
Sell entry is at 69.23 which is a pullback resistance that aligns with the 50.0% Fibonacci retracement.
Stop loss is at 70.70 which is a level that sits above the 61.8% Fibonacci retracement and a multi-swing-high resistance.
Take profit is at 66.44 which is a multi-swing-low support.
High Risk Investment Warning
Trading Forex/CFDs on margin carries a high level of risk and may not be suitable for all investors. Leverage can work against you.
Stratos Markets Limited (www.fxcm.com):
CFDs are complex instruments and come with a high risk of losing money rapidly due to leverage. 63% of retail investor accounts lose money when trading CFDs with this provider. You should consider whether you understand how CFDs work and whether you can afford to take the high risk of losing your money.
Stratos Europe Ltd (www.fxcm.com):
CFDs are complex instruments and come with a high risk of losing money rapidly due to leverage. 63% of retail investor accounts lose money when trading CFDs with this provider. You should consider whether you understand how CFDs work and whether you can afford to take the high risk of losing your money.
Stratos Trading Pty. Limited (www.fxcm.com):
Trading FX/CFDs carries significant risks. FXCM AU (AFSL 309763), please read the Financial Services Guide, Product Disclosure Statement, Target Market Determination and Terms of Business at www.fxcm.com
Stratos Global LLC (www.fxcm.com):
Losses can exceed deposits.
Please be advised that the information presented on TradingView is provided to FXCM (‘Company’, ‘we’) by a third-party provider (‘TFA Global Pte Ltd’). Please be reminded that you are solely responsible for the trading decisions on your account. There is a very high degree of risk involved in trading. Any information and/or content is intended entirely for research, educational and informational purposes only and does not constitute investment or consultation advice or investment strategy. The information is not tailored to the investment needs of any specific person and therefore does not involve a consideration of any of the investment objectives, financial situation or needs of any viewer that may receive it. Kindly also note that past performance is not a reliable indicator of future results. Actual results may differ materially from those anticipated in forward-looking or past performance statements. We assume no liability as to the accuracy or completeness of any of the information and/or content provided herein and the Company cannot be held responsible for any omission, mistake nor for any loss or damage including without limitation to any loss of profit which may arise from reliance on any information supplied by TFA Global Pte Ltd.
The speaker(s) is neither an employee, agent nor representative of FXCM and is therefore acting independently. The opinions given are their own, constitute general market commentary, and do not constitute the opinion or advice of FXCM or any form of personal or investment advice. FXCM neither endorses nor guarantees offerings of third-party speakers, nor is FXCM responsible for the content, veracity or opinions of third-party speakers, presenters or participants.
WTI

WTI Price Analysis: Key Insights for Next Week Trading DecisionOil prices are showing signs of recovery after a strong bearish move, with $68.00 as a key level that will play a significant role in guiding our trading decisions for the new week.
📌 Key Technical Outlook:
🔹 Oil is currently trading within an ascending channel on the 4H timeframe.
🔹 I’ll be watching for a breakout/retest of the channel resistance and $68.50 for buying opportunities.
🔹 If selling pressure remains below the resistance line of the channel and the $68.00 key level, I will be considering selling opportunities.
📌 Major Market Drivers:
🔹 US Sanctions on Iran: The US Treasury imposed new sanctions targeting entities involved in supplying Iranian crude oil to China. Analysts expect a 1 million bpd drop in Iranian exports, which could support prices.
🔹 OPEC+ Production Cuts: A new plan will see seven member nations cut production by 189,000–435,000 bpd per month until June 2026.
🔹 Geopolitical Risks: Ongoing tensions in the Middle East & the Russia-Ukraine war continue to add a risk premium to oil prices.
📅 Key Economic Events on Our Radar Next Week:
🛢 Tuesday: API Crude Oil Stock Report – Offers insight into US oil inventory levels.
🛢 Wednesday: EIA Crude Oil Inventories Report – A key supply indicator affecting price movements.
🗓 Tuesday: US S&P Global PMI – Important for economic sentiment and demand expectations.
🗓 Thursday: US GDP (Q4 Final) – Provides clues on economic growth and potential impact on oil demand.
🗓 Friday: US Core PCE Index – The Fed’s preferred inflation measure, critical for policy direction.
Oil remains bullish in the short term, but I’ll be monitoring price action closely at $68.00 and $68.50 for trade setups. We’ll break it all down in Forex Morning Mastery tomorrow—stay tuned! 🔥📈

WTI - Positioning for Upside After Anticipated CorrectionThe US Light Crude 4-hour chart shows price action currently oscillating near the $68,60 level after recovering from early March lows. The recent price structure suggests we may see a short-term pullback before a stronger upward move develops. The chart indicates a potential bullish scenario with price expected to eventually rally toward the blue reaction zone (around $69,00-$69,50) after a possible retracement. This anticipated upside move is supported by the higher lows forming since mid-March and the overall recovery pattern from the $65,67 support level (marked by the red line). A prudent approach would be monitoring for reversal signs at lower levels before positioning for the higher probability move toward the blue reaction zone, with the orange resistance at $70,77 serving as the ultimate target if bullish momentum accelerates.
Disclosure: I am part of Trade Nation's Influencer program and receive a monthly fee for using their TradingView charts in my analysis.

WATCH OUT FOR OIL'S DESCENDING TRIANGLE...A potential close above 70 will signal the likelihood of oil price to test trendline is sloping downward or the bearish order candle.
N.B!
- USOIL price might not follow the drawn lines . Actual price movements may likely differ from the forecast.
- Let emotions and sentiments work for you
- ALWAYS Use Proper Risk Management In Your Trades
#usoil
#wti
#ukoil
BRIEFING Week #12 : Alt-Season might be coming soonHere's your weekly update ! Brought to you each weekend with years of track-record history..
Don't forget to hit the like/follow button if you feel like this post deserves it ;)
That's the best way to support me and help pushing this content to other users.
Kindly,
Phil

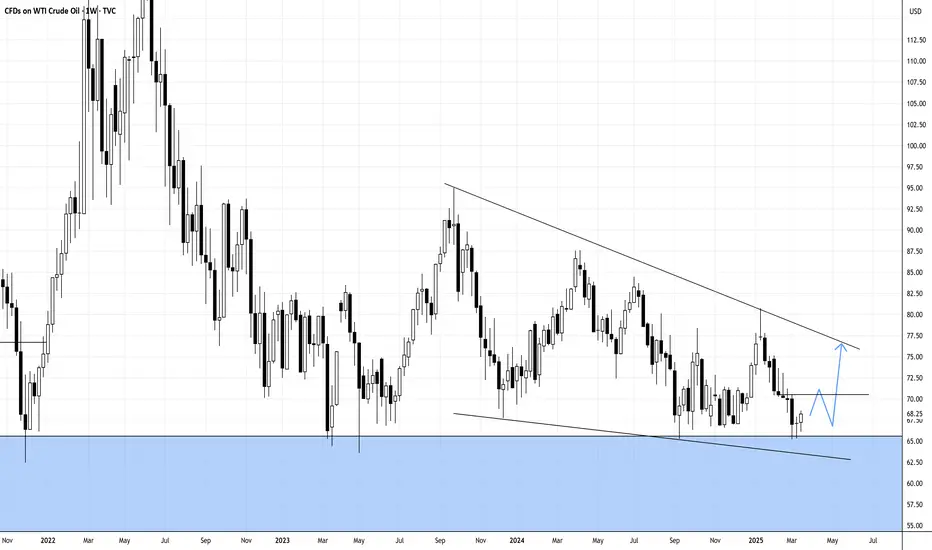
WTI CRUDE OIL: Hard rebound on 1.5 year support targeting $72.WTI Crude Oil is neutral on its 1D technical outlook (RSI = 48.748, MACD = -1.080, ADX = 23.603), which indicates the slow transition from a bearish trend to bullish. This started when the price hit the S1 level, a 1.5 year Support, and bottomed. The slow rebound that we're having since formed a Channel Up on a bullish 1D RSI, much like the one in September 2024, which eventually peaked after a +10.70% price increase. A similar rebound is expected to test the 1D MA200. The trade is long, TP = 72.00.
## If you like our free content follow our profile to get more daily ideas. ##
## Comments and likes are greatly appreciated. ##

CRUDE OIL Free Signal! Sell!
Hello,Traders!
CRUDE OIL made a sharp
And sudden move up
And it seems that it will
Soon hit a horizontal
Resistance level of 68.80$
From where we can go short
On Oil with the TP of 67.67$
And the SL of 68.87$
Sell!
Comment and subscribe to help us grow!
Check out other forecasts below too!
Disclosure: I am part of Trade Nation's Influencer program and receive a monthly fee for using their TradingView charts in my analysis.

CL1! Crude Oil Short TermTrump Letter Gave Iran Two-Month Deadline for Nuclear Deal
Intraday short term Entry+Prfofit Target
Sell1 Entry
Sell2-5 Incase missing the first entry or to cover

WTI Possible Scenarios:
1- Bullish Scenario:
If the price holds above 66.160, it could push towards 67.900, filling the Fair Value Gap.
A break above 67.900 could confirm further upside potential.
2-Bearish Scenario:
If price breaks below 65.800, it could signal further downside towards 65.500 or lower.
The trendline resistance could push price lower if rejection occurs.
Entry Zone: Around 66.160.
Stop Loss: Around 65.800.
Target Price: Around 67.895.

USOIL BREAKOUT FROM THE WEDGE|SHORT|
✅CRUDE OIL is trading in a
Downtrend and the price broke
Out of the bearish wedge pattern
And the breakout is confirmed
Because the 4H candle closed
Way below the wedge's support
So we are bearish biased and
We will be expecting a
Further bearish move down
SHORT🔥
✅Like and subscribe to never miss a new idea!✅
Disclosure: I am part of Trade Nation's Influencer program and receive a monthly fee for using their TradingView charts in my analysis.

Crude oil turns lower on Putin-Trump callBoth oil contracts are now lower on the day, giving up earlier gains. From the day's high, WTI is now 2.8% lower and counting as prices test the day's lows. Oil prices moved lower on hints/hopes of peace from the just-finished Trump & Putin talks. The rationale here is that any peace progress would increase the chances of removing sanctions on Russian oil shipments, increasing global supplies.
WTI has held the trend resistance and old support-now-resistance at $68.45. The inverted daily hammer candle, if completed, would point to more weakness in the days ahead. As such, we could see prices dip down to test waters below recent lows of just north of $65.00 handle - a level last tested back in September 2024. A potential break below that could pave the way for a test of the May 2023 low of $63.60.
By Fawad Razaqzada, market analyst with FOREX.com

WTI OIL turned the 4H MA50 into Support and aiming higher.WTI Oil (USOIL) has broken above the bearish trend of the former Lower Highs and a Channel Up emerged. The 4H MA50 (blue trend-line) broke for the first time in almost a month and has now been turned into Support.
As long as this holds, we expect Oil to target the 4H MA200 (orange trend-line) at $70.
-------------------------------------------------------------------------------
** Please LIKE 👍, FOLLOW ✅, SHARE 🙌 and COMMENT ✍ if you enjoy this idea! Also share your ideas and charts in the comments section below! This is best way to keep it relevant, support us, keep the content here free and allow the idea to reach as many people as possible. **
-------------------------------------------------------------------------------
Disclosure: I am part of Trade Nation's Influencer program and receive a monthly fee for using their TradingView charts in my analysis.
💸💸💸💸💸💸
👇 👇 👇 👇 👇 👇

WTI increased slightly and decreased rapidly, downtrend TVC:USOIL prices rose slightly by about 1% in Asian trading on Monday before falling sharply, largely due to the continued US military crackdown on Houthi militias.
US Pete Hegseth said on Sunday that the US military will continue to fight the Houthis until they stop attacking international shipping lanes. The US has previously conducted airstrikes in Yemen, causing casualties among Houthi fighters.
The Houthis have hinted that they could take stronger retaliatory actions, adding to market concerns that the situation in the Red Sea will continue to escalate.
While geopolitical tensions pushed oil prices higher, concerns about global economic growth limited gains.
Goldman Sachs analysts have lowered their oil price forecasts based on the following points:
• The Trump administration’s new tariffs on Mexico and Canada could restrict global trade and lead to lower-than-previously expected US economic growth.
• The slowdown in economic growth will lead to lower oil demand, and Goldman Sachs expects oil demand growth in the coming months to be lower than previously estimated by the market.
• OPEC+ supply could exceed expectations, and while the market is currently focused on the situation in the Middle East, overall supply remains relatively abundant.
• The market expects signs of a slowdown in the US economy to keep oil prices under pressure in the long term, although geopolitical factors could still support prices in the short term. In addition, the market is paying attention to the Federal Reserve's interest rate meeting on March 18-19. The market expects the Fed to keep interest rates unchanged while continuing to assess the impact of the Trump administration's policies on the economy. If the economic outlook continues to deteriorate, the possibility of the Federal Reserve adjusting its policy this year cannot be ruled out.
WTI Crude Oil Technical Outlook Analysis TVC:USOIL
On the daily chart, WTI crude oil is temporarily in the accumulation phase but with the current position and structure, the downtrend is still dominant with the short-term trend being noticed by the price channel, the medium-term by the price channel and the nearest pressure from the EMA21.
The recovery momentum of WTI crude oil is also limited by the 0.50% Fibonacci extension level, and as long as crude oil fails to move above the EMA21 and break above the price channel, it still has a main bearish outlook.
In the short term, the downside target is around $65, the low since September 10, 2024, followed by the 0.786% Fibonacci extension. Notable positions for the WTI crude oil downside trend will be listed again as follows.
Support: $66.63 – $65.33
Resistance: $67.85 – $68.52 – $69.07

#USOIL/WTI 1 DAYUSOIL/WTI (1D Timeframe) Analysis
Market Structure:
The price is currently trading near a key support level, which has previously acted as a strong demand zone. Buyers may step in at this level, leading to a potential reversal or bounce.
Forecast:
A buy opportunity is expected if the price holds above the support level and shows signs of bullish momentum. Confirmation through price action, such as bullish candlestick patterns or increased volume, can strengthen the trade setup.
Key Levels to Watch:
- Entry Zone: Consider buying near the support level if the price confirms a bounce.
- Risk Management:
- Stop Loss: Placed below the support level to manage downside risk.
- Take Profit: Target resistance levels or previous swing highs for potential gains.
Market Sentiment:
If the support level holds, the market sentiment may shift towards the upside, leading to a potential bullish move. However, a breakdown below support could indicate further weakness, requiring reassessment.

WTI - Weekly Forecast - Technical Analysis & Trading IdeasMidterm forecast:
While the price is above the support 64.000, resumption of uptrend is expected.
We make sure when the resistance at 79.361 breaks.
If the support at 64.000 is broken, the short-term forecast -resumption of uptrend- will be invalid.
TVC:USOIL BLACKBULL:WTI
Technical analysis:
A peak is formed in daily chart at 79.355 on 01/15/2025, so more losses to support(s) 64.900 and minimum to Major Support (64.000) is expected.
Take Profits:
68.354
70.182
72.434
74.449
77.410
79.361
83.961
87.000
93.882
100.802
109.192
126.350
__________________________________________________________________
❤️ If you find this helpful and want more FREE forecasts in TradingView,
. . . . . . . . Hit the 'BOOST' button 👍
. . . . . . . . . . . Drop some feedback in the comments below! (e.g., What did you find most useful? How can we improve?)
🙏 Your support is appreciated!
Now, it's your turn!
Be sure to leave a comment; let us know how you see this opportunity and forecast.
Have a successful week,
ForecastCity Support Team

BRIEFING Week #11 : Are we done ? (nope)Here's your weekly update ! Brought to you each weekend with years of track-record history..
Don't forget to hit the like/follow button if you feel like this post deserves it ;)
That's the best way to support me and help pushing this content to other users.
Kindly,
Phil

WTI Oil H4 | Rising into an overlap resistanceWTI oil (USOIL) is rising towards an overlap resistance and could potentially reverse off this level to drop lower.
Sell entry is at 68.46 which is an overlap resistance that aligns with the 38.2% Fibonacci retracement.
Stop loss is at 70.70 which is a level that sits above the 61.8% Fibonacci retracement and a multi-swing-high resistance.
Take profit is at 65.20 which is a multi-swing-low support.
High Risk Investment Warning
Trading Forex/CFDs on margin carries a high level of risk and may not be suitable for all investors. Leverage can work against you.
Stratos Markets Limited (www.fxcm.com):
CFDs are complex instruments and come with a high risk of losing money rapidly due to leverage. 63% of retail investor accounts lose money when trading CFDs with this provider. You should consider whether you understand how CFDs work and whether you can afford to take the high risk of losing your money.
Stratos Europe Ltd (www.fxcm.com):
CFDs are complex instruments and come with a high risk of losing money rapidly due to leverage. 63% of retail investor accounts lose money when trading CFDs with this provider. You should consider whether you understand how CFDs work and whether you can afford to take the high risk of losing your money.
Stratos Trading Pty. Limited (www.fxcm.com):
Trading FX/CFDs carries significant risks. FXCM AU (AFSL 309763), please read the Financial Services Guide, Product Disclosure Statement, Target Market Determination and Terms of Business at www.fxcm.com
Stratos Global LLC (www.fxcm.com):
Losses can exceed deposits.
Please be advised that the information presented on TradingView is provided to FXCM (‘Company’, ‘we’) by a third-party provider (‘TFA Global Pte Ltd’). Please be reminded that you are solely responsible for the trading decisions on your account. There is a very high degree of risk involved in trading. Any information and/or content is intended entirely for research, educational and informational purposes only and does not constitute investment or consultation advice or investment strategy. The information is not tailored to the investment needs of any specific person and therefore does not involve a consideration of any of the investment objectives, financial situation or needs of any viewer that may receive it. Kindly also note that past performance is not a reliable indicator of future results. Actual results may differ materially from those anticipated in forward-looking or past performance statements. We assume no liability as to the accuracy or completeness of any of the information and/or content provided herein and the Company cannot be held responsible for any omission, mistake nor for any loss or damage including without limitation to any loss of profit which may arise from reliance on any information supplied by TFA Global Pte Ltd.
The speaker(s) is neither an employee, agent nor representative of FXCM and is therefore acting independently. The opinions given are their own, constitute general market commentary, and do not constitute the opinion or advice of FXCM or any form of personal or investment advice. FXCM neither endorses nor guarantees offerings of third-party speakers, nor is FXCM responsible for the content, veracity or opinions of third-party speakers, presenters or participants.


WTI OIL Massive 4-year Support hit. Bullish reversal ahead??WTI Oil (USOIL) hit on last week's 1W candle the 1M MA100 (red trend-line), a massive long-term Support level that has been holding since the week of April 26 2021, i.e. almost 4 years.
At the same time, the price entered the 2-year Support Zone, which has produced all major Bullish Phases (green Rectangles) during this time span. The last one got rejected twice on the 1W MA200 (orange trend-line).
Given the fact that this most recent rejection formed the current 2-month Bearish Phase (red Rectangle), which even based on 1W RSI terms, is similar to all previous Bearish Phases that found Support on the 2-year Support Zone, we have a massive long-term Support Cluster in front of us.
Naturally, until the 1W MA200 breaks, that should be the first Target of any buy attempts. As a result, we expect $80.00 to be tested by June 2025 the earliest.
-------------------------------------------------------------------------------
** Please LIKE 👍, FOLLOW ✅, SHARE 🙌 and COMMENT ✍ if you enjoy this idea! Also share your ideas and charts in the comments section below! This is best way to keep it relevant, support us, keep the content here free and allow the idea to reach as many people as possible. **
-------------------------------------------------------------------------------
Disclosure: I am part of Trade Nation's Influencer program and receive a monthly fee for using their TradingView charts in my analysis.
💸💸💸💸💸💸
👇 👇 👇 👇 👇 👇

WTI Crude Oil Analysis: Is the Downtrend Still in Play?Welcome back, guys! 👋 I'm Skeptic , and today we’re diving into a quick analysis of WTI Crude Oil (WTI) . Let’s break it down.
📉 4-Hour Time Frame Analysis
In the 4-hour time frame, WTI has shown a very strong corrective move, and despite trying to hold the support zone PRZ, it even failed to maintain it, suggesting a potential downtrend. Now, we have an opportunity to focus more on our short setups, but we’ll need to manage the risk as well.
🔮 Short Setup
For short positions, a break below the 4-hour support at 65.183 would be a good trigger to enter a short position. Place the stop loss just above the broken PRZ, around 67.024 , and keep an eye on price action as a sharp movement down could follow. If the support breaks, we’re likely to see a continuation towards the next support level, so the move could be pretty sharp, but make sure your stop loss is tight to manage risk effectively.
💡 Long Setup
For the long setup, we’ll wait for a potential fake breakout below the support and then look for a return above 67.024 . If we break above the resistance at 67.639 , we’ll look for a possible long continuation. However, since the current trend is bearish, we’ll reduce our risk and wait for confirmation from the 4-hour or daily time frames before entering.
Let me know your thoughts and ideas on WTI! 💬 Drop any questions in the comments, and I’ll be happy to discuss them. Let’s grow together, not alone! 🔥

OIL / WTI PoV - LONGThe analysis of the current oil price highlights the $65/66 range as a critical level for a potential rally. After a period of consolidation and corrections in recent weeks, oil seems to have found strong support around these levels, with prices oscillating between $65 and $66 per barrel. These levels represent an important liquidity zone, as in the past, the price has found support here, suggesting that there could be an opportunity for a bullish rebound if the price manages to remain stable above this threshold.
A rally above the $65/66 level could be supported by several fundamental factors, including improved demand prospects, a reduction in global inventories, and potential policies from OPEC. If demand for oil increases, especially with economic recoveries in certain regions or a rise in industrial production globally, there could be further support for prices. Additionally, OPEC+'s stance in the production-limiting agreement and potential supply cuts could keep the market tight, pushing prices higher.
Geopolitical dynamics also play a significant role in determining the direction of oil. Any tensions or disruptions in supply from key producing countries, such as those in the Middle East, could serve as catalysts for further price increases. Another factor that could support prices is the depreciation of the dollar, which typically benefits oil, as the commodity is priced in dollars.
However, if the price fails to maintain stability above the $65/66 level, we might see a new correction phase, with prices possibly retreating to lower levels. A move away from these levels could mark the beginning of a new bearish phase, with the risk of prices sliding back towards $60 per barrel or even lower if demand weakens or if there are supply excesses in the market.
In summary, the $65/66 level is crucial for the price of oil. Maintaining or closing above these levels could pave the way for a rally, while failure to do so could lead to further price weakening. With OPEC+ policies playing a key role in balancing the market, the next few months will be critical in determining the future direction of oil prices.

WTI Oil H4 | Overhead pressures remain in place?WTI oil (USOIL) is rising towards an overlap resistance and could potentially reverse off this level to drop lower.
Sell entry is at 68.46 which is an overlap resistance that aligns with the 38.2% Fibonacci retracement.
Stop loss is at 70.70 which is a level that sits above the 61.8% Fibonacci retracement and a multi-swing-high resistance.
Take profit is at 65.20 which is a swing-low support.
High Risk Investment Warning
Trading Forex/CFDs on margin carries a high level of risk and may not be suitable for all investors. Leverage can work against you.
Stratos Markets Limited (www.fxcm.com):
CFDs are complex instruments and come with a high risk of losing money rapidly due to leverage. 63% of retail investor accounts lose money when trading CFDs with this provider. You should consider whether you understand how CFDs work and whether you can afford to take the high risk of losing your money.
Stratos Europe Ltd (www.fxcm.com):
CFDs are complex instruments and come with a high risk of losing money rapidly due to leverage. 63% of retail investor accounts lose money when trading CFDs with this provider. You should consider whether you understand how CFDs work and whether you can afford to take the high risk of losing your money.
Stratos Trading Pty. Limited (www.fxcm.com):
Trading FX/CFDs carries significant risks. FXCM AU (AFSL 309763), please read the Financial Services Guide, Product Disclosure Statement, Target Market Determination and Terms of Business at www.fxcm.com
Stratos Global LLC (www.fxcm.com):
Losses can exceed deposits.
Please be advised that the information presented on TradingView is provided to FXCM (‘Company’, ‘we’) by a third-party provider (‘TFA Global Pte Ltd’). Please be reminded that you are solely responsible for the trading decisions on your account. There is a very high degree of risk involved in trading. Any information and/or content is intended entirely for research, educational and informational purposes only and does not constitute investment or consultation advice or investment strategy. The information is not tailored to the investment needs of any specific person and therefore does not involve a consideration of any of the investment objectives, financial situation or needs of any viewer that may receive it. Kindly also note that past performance is not a reliable indicator of future results. Actual results may differ materially from those anticipated in forward-looking or past performance statements. We assume no liability as to the accuracy or completeness of any of the information and/or content provided herein and the Company cannot be held responsible for any omission, mistake nor for any loss or damage including without limitation to any loss of profit which may arise from reliance on any information supplied by TFA Global Pte Ltd.
The speaker(s) is neither an employee, agent nor representative of FXCM and is therefore acting independently. The opinions given are their own, constitute general market commentary, and do not constitute the opinion or advice of FXCM or any form of personal or investment advice. FXCM neither endorses nor guarantees offerings of third-party speakers, nor is FXCM responsible for the content, veracity or opinions of third-party speakers, presenters or participants.

WTI CRUDE OIL: 4H Channel Down targeting 64.00WTI Crude Oil is almost oversold on its 1D technical outlook (RSI = 33.014, MACD = -1.680, ADX = 27.887) but on the lower 4h timeframe its formed a Channel Down that just completed a peak formation. This indicates that it is ready for its next bearish wave, with the previous two registering -6.55% declines. The trade is short, TP = 64.00.
## If you like our free content follow our profile to get more daily ideas. ##
## Comments and likes are greatly appreciated. ##
